

MBD5 and MBD6 couple DNA methylation to gene silencing through the J-domain protein SILENZIO
- PMID: 34083448
- PMCID: PMC8639832
- DOI: 10.1126/science.abg6130
MBD5 and MBD6 couple DNA methylation to gene silencing through the J-domain protein SILENZIO
Abstract
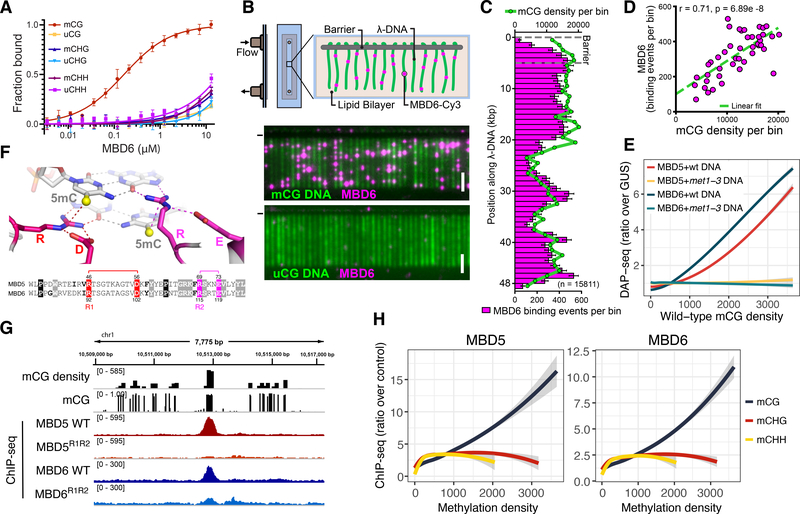
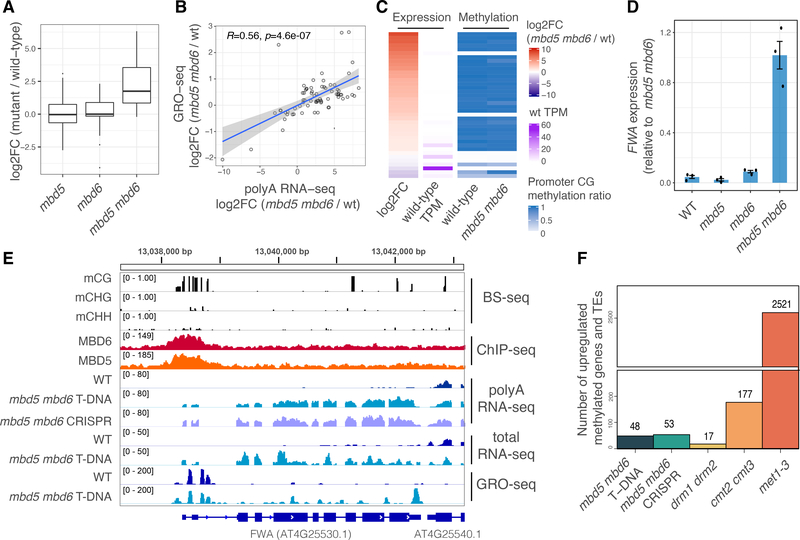
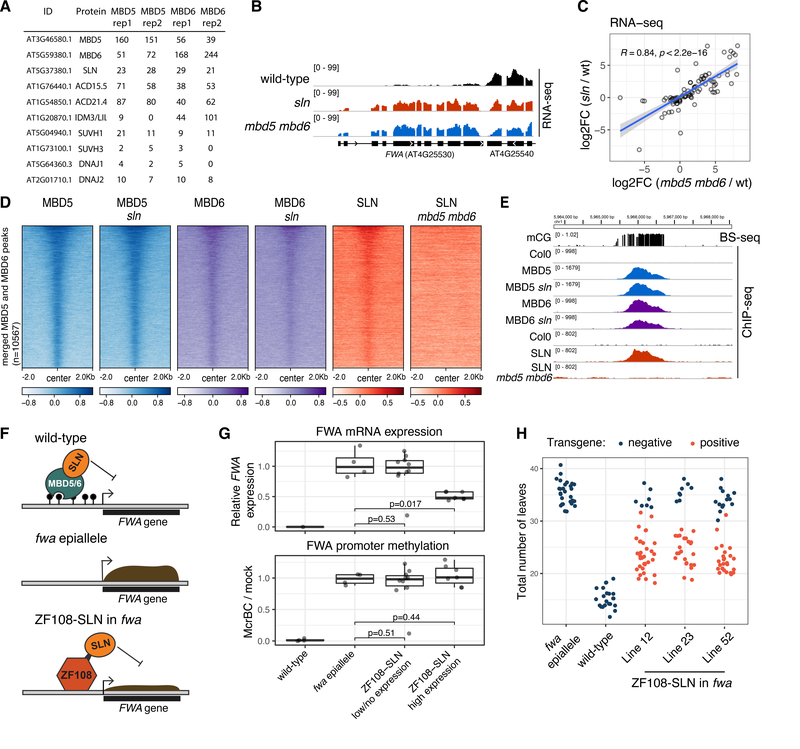
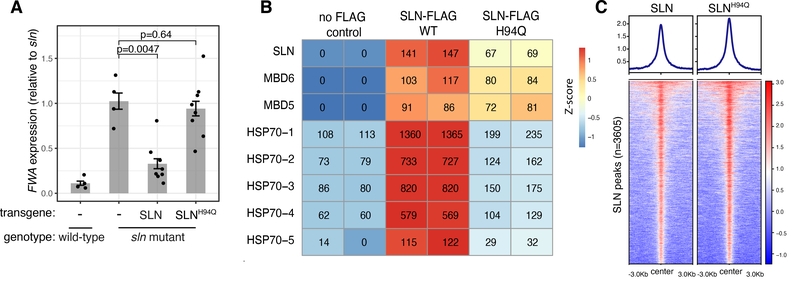
DNA methylation is associated with transcriptional repression of eukaryotic genes and transposons, but the downstream mechanism of gene silencing is largely unknown. Here we describe two Arabidopsis methyl-CpG binding domain proteins, MBD5 and MBD6, that are recruited to chromatin by recognition of CG methylation, and redundantly repress a subset of genes and transposons without affecting DNA methylation levels. These methyl-readers recruit a J-domain protein, SILENZIO, that acts as a transcriptional repressor in loss-of-function and gain-of-function experiments. J-domain proteins often serve as co-chaperones with HSP70s. Indeed, we found that SILENZIO's conserved J-domain motif was required for its interaction with HSP70s and for its silencing function. These results uncover an unprecedented role of a molecular chaperone J-domain protein in gene silencing downstream of DNA methylation.
Copyright © 2021, American Association for the Advancement of Science.
Conflict of interest statement
Figures
Similar articles
-
ACD15, ACD21, and SLN regulate the accumulation and mobility of MBD6 to silence genes and transposable elements.Sci Adv. 2023 Nov 17;9(46):eadi9036. doi: 10.1126/sciadv.adi9036. Epub 2023 Nov 15. Sci Adv. 2023. PMID: 37967186 Free PMC article.
-
Single-nucleus RNA-seq reveals that MBD5, MBD6, and SILENZIO maintain silencing in the vegetative cell of developing pollen.Cell Rep. 2022 Nov 22;41(8):111699. doi: 10.1016/j.celrep.2022.111699. Cell Rep. 2022. PMID: 36417865 Free PMC article.
-
MBD2 couples DNA methylation to transposable element silencing during male gametogenesis.Nat Plants. 2024 Jan;10(1):13-24. doi: 10.1038/s41477-023-01599-3. Epub 2024 Jan 15. Nat Plants. 2024. PMID: 38225352 Free PMC article.
-
Methyl-CpG-binding domain proteins: readers of the epigenome.Epigenomics. 2015;7(6):1051-73. doi: 10.2217/epi.15.39. Epub 2015 Apr 30. Epigenomics. 2015. PMID: 25927341 Review.
-
J-like protein family of Arabidopsis thaliana: the enigmatic cousins of J-domain proteins.Plant Cell Rep. 2022 Jun;41(6):1343-1355. doi: 10.1007/s00299-022-02857-y. Epub 2022 Mar 15. Plant Cell Rep. 2022. PMID: 35290497 Review.
Cited by
-
ACD15, ACD21, and SLN regulate the accumulation and mobility of MBD6 to silence genes and transposable elements.Sci Adv. 2023 Nov 17;9(46):eadi9036. doi: 10.1126/sciadv.adi9036. Epub 2023 Nov 15. Sci Adv. 2023. PMID: 37967186 Free PMC article.
-
The impacts of allopolyploidization on Methyl-CpG-Binding Domain (MBD) gene family in Brassica napus.BMC Plant Biol. 2022 Mar 7;22(1):103. doi: 10.1186/s12870-022-03485-0. BMC Plant Biol. 2022. PMID: 35255818 Free PMC article.
-
CCND1-associated ceRNA network reveal the critical pathway of TPRG1-AS1-hsa-miR-363-3p-MYO1B as a prognostic marker for head and neck squamous cell carcinoma.Sci Rep. 2023 Jul 22;13(1):11831. doi: 10.1038/s41598-023-38847-7. Sci Rep. 2023. PMID: 37481637 Free PMC article.
-
Transposon dynamics in the emerging oilseed crop Thlaspi arvense.PLoS Genet. 2024 Jan 31;20(1):e1011141. doi: 10.1371/journal.pgen.1011141. eCollection 2024 Jan. PLoS Genet. 2024. PMID: 38295109 Free PMC article.
-
Zebrafish Mbd5 binds to RNA m5C and regulates histone deubiquitylation and gene expression in development metabolism and behavior.Nucleic Acids Res. 2024 May 8;52(8):4257-4275. doi: 10.1093/nar/gkae093. Nucleic Acids Res. 2024. PMID: 38366571 Free PMC article.
References
-
- Goll MG, Bestor TH, Eukaryotic Cytosine Methyltransferases. Annual Review of Biochemistry. 74, 481–514 (2005). - PubMed
-
- Zemach A, McDaniel IE, Silva P, Zilberman D, Genome-wide evolutionary analysis of eukaryotic DNA methylation. Science. 328, 916–919 (2010). - PubMed
-
- Baubec T, Ivánek R, Lienert F, Schübeler D, Methylation-Dependent and -Independent Genomic Targeting Principles of the MBD Protein Family. Cell. 153, 480–492 (2013). - PubMed
-
- Shimbo T, Wade PA, Proteins that read DNA methylation. Advances in Experimental Medicine and Biology. 945, 303–320 (2016). - PubMed
