

doi: 10.1038/s41392-021-00605-4.
FBXO15 plays a critical suppressive functional role in regulation of breast cancer progression
Affiliations
- PMID: 34083507
- PMCID: PMC8175582
- DOI: 10.1038/s41392-021-00605-4
Item in Clipboard
FBXO15 plays a critical suppressive functional role in regulation of breast cancer progression
Signal Transduct Target Ther.
.
No abstract available
Conflict of interest statement
The authors declare no competing interests.
Figures
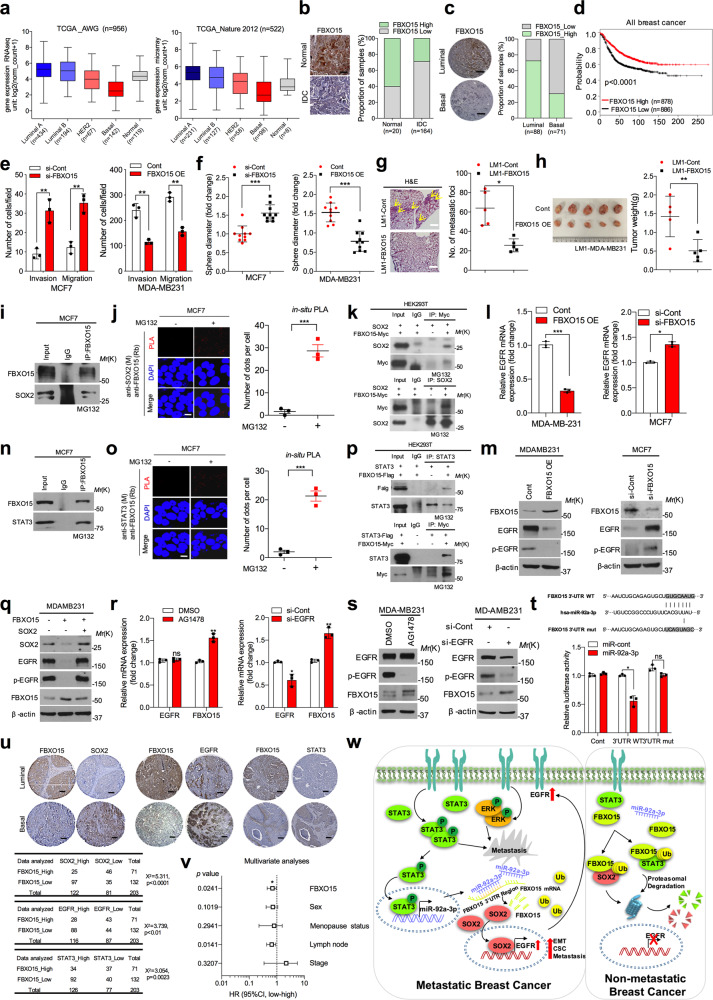
a Log2 expression value of FBXO15 in breast cancer subtypes defined by PAM50 expression from RNA-seq (left) and microarray (right) data using the data from the TCGA_AWG and TCGA_Nature 2012 breast cancer database, respectively. b Representative IHC images of FBXO15 staining in normal and invasive ductal carcinoma (IDC) cancer tissues (left), and the graph shows the FBXO15-positive fraction of each group (right). The IHC test gives a score of 0 to 3 that measures the amount of FBXO15 protein staining in a breast cancer tissue. The score is 0 to 1 called low expression; the score is 2 to 3 called high expression. Image J software was used for analysis. c Images of IHC staining of FBXO15 expression in tissues from the luminal and basal types of breast cancer (left) and the proportion of FBXO15 expression is shown in the graph (right), scale bar = 100 μm. d. Kaplan–Meier survival analysis showed that high expression of FBXO15 corresponded with a better patient survival rate in all breast cancer patients. e Invasion and migration assays were performed to determine the number of cells after silencing FBXO15 in MCF7 cells or overexpressing FBXO15 in MDA-MB231 cells. f Sphere formation assay was performed using the same transfected cells, and the colony size were measured and shown in a graph. g Representative images of H&E staining of lung metastasis and the number of lung metastatic foci of each mouse with orthotopic xenografts. h Images of mouse tumors and the graph showed tumor weights from the control and FBXO15-overexpressed xenograft groups (n = 5 for each group). i Immunoprecipitation assay was performed, and the cell lysate was immunoprecipitated with an FBXO15 antibody or an immunoglobulin G (lgG) control to detect the endogenous protein interaction between FBXO15 and SOX2 in MCF7 cells. The cells were treated with MG132 (10 μM) for 6 h before harvest. j Representative confocal images and graph of cells with PLA-positive signal using MCF7 cells fixed with anti-SOX2 (M) and anti-FBXO15 (Rb). The graph showed the number of dots per cell which was counted using ImageJ software. Scale bar = 100 μm. k Co-immunoprecipitation assay indicating the interaction of FBXO15 and SOX2 using HEK293T cells. Cells were treated with MG132 (10 μM) for 6 h, and then, cell lysates were immunoprecipitated to pull down SOX2 and Myc-tagged protein. l, m QRT-PCR and western blotting analysis were performed to check EGFR or p-EGFR mRNA and protein expression levels after overexpressing or knock-down FBXO15 in MDA-MB231 and MCF7 cells, respectively. n Immunoprecipitation assay was performed, and the cell lysate was immunoprecipitated with an FBXO15 antibody or an immunoglobulin G (lgG) control to detect the endogenous protein interaction between FBXO15 and STAT3 in MCF7 cells. The cells were treated with MG132 (10 μM) for 6 h before harvest. o Representative confocal images and graph of cells with PLA-positive signal using MCF7 cells fixed with anti-STAT3 (M) and anti-FBXO15 (Rb). The graph showed the number of dots per cell which was counted using ImageJ software. Scale bar = 100 μm. p Co-immunoprecipitation assay indicating the interaction of FBXO15 and STAT3 using MG132 (10 μM) treated HEK293T cells. Cell lysates were immunoprecipitated to pull down STAT3 and Myc/Flag-tagged protein. q Rescue experiments were performed using western blotting analysis to assess EGFR and/or p-EGFR expression using FBXO15-overexpressing MDA-MB231 cells with or without SOX2 expression. r, s QRT-PCR and western blotting analysis of FBXO15 expression after silencing EGFR expression in MDA-MB231 cells using EGFR inhibitor, AG1478 (10 μM), or siRNA. t Graphic scheme of the miR-92a-3p binding to the 3’UTR region of FBXO15 (upper), and relative luciferase activity after wild-type (WT) FBXO15-3’UTR and mutant FBXO15-3’UTR co-transfection with miR-92a-3p in HEK293T cells (below). u Representative IHC staining images of FBXO15, SOX2, EGFR, and STAT3 expression in human breast cancer tissues. The tables showed the association between FBXO15 and SOX2, EGFR, STAT3 expression in breast cancer tissues. The association between FBXO15 and among SOX2, EGFR, and STAT3 expression in breast cancer tissues. The number of cases and the percentage of positive staining in the corresponding groups as well as the statistical significance based on Student’s t tests and Pearson’s correlations of expression are shown in the table. Scale bar = 100 μm. v Multivariate Cox regression analysis to regulate the significance of association between FBXO15 and disease-free survival (DFS) in the presence of other clinical variables. w Scheme of the EGFR/STAT3/miR-92a-3p/FBXO15/SOX2 axis mechanism in breast cancer. Scale bar = 100 μm, β-actin was used as a control for normalization of expression. *p < 0.05; **p < 0.001; ***p < 0.0001; ns not significant, determined by two-tailed Student’s t test (95% confidence interval).
References
Publication types
MeSH terms
Substances
LinkOut - more resources
Full Text Sources
Medical
Molecular Biology Databases
