. 2021 Jun 3;12(1):3308.
doi: 10.1038/s41467-021-23221-w.

Nuclear compartmentalization of TERT mRNA and TUG1 lncRNA is driven by intron retention

Affiliations

Nuclear compartmentalization of TERT mRNA and TUG1 lncRNA is driven by intron retention

Gabrijela Dumbović et al. Nat Commun. .

Erratum in

Abstract

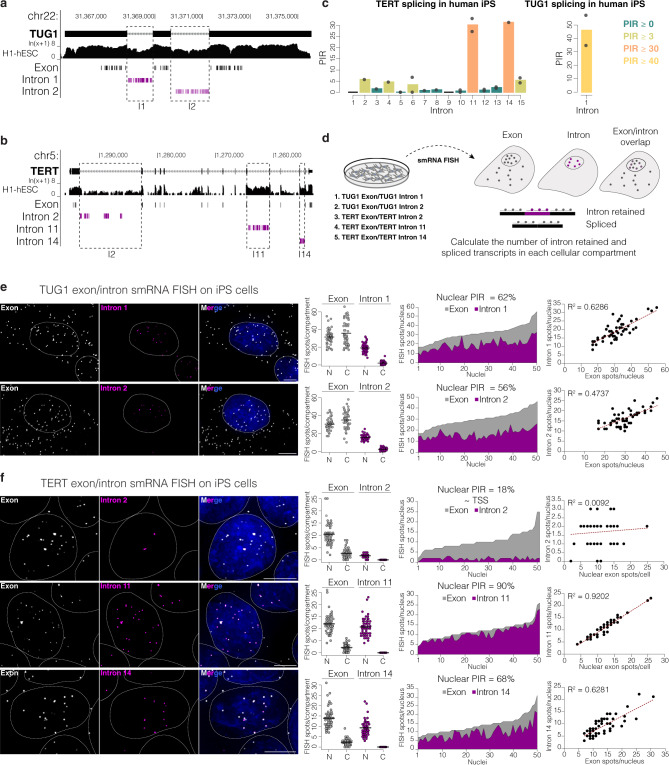
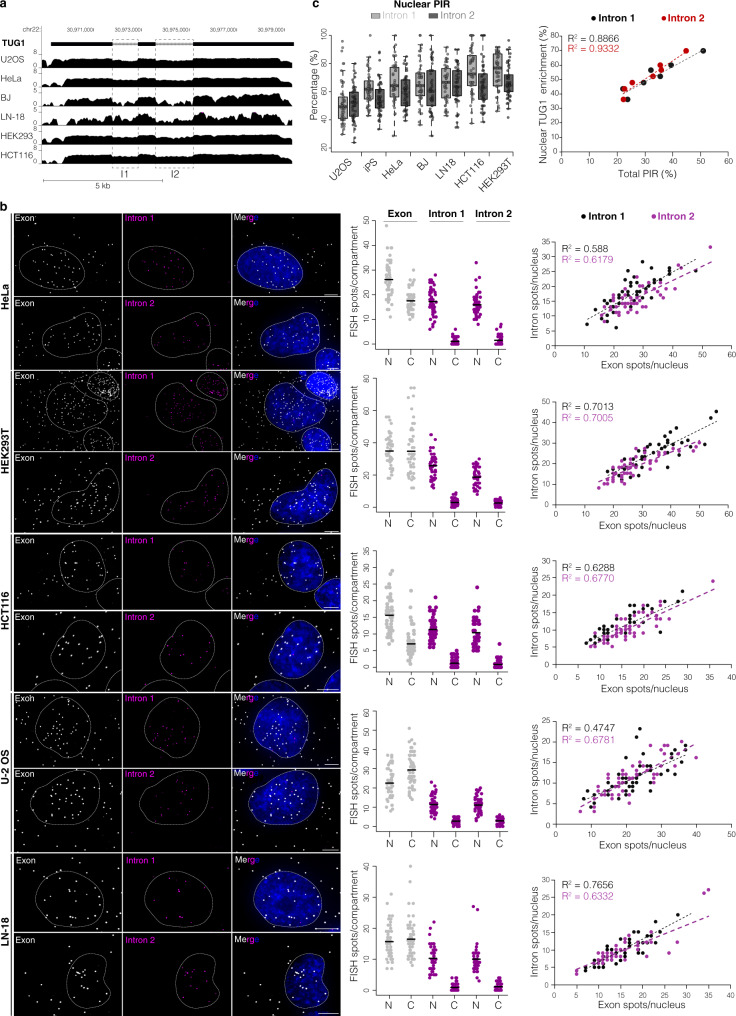
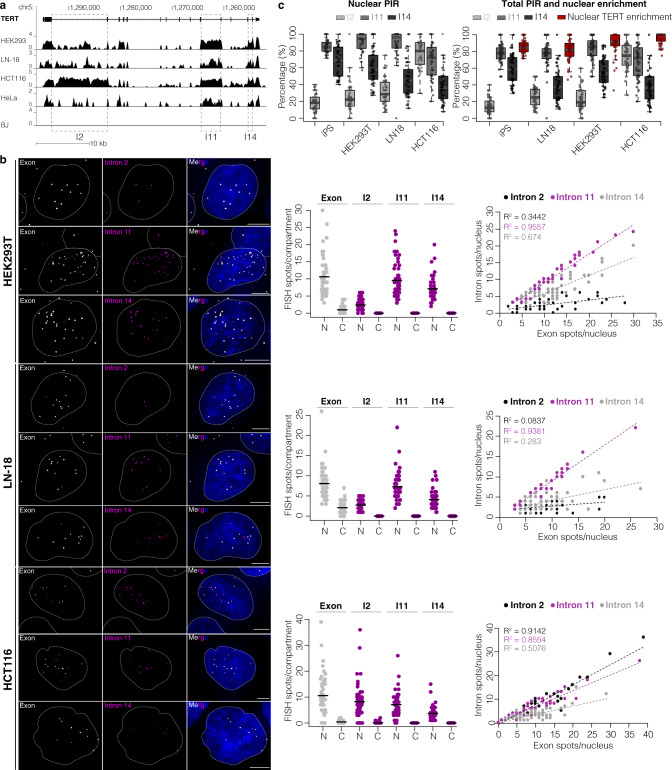
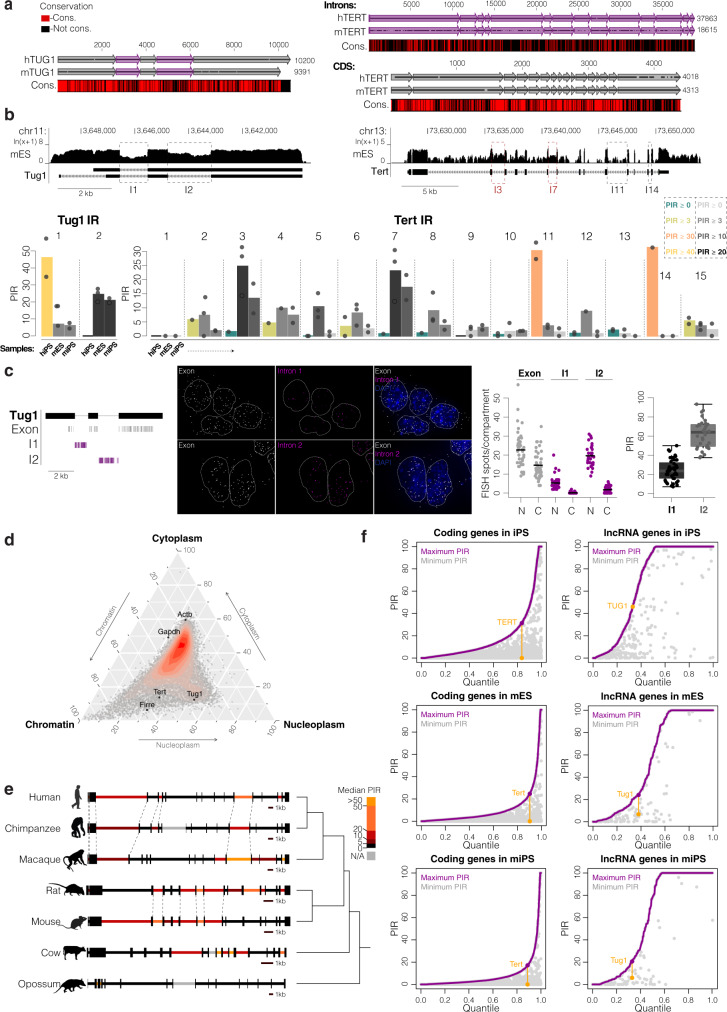
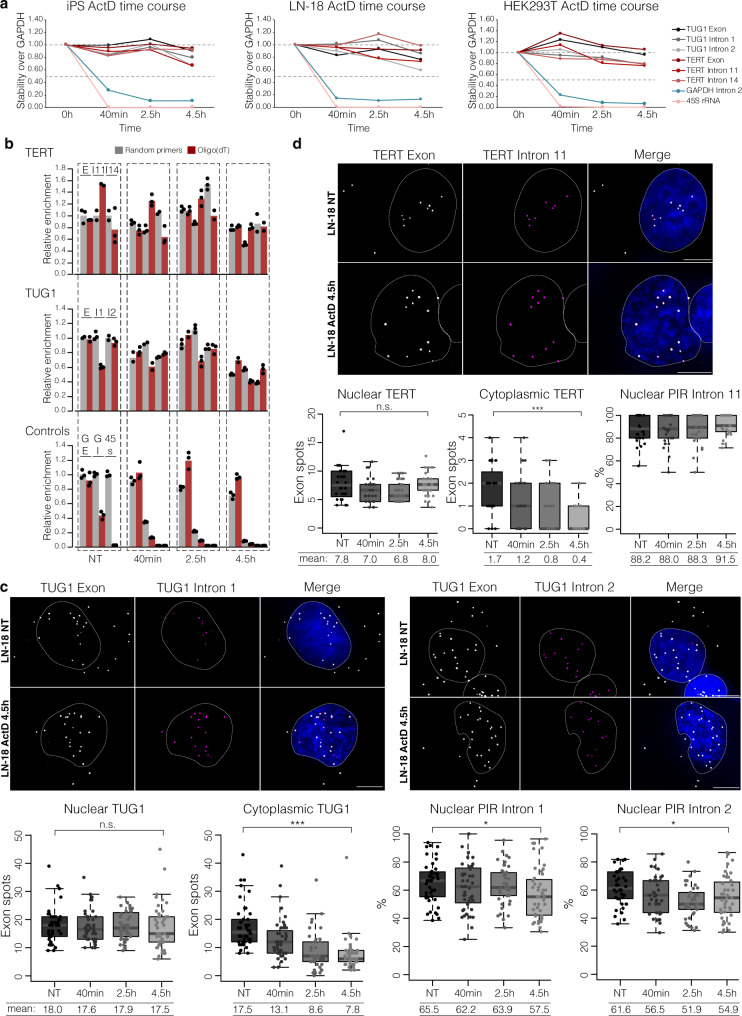
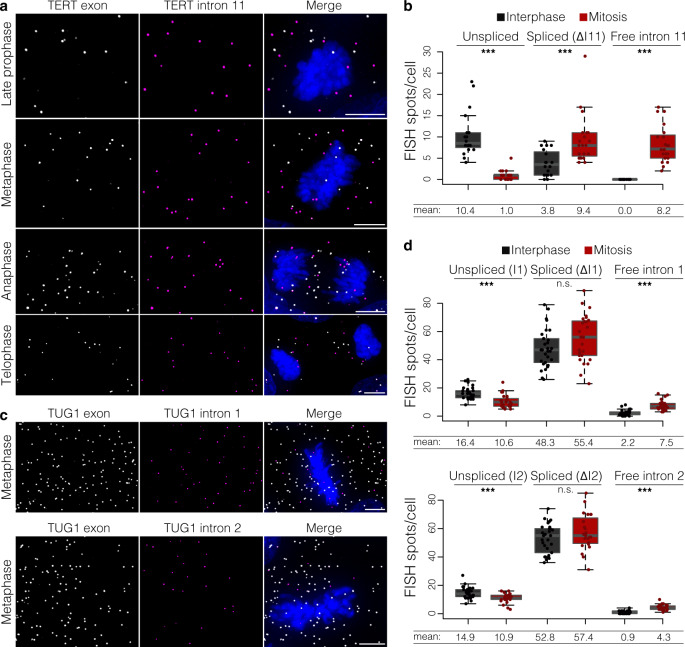
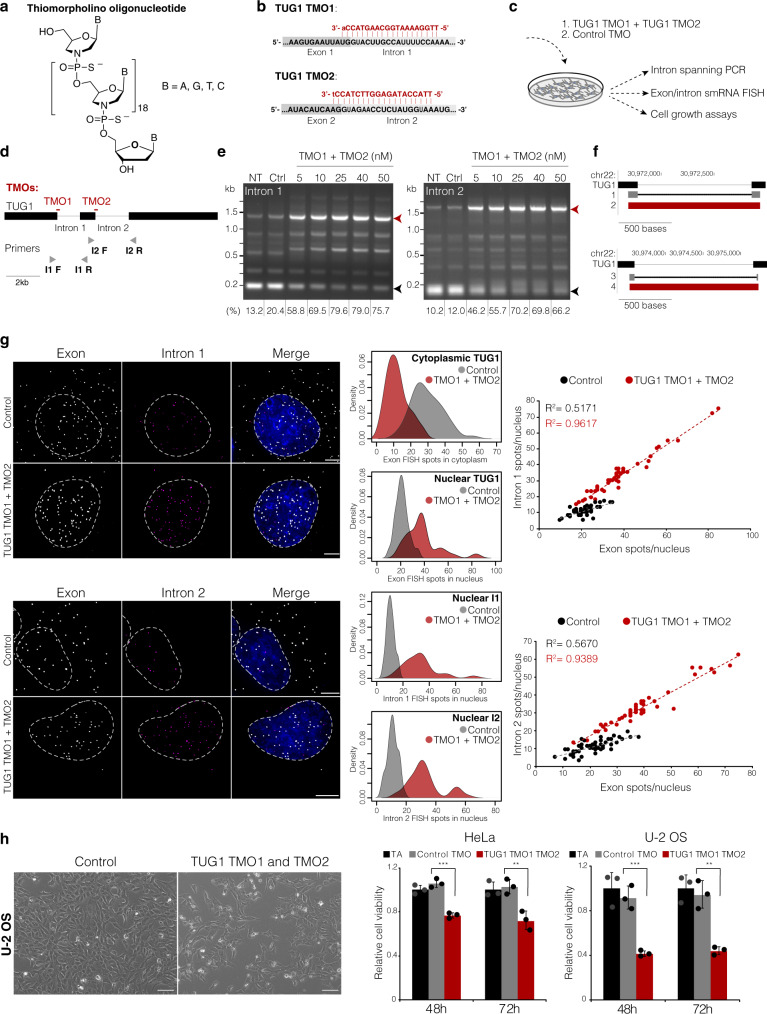
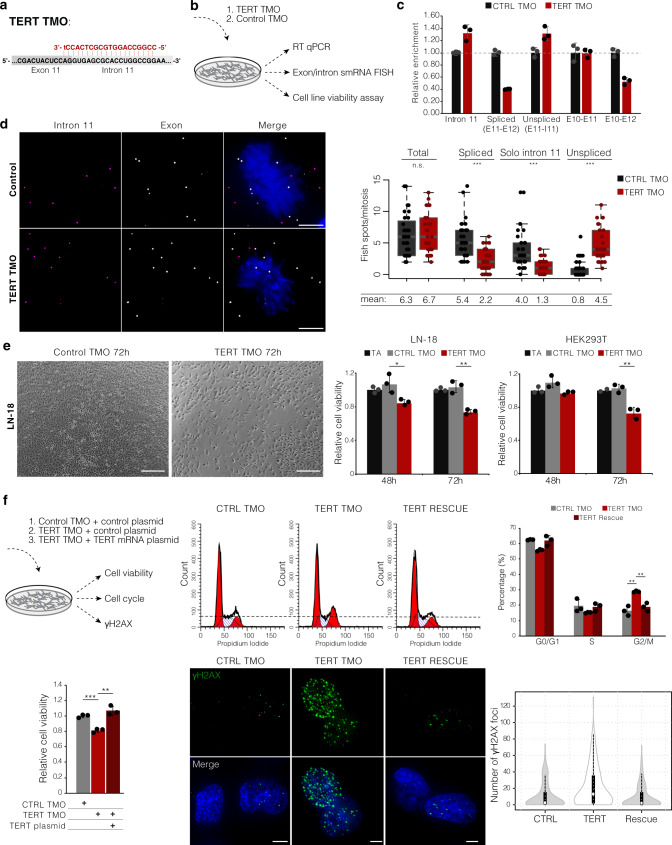
The spatial partitioning of the transcriptome in the cell is an important form of gene-expression regulation. Here, we address how intron retention influences the spatio-temporal dynamics of transcripts from two clinically relevant genes: TERT (Telomerase Reverse Transcriptase) pre-mRNA and TUG1 (Taurine-Upregulated Gene 1) lncRNA. Single molecule RNA FISH reveals that nuclear TERT transcripts uniformly and robustly retain specific introns. Our data suggest that the splicing of TERT retained introns occurs during mitosis. In contrast, TUG1 has a bimodal distribution of fully spliced cytoplasmic and intron-retained nuclear transcripts. We further test the functionality of intron-retention events using RNA-targeting thiomorpholino antisense oligonucleotides to block intron excision. We show that intron retention is the driving force for the nuclear compartmentalization of these RNAs. For both RNAs, altering this splicing-driven subcellular distribution has significant effects on cell viability. Together, these findings show that stable retention of specific introns can orchestrate spatial compartmentalization of these RNAs within the cell. This process reveals that modulating RNA localization via targeted intron retention can be utilized for RNA-based therapies.


Conflict of interest statement

The authors declare no competing interests. T.R.C. is on the Merck board and is a consultant for Storm Therapeutics and Eikon Therapeutics.

Figures

Fig. 1
Fig. 1. Retention of specific introns correlates with nuclear localization of TERT mRNA and TUG1 lncRNA in hES/iPS cells.
a UCSC Genome Browser showing the TUG1 locus (hg19) and the poly(A)+ RNA-seq track from human ES cells from ENCODE. Below, the location of probes used in smRNA FISH. Exon probes, gray; intron probes, magenta. b UCSC Genome Browser showing the TERT locus (hg19) and the poly(A)+ RNA-seq track from human ES cells from ENCODE. Below, the location of probes used in smRNA FISH. Exon probes, gray; intron probes, magenta. c Percentage of intron retention of TERT (left) and TUG1 (right) in human iPS cells obtained with vast-tools analysis of RNA-seq data, n = 2 poly(A)+ RNA-seq and 1 ribo-depleted RNA-seq. Bars, means across replicates; dots, individual replicates. Introns with insufficient read coverage are shown as black lines in TERT plot. TUG1 intron 2 was absent in the VastDB database. d SmRNA FISH scheme. Co-localizing exon and intron signals are considered as unspliced, exon-only signal as spliced. e Maximum intensity projections of representative images of TUG1 exon/intron smRNA FISH on iPS cells. Exon, gray; intron 1 and 2, magenta. Nucleus, blue, outlined with a dashed circle. Scale bar, 5 μm. Towards the right: quantification of total and unspliced transcripts for each intron in the nucleus (N) and cytoplasm (C), solid line represents the mean; quantity of spliced (exon only, gray) and intron-retained (magenta) transcripts across 50 nuclei, ordered from fewest to most exon count in the nucleus (average PIR shown on top); correlation between nuclear intron and nuclear TUG1 quantity. N = 50 cells, at least two independent RNA FISH stainings. f Maximum intensity projections of representative images of TERT exon/intron smRNA FISH on iPS cells. Exon, gray; introns 2, 11, and 14, magenta. Nucleus, blue, outlined with a dashed circle. Scale bar, 5 μm. Towards the right: quantification of total and unspliced transcripts for each intron, solid line represents the mean; quantity of spliced (exon only, gray) and intron-retained (magenta) transcripts across nuclei, ordered from fewest to most exon count in the nucleus (average PIR is shown on top); correlation between nuclear intron and nuclear TERT quantity. N = 50 cells (intron 14), 51 cells (intron 2 and 11), at least two independent RNA FISH stainings.
Fig. 2
Fig. 2. TUG1 intron retention is common and fluctuates across cell lines.
a UCSC Genome Browser showing poly(A)+ RNA-seq coverage across TUG1 locus (hg38) from multiple cell lines. Scale ln(x + 1). b Maximum intensity projections of representative images of TUG1 exon/intron smRNA FISH across indicated cell lines. Exon, gray; introns 1, 2, magenta; nucleus, blue, outlined with a dashed line. Scale bar, 5 μm. Middle: quantification of total and unspliced transcripts for each intron in the nucleus (N) and cytoplasm (C), solid line represents the mean. Right: correlation between nuclear intron and nuclear TUG1 quantity, intron 1, black; intron 2, magenta. N = 50 cells, at least two independent RNA FISH stainings. c Left: nuclear PIR for each intron across cell lines. Midline line, median; lower and upper box limits, 25th and 75th percentiles; whiskers, 1.5 times the interquartile range from the 25th and 75th percentiles. Right: correlation between TUG1 nuclear enrichment and total PIR between different cell lines. Each data point, mean value from one cell line, all measurements shown in Supplementary Fig. 2b. Intron 1, black; intron 2 red. N = 50 cells, at least two independent RNA FISH stainings.
Fig. 3
Fig. 3. Retention of TERT intron 11 is robust across cell lines.
a UCSC Genome Browser showing RNA-seq coverage across TERT locus (hg38) from multiple cell lines. Scale ln(x + 1). b Maximum intensity projections of representative images of TERT exon/intron smRNA FISH across different cell lines. Exon, gray; introns 2, 11, 14, magenta; nucleus, blue, outlined with a dashed line. Scale bar, 5 μm. Middle: quantification of total and unspliced transcripts for each intron in the nucleus (N) and cytoplasm (C), solid line represents the mean. Right: correlation between nuclear intron and nuclear TERT count; intron 2, black; intron 11, magenta; intron 14, gray. N = 50 cells, at least two independent RNA FISH stainings. c Left: nuclear PIR for each intron across cell lines. Midline line, median; lower and upper box limits, 25th and 75th percentiles; whiskers, 1.5 times interquartile range from the 25th and 75th percentiles. Right: total PIR of each intron and percentage of nuclear enrichment of TERT across cell lines. N = 50 cells, at least two independent RNA FISH stainings.
Fig. 4
Fig. 4. Evolutionary conservation of TERT and TUG1 intron retention.
a Alignment of human and mouse TUG1 locus (left) and TERT locus (right). Exons depicted with gray arrows, introns with magenta arrows. Below the alignment is shown a conservation map of conserved (red) and non-conserved (black) nucleotides. b UCSC Genome Browser showing poly(A)+ RNA-seq coverage from mouse embryonic stem cells (mES) across the Tug1 locus and Tert locus. Below, percentage intron retention (PIR) of Tert (right) and Tug1 (left) in mouse iPS (miPS) and mES cells obtained with vast-tools analysis on poly(A)+ RNA-seq. Values from human iPS (hiPS) cells are plotted for comparative purposes. Bars indicate means across replicates and dots individual replicates, n = 2 (miPS), 3 (mES). c Maximum intensity projections of representative images of Tug1 exon/intron smRNA FISH on mES cells. Exon in gray, introns 1 and 2 in magenta. Nucleus in blue, outlined with a dashed line. Scale bar, 5 μm. Middle: quantification of total and unspliced transcripts for each intron in the nucleus (N) and cytoplasm (C), solid line represents the mean. On the right: percentage of nuclear intron retention (PIR) for intron 1 and intron 2. Midline line, median; lower and upper box limits, 25th and 75th percentiles; whiskers, 1.5 times interquartile range from the 25th and 75th percentiles, n = 44 cells (intron 1), 30 cells (intron 2). d Relative subcellular localization of Tert and Tug1 in poly(A)+ RNA-seq from chromatin, cytoplasm and nucleoplasm of mES cells. Cytoplasm-enriched Gapdh and Actb and chromatin-enriched Firre are plotted for comparison. e Intron retention of TERT in seven mammalian species. Exon–intron structure is shown and scale bars indicate relative size for each species. Median intron retention across 38 (chimpanzee)—151 (mouse) cell and tissue types is represented by a color scale. Note high retention of introns 2 and 3 in opossum. Dashed lines indicate boundaries of orthologous introns that are retained in both species. Evolutionary relationships are represented by the cladogram on the right. Silhouettes from http://phylopic.org. f Cumulative distribution of maximum PIR levels for each coding and lncRNA gene in hiPS, mES and miPS cells (in purple). Minimum PIR value for the same gene is plotted in gray at the same x-axis position. Introns with maximum and minimum PIR values from TERT and TUG1 are connected with a yellow line.
Fig. 5
Fig. 5. Intron-retained nuclear TUG1 and TERT are long-lived transcripts, stably retained in the nucleus.
a Relative stability of TUG1 and TERT exons and introns compared to GAPDH mRNA measured by RT-qPCR of random-primed cDNA from iPS, HEK293T and LN-18 cells during a 4.5 h ActD time course. GAPDH intron 2, a control for an efficiently spliced intron; 45S rRNA, a control for a precursor RNA. Each dot represents mean value from two or three replicates. b Relative abundance and stability of spliced and intron-retained transcripts in cDNA synthesized with random primers or oligo(dT) during the 4.5 h ActD treatment of iPS cells; bars, means across replicates; dots, individual replicates, n = two or three measurements. c Maximum intensity projection of LN-18 smRNA FISH targeting TUG1 exon (gray) and intron 1 (magenta) or intron 2 (magenta) at time point 0 (NT) and 4.5 h after ActD treatment. Scale bar, 5 μm. Below, smRNA FISH quantification at each time point of spliced and unspliced TUG1 transcripts in the nucleus and cytoplasm; PIR of intron 1 and intron 2 at each time point. n.s. = not significant, *P ≤ 0.05, ***P ≤ 0.001, evaluated by unpaired two-tailed t-test (equal variances) versus NT; n (nuclear TUG1, cytoplasmic TUG1, nuclear PIR intron 1) = 44 cells (NT, 40 min, 4.5 h), 43 cells (2.5 h); n (nuclear PIR intron 2) = 38 cells (NT), 39 cells (40 min, 4.5 h), 40 cells (2.5 h), two independent RNA FISH stainings. d Maximum intensity projection of LN-18 smRNA FISH targeting TERT exon (gray) and intron 11 (magenta) at time point 0 (NT) and 4.5 h after ActD treatment. Scale bar, 5 μm. Below, smRNA FISH quantification at each time point of spliced and unspliced TERT transcripts in the nucleus and cytoplasm; nuclear PIR of intron 11 at each time point. n.s. = not significant, ***P ≤ 0.001, evaluated by unpaired two-tailed t-test (equal variances) versus NT, n (nuclear, cytoplasmic TERT, nuclear PIR intron 11) = 32 cells (NT), 30 cells (40 min, 2.5 h, 4.5 h), two independent RNA FISH stainings. In c, d midline line, median; lower and upper box limits, 25th and 75th percentiles; whiskers, 1.5 times interquartile range from the 25th and 75th percentiles.
Fig. 6
Fig. 6. Splicing of TERT intron 11 occurs upon mitosis.
a Maximum intensity projections of TERT exon (gray) and intron 11 (magenta) smRNA FISH. Representative images of late prophase, metaphase, anaphase, and telophase are shown. DAPI shown in blue. Scale bar, 5 μm. Three independent experiments. b Quantification of unspliced TERT, spliced (ΔI11) TERT, and free intron 11 in interphase cells and during mitosis. ***P ≤ 0.001, evaluated by unpaired two-tailed t-test (equal variances) versus interphase; n = 20 cells from three independent RNA FISH stainings. c Maximum intensity projections of TUG1 exon (gray) and intron 1 (magenta) or intron 2 (magenta) smRNA FISH. Representative images of metaphases are shown. DAPI shown in blue. Scale bar, 5 μm. Two independent experiments. d, Quantification of unspliced TUG1, spliced (ΔI1 or ΔI2) TUG1, and free intron 1 or 2 in interphase cells and during mitosis. n.s. = not significant, ***P ≤ 0.001, as evaluated by unpaired two-tailed t-test (equal variances) versus interphase; for intron 1 n (interphase) = 30 cells, n (mitosis) = 27 cells; for intron 2 n (interphase) = 29 cells, n (mitosis) = 23 cells; two independent RNA FISH stainings. In b, d midline line, median; lower and upper box limits, 25th and 75th percentiles; whiskers, 1.5 times interquartile range from the 25th and 75th percentiles.
Fig. 7
Fig. 7. Intron retention drives nuclear compartmentalization of TUG1.
a The chemical structure of thiomorpholino oligonucleotide (TMO). b The design of TUG1 TMO1 and TMO2 (in red) against the donor splice sites. For TMOs, upper-case red letters refer to thiomorpholino nucleotides and lower-case letters to 2′-deoxynucleosides at the 3′ end of each TMO. c Experimental setup to assess the efficiency of TMO-based intron inclusion and its effect of subcellular localization of TUG1 and cell viability. d TMO location scheme in respect to TUG1 transcript and the location on intron-spanning primers (not to scale). e PCR product of the intron-spanning RT-PCR of untreated (NT), control TMO (Ctrl), and increasing doses of a mixture of TUG1 TMO1 and TMO2. Black arrow, spliced product; red arrow, unspliced product. Below, the percentage of the unspliced products. Kb, kilobases. PCR products after transfecting TUG1 TMOs were examined on agarose gel at least three independent times. Uncropped blot is provided in Source data. f UCSC browser displaying Sanger sequencing results of spliced (band 1) and unspliced (band 2) products for intron 1 RT-PCR (on top). Below, the sequences for spliced (band 3) and unspliced (band 4) products for intron 2 RT-PCR. g Maximum intensity projections of TUG1 exon and intron 1 or intron 2 smRNA FISH in U-2 OS cells transfected with control TMO and with TUG1 TMO1 and TMO2. Exon, gray; intron, magenta; nucleus, blue; scale bar, 5 μm. Towards the right, quantification of nuclear TUG1, cytoplasmic TUG1, intron 1 or 2 retentions in TUG1 TMO1 and TMO2 (red) versus control TMO (gray) samples, n = 50 cells (control), 49 cells (intron 1 TMO1 and 2), 44 cells (intron 2 TMO1 and 2). h, Relative cell viability of HeLa and U-2 OS cells transfected with TUG1 TMO1 and TMO2, control TMO or transfection agent only (TA). Representative images of U-2 OS transfected with control TMO or TUG1 TMO1 and TMO2 shown on the left. Scale bar, 100 μm. **P ≤ 0.01, ***P ≤ 0.001, as evaluated by unpaired two-tailed t-test (equal variances) versus control TMO. Bars, means across replicates; dots, individual replicates, error bars, the standard deviation of the mean of three independent measurements.
Fig. 8
Fig. 8. TMO-based prevention of TERT splicing reduces cell viability in vitro.
a Scheme showing the design of TERT TMO (in red) against the exon11/intron11 donor splice site. The upper-case red letters refer to thiomorpholino nucleotides and the lower-case letter to a 2′-deoxynucleoside at the 3′ end. b Experimental setup to assess the efficiency of TMO-based TERT intron 11 inclusion (RT-qPCR and smRNA FISH) and its effect on cell viability. c Relative expression of TERT intron 11, spliced TERT (Exon10-Exon11, Exon10-Exon12, Exon11-Exon12), and unspliced TERT (Exon11-Intron11) over GAPDH assessed by RT-qPCR. Error bars represent the standard deviation of the mean of three replicates. d Maximum intensity projections of TERT exon (gray) and intron 11 (magenta) smRNA FISH in LN-18 cells transfected with control TMO and TERT TMO. DAPI, blue. Scale bar, 5 μm. On the right, quantification of total TERT (exon signal), unspliced TERT, spliced TERT (ΔI11), and free intron 11 during mitosis of LN-18 cells transfected with control TMO (CTRL) or TERT TMO. N (control TMO) = 32 cells, n (TERT TMO) = 30 cells, two independent RNA FISH stainings. Midline line, median; lower and upper box limits, 25th and 75th percentiles; whiskers, 1.5 times interquartile range from the 25th and 75th percentiles. e Cell viability of LN-18 and HEK293T cells transfected with TERT TMO, control TMO or transfection agent only (TA). Representative images of LN-18 transfected with control TMO or TERT TMO shown on the left. Scale bar, 250 μm. Bars, means across replicates; dots, individual replicates, error bars, standard deviation of the mean of three independent measurements. f Cell viability, cell cycle, and γH2A.X foci analysis of LN-18 cell line 72 h after co-transfection of TERT TMO with spliced TERT expression plasmid, control TMO, and TERT TMO with a control plasmid. Cell viability and cell cycle; bars, means across replicates; dots, individual replicates; error bars, standard deviation of the mean of three independent measurements. Representative images of γH2A.X immunofluorescence are shown, DAPI, blue; γH2A.X, green; scale bar 5 μm. Violin plot, n (control TMO) = 128 cells, n (TERT TMO) = 168 cells, n (rescue) = 153 cells, two independent stainings. White circles, median; box limits indicate the 25th and 75th percentiles; whiskers, 1.5 times the interquartile range from the 25th and 75th percentiles; polygons represent density estimates of data and extend to extreme values. For d, e, and f p values were obtained by unpaired two-tailed t-test (equal variances), n.s. = not significant, *P ≤ 0.05, **P ≤ 0.01, ***P ≤ 0.001.

References

    1. Lécuyer E, et al. Global analysis of mRNA localization reveals a prominent role in organizing cellular architecture and function. Cell. 2007;131:174–187. - PubMed
    1. Martin KC, Ephrussi A. mRNA localization: gene expression in the spatial dimension. Cell. 2009;136:719–730. - PMC - PubMed
    1. Buxbaum AR, Haimovich G, Singer RH. In the right place at the right time: visualizing and understanding mRNA localization. Nat. Rev. Mol. Cell Biol. 2014;131:174–187. - PMC - PubMed
    1. Mauger O, Lemoine F, Scheiffele P. Targeted intron retention and excision for rapid gene regulation in response to neuronal activity. Neuron. 2016;92:1266–1278. - PubMed
    1. Chin A, Eric L. RNA localization: making its way to the center stage. Biochim. Biophys. Acta Gen. Subj. 2017;1861:2956–2970. - PubMed

Publication types

MeSH terms