. 2021 Jun 3;12(1):3299.
doi: 10.1038/s41467-021-23396-2.

STAT1 potentiates oxidative stress revealing a targetable vulnerability that increases phenformin efficacy in breast cancer

Affiliations

STAT1 potentiates oxidative stress revealing a targetable vulnerability that increases phenformin efficacy in breast cancer

Stephanie P Totten et al. Nat Commun. .

Abstract

Bioenergetic perturbations driving neoplastic growth increase the production of reactive oxygen species (ROS), requiring a compensatory increase in ROS scavengers to limit oxidative stress. Intervention strategies that simultaneously induce energetic and oxidative stress therefore have therapeutic potential. Phenformin is a mitochondrial complex I inhibitor that induces bioenergetic stress. We now demonstrate that inflammatory mediators, including IFNγ and polyIC, potentiate the cytotoxicity of phenformin by inducing a parallel increase in oxidative stress through STAT1-dependent mechanisms. Indeed, STAT1 signaling downregulates NQO1, a key ROS scavenger, in many breast cancer models. Moreover, genetic ablation or pharmacological inhibition of NQO1 using β-lapachone (an NQO1 bioactivatable drug) increases oxidative stress to selectively sensitize breast cancer models, including patient derived xenografts of HER2+ and triple negative disease, to the tumoricidal effects of phenformin. We provide evidence that therapies targeting ROS scavengers increase the anti-neoplastic efficacy of mitochondrial complex I inhibitors in breast cancer.


Conflict of interest statement

The authors declare no competing interests.

Figures
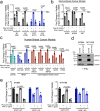
Fig. 1
Fig. 1. IFNγ-driven STAT1 activation sensitizes breast cancer cells to phenformin.
ac Viability of breast cancer cell lines after treatment with phenformin and IFNγ alone or in combination for 48 h. Data are shown as a fold change in viability compared to PBS controls (a, b) murine a MT864, MT4788: n = 5; 313F 6737 and 6738: n = 4 independent experiments; b NOP6, NOP23, NIC: n = 3 independent experiments. c Human breast cancer cell lines, MCF7 and BT474: n = 4, the others are n = 3 independent experiments. Data are presented as mean of means ± SEM. d Immunoblot analysis of IFNγ-treated STAT1-WT and STAT1-KO cells, representative of n = 3 independent experiments. e Viability of MT864 and MT4788-STAT1-WT and STAT1-KO cells treated with PBS, phenformin, or IFNγ, alone or in combination, for 48 h. Data are represented as a fold change in cell viability compared to PBS controls. The graphed data represent one experiment with four technical replicates (mean ± SD) and is representative of two independent experiments. P values were calculated using two-way ANOVA with a Tukey’s post hoc test (a, b, c, e), and can be found in the figure. See also Supplementary Figure 1.
Fig. 2
Fig. 2. PolyIC-induced STAT1 activation sensitizes breast tumors to the tumoricidal effects of phenformin in vivo.
a, b Mammary fat pad injection (MFP) of MT4788 cells into immunocompetent (FVB) mice or a IFNγ−/− or b CD8−/− animals. At ~150 mm3, mice were treated with PBS or phenformin (50 mg/kg daily). a Control: n = 7; phenformin: n = 8 tumors/group. b Control CD8+/+: n = 5; phenformin CD8+/+: n = 8; control CD8−/−: n = 12; phenformin CD8−/−: n = 11 tumors. c MFP injection of MT4788 cells into FVB mice. At ~100 mm3, mice were treated with polyIC (50 μg, daily) or saline. Two days later, when tumors were ~150 mm3, phenformin (50 mg/kg, daily) (or PBS) treatment was started, in combination with polyIC or saline (every 2 days). Control: n = 18; phenformin: n = 20; polyIC: n = 17; phenformin + polyIC: n = 17 tumors. d, e MFP injection of d MT4788-STAT1-WT or e STAT1-KO cells into FVB mice. At ~80 mm3 tumor volume, mice were treated with polyIC or saline. Two days later, when tumors were ~120  mm3, phenformin (50 mg/kg, daily) (or PBS) treatment was started, in combination with polyIC or saline (every 2 days). Control: d n = 11 and e n = 10; phenformin (d, e): n = 7; polyIC: d n = 6 and e n = 7; phenformin and polyIC: d n = 8 and e n = 9 tumors. f, g Immunohistochemical staining of tumors described in (c) using f Ki67 and g cleaved caspase-3-specific antibodies. The data are shown as mean % positive cells ± SEM and is representative of f control: n = 7; polyIC: n = 8; phenformin: n = 8; phenformin + polyIC: n = 10 (g) n = 10 except polyIC: n = 8 tumors. Representative images are shown (scale bar = 50 μm). h, i MFP injection of h 4T1-537 cells into Balb/c mice and i MDA-MB-231 cells into SCID-Beige mice. At ~150 mm3, mice were treated as described in (c). h Control: n = 8; phenformin, polyIC: n = 9; phenformin + polyIC: n = 10 tumors; i control: n = 12; phenformin: n = 10; polyIC: n = 9; phenformin + polyIC: n = 13 tumors/group. j MFP injection of MT4788 breast cancer cells into FVB mice. Mice were treated as described in (c) using two concentrations of phenformin (10 or 50 mg/kg). n = 8 tumors/group except phenformin (10 mg/kg) + polyIC: n = 9. For ae and hj, data are represented as the mean fold change in tumor volume relative to the start of treatment ± SEM. P values are in the Figure and were calculated using a two-way ANOVA with a Tukey’s post hoc test or one-way ANOVA using Tukey’s post hoc test (f, g). See also Supplementary Figure 2.
Fig. 3
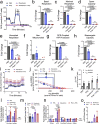
Fig. 3. IFNγ induces moderate energetic stress in breast cancer cells.
a Oxygen consumption rate (OCR), n = 3 independent experiments (mean of means) ± SEM. bf Fold change in the rates of b basal respiration, c maximal respiration, d spare capacity, e uncoupled respiration, and f non-mitochondrial respiration from the samples analyzed in (a). n = 3 independent experiments, (mean of means) ± SEM. g, h Fold change in g OCR-coupled ATP production and h the bioenergetic capacity of cells described in (a). The data are presented as a mean of means ± SEM, of n = 3 independent experiments. i Extracellular acidification rate (ECAR) from cells described in (a). The data are representative of n = 3 independent experiments (mean of means) ± SEM. j The metabolic capacity and flexibility of cells were represented by plotting the basal (point on the dotted line) and maximal rates (point on solid line) of ATP production from glycolysis (JATP glycolytic) and oxidative phosphorylation (JATP oxidation), upon treatment. n = 3 independent experiments, (mean of means) ± SEM. k Total basal ATP production from either glycolysis or oxidation, upon treatment. n = 3 independent experiments, presented as mean of means ± SEM. l Fold change in steady-state levels of glycolytic metabolites. The data are representative of n = 3 independent experiments (mean of means) ± SEM. m The lactate/pyruvate ratio was determined from the samples analyzed in (l), of n = 3 independent experiments (mean of means) ± SD. n Fold change in steady-state levels of citric acid cycle metabolites, of the same samples as (l,) n = 3 independent experiments (mean of means) ± SEM. ****P < 0.0001 compared to PBS control. Other P values indicated in the figure. o α-Ketoglutarate/citrate ratio was determined from (n), of n = 3 independent experiments (mean of means) ± SD. For each panel, MT4788 cells were treated with 1 ng/mL IFNγ, phenformin 500 μM, combination, or PBS treatment as the vehicle control. P values were calculated using a two-way ANOVA with a Tukey’s post hoc test and are indicated in the figure or above. See also Supplementary Figure 3. n.s. not significant.
Fig. 4
Fig. 4. IFNγ and polyIC-induced phenformin sensitivity requires mitochondrial ROS.
a, b MitoSOX geometric mean fluorescence intensity (MFI) and representative histograms of a MT4788 and b MDA-MB-231 cells treated with IFNγ and phenformin, alone or in combination, for 24 h. The data are shown as the fold change in MFI compared to PBS controls ± SEM: a MT4788: n = 6/group; b MDA-MB-231: n = 4/group. See Supplementary Figure 10 for gating strategy. ce Fold change in cell viability compared to DMSO control of c MT4788, d MDA-MB-231, and e BT474 cells treated for 48 h with IFNγ and/or phenformin, either in the absence or presence of 10 μM MitoTEMPO. Data are presented as the mean of means ± SEM, of n = 3 (d) or n = 4 (c, e) independent experiments. f Mammary fat pad injection of MT4788 breast cancer cells into FVB mice. At ~100 mm3, mice were treated with vehicle control or polyIC (50 μg every 2 days), 2 days later phenformin (50 mg/kg, daily) (or PBS) treatment was initiated with or without 3 mg/kg MitoTEMPO. Data are represented as a mean fold increase in tumor volume relative to the start of combination treatment ±  SEM. Control group: n = 8; MitoTempo: n = 6; phenformin + polyIC: n = 8; phenformin + polyIC + MitoTempo: n = 8 tumors. g 8-oxo-dG immunohistochemical staining of paraffin-embedded MDA-MB-231 tumors as described in (Fig. 2g). The data are represented as percent positive pixels mean ± SD (n = 10 independent tumors/group). Representative images are also shown. P values were calculated using a two-way ANOVA with a Tukey’s post hoc test and are shown in the figure. See also Supplementary Figure 4.
Fig. 5
Fig. 5. Inhibiting glutathione synthesis sensitizes breast cancer cells to phenformin.
ac MDA-MB-231 cells were treated for 24 h with varying concentrations of a BSO or b phenformin as indicated. c Phenformin/BSO-treated cells were also pretreated with 10 μM MitoTEMPO. The data are shown as fold change in viability compared to PBS control. For (a, b), the data are representative of duplicate experiments (n = 4 technical repeats) mean ± SD. For (c), the data are shown from n = 3 independent experiments, (mean of means) ± SEM. P values indicated in (b) compare the combination of phenformin + BSO to treatment with the respective concentration of phenformin alone. d, e Percentage of d Annexin V+/PI+ or e BrdU-positive MDA-MB-231 cells (±SEM) as determined by flow cytometry. Cells were treated with and PBS control, phenformin, and/or BSO for 40 h. For each panel, the data are representative of three independent experiments. Representative dot plots are shown. See Supplementary Figure 10 for gating strategy. P values are indicated in the figure and were calculated using a two-way ANOVA with a Tukey’s post hoc test. See also Supplementary Figure 5.
Fig. 6
Fig. 6. IFNγ-induced inhibition of NQO1 expression potentiates the antitumorigenic effects of phenformin.
a RNA-seq analysis of MT4788-VC and STAT1-KO cells stimulated with IFNγ for 24 h. Heatmap of differentially expressed genes (>2-fold; FDR < 0.05) associated with ROS metabolism. b Immunoblot analysis of human breast cancer cell lines. Relative NQO1 protein levels compared to pY701-STAT1 or total STAT1 levels were quantified, n = 1 technical repeat. c Immunoblot analysis of cell lines from (b) following 48 h IFNγ treatment. Fold change of the NQO1/tubulin ratio upon IFNγ treatment relative to PBS controls was quantified from n = 3 independent experiments, (mean of means) ± SEM. d Immunoblot analysis of vector control (VC) and NQO1-overexpressing MT4788 cells, representative of n = 3 biological repeats. e Relative viability of cells described in (d) in response to phenformin (500 µM) and IFNγ treatment (48 h). Data are shown as fold change in viability compared to PBS-treated controls and is representative of n = 3 independent experiments (mean of means) ± SEM. ****P value < 0.0001 comparing with PBS control. f RT-qPCR analysis of cell lines transduced with shRNAs targeting human or mouse NQO1 or with a control non-mammalian shRNA. Data are presented as mean of means ±  SEM, of n = 3 biological repeats. g Cells in (f) were tested for their relative sensitivity to IFNγ and/or phenformin (48 h). The data are shown as fold change in cell viability compared to PBS control and is representative of n = 3 independent experiments (MT4788 and MDA-MB-231) (mean of means) ± SEM, or two independent experiments (BT474) (mean of means) ± SD. h RT-qPCR analysis of MDA-MB-231 cells engineered to individually express two shRNAs targeting human NQO1 or a control with non-mammalian targeting shRNA. n = 4 biological repeats; (mean of means) ± SEM. i Cells described in (h) were tested for relative sensitivity to phenformin (48 h), either in the absence or presence of 5 μM MitoTEMPO. Data are shown as fold change in viability compared to PBS controls, n = 3 independent experiments (mean of means) ± SEM. P values were calculated using unpaired two-sided t tests comparing IFNγ and PBS treatment (c, f), a two-way ANOVA with a Tukey’s post hoc test (e, g, h, i) and a one-way ANOVA with a Tukey’s post hoc test (h). See also Supplementary Figures 6 and  7.
Fig. 7
Fig. 7. β-Lapachone, an NQO1-bioactivatable drug, synergistically sensitizes breast tumors to phenformin by inducing oxidative damage.
a Viability of MDA-MB-231 cells treated with phenformin and/or β-lapachone for 48 h. Data are shown as fold change in viability relative to DMSO control and is representative of n = 4 independent experiments (mean of means) ± SEM. b, c Percentage of b Annexin V+/PI+ or c BrdU-positive MDA-MB-231 cells (mean of means ± SEM) as determined by flow cytometry. Cells were treated with PBS control, phenformin, and/or β-lapachone for 48 h. The data are representative of three independent experiments. Representative dot plots are shown. d Mammary fat pad injection of MDA-MB-231 breast cancer cells into SCID-Beige mice. At tumor size ~100 mm3, mice were started on β-lapachone/HPβCD (25 mg/kg, every 2 days) or (HPβCD/PBS). Two days later, phenformin (50 mg/kg, daily) (or PBS) was initiated, in combination with vehicle (HPβCD/PBS) or β-lapachone/HPβCD. Data are represented as fold change in tumor volume relative to the start of combination treatment ± SEM, n = 11 tumors/group; except β-lapachone/HPβCD, n = 12 tumors/group. P values indicated in the figure comparing combination treatment group to: black font: control; purple font: phenformin; green font: β-lapachone groups. e 8-oxo-dG immunohistochemical staining of paraffin-embedded tumors as described in (d). The data are represented as the mean percent positive pixels ± SEM (n = 10 tumors/group). Representative images are also shown. For in vitro studies, 0.5 μM β-lapachone and 500 µM phenformin were used. P values are indicated in the figure and were calculated using a two-way ANOVA with a Tukey’s post hoc test. See also Supplementary Figure 8.
Fig. 8
Fig. 8. Targetable ROS-scavenging mechanisms selectively sensitize human breast cancers to multiple mitochondrial complex I inhibitors.
a DCFDA geometric mean fluorescence intensity (MFI) for immortalized NMuMG and transformed NMuMG-NeuNT cells treated with PBS or phenformin (500 μM) for 24 h. The data are shown as fold change in MFI compared to NMuMG cells and represent the mean of n = 4 independent experiments (±SEM). Representative histograms are shown. b Viability of cells described in (a) in response to phenformin (500 μM) and/or BSO (100 μM) treatment (upper graph) or phenformin (500 μM) and/or β-lapachone (4 μM) treatment (lower graph) for 48 h. The data are shown as fold change in viability compared to vehicle and is representative of n = 4 (upper graph) or n = 3 independent experiments (lower graph), presented as mean of means ± SEM. c Viability of BT474 and MDA-MB-231 cells treated with IACS-010759 (50 nM) and/or β-lapachone (BT474: 1.0 μM and MDAMB231: 0.5 μM) for 48 h. The data are shown as fold change in viability compared to DMSO, n = 4 independent experiments (mean of means) ± SEM (MDA-MB-231); or of n = 8 technical replicates, over two independent experiments ± SD (BT474). d DCFDA geometric MFI for MDA-MB-231 cells treated with IACS-010759 (50 nM) and/or β-lapachone (0.5 μM) for 24 h. The data are shown as fold change in MFI compared to DMSO and are representative of n = 3 independent experiments ± SEM. e, f Viability of HER2+ PDXs (CRC-132, GCRC2080) in vitro after treatment with phenformin (CRC-132, 100 μM; GCRC2080, 500 μM) alone and with (e) BSO (300 μM) or (f) β-lapachone (0.5 μM), for 48 h. The data are shown as fold change in viability compared to vehicle and is representative of n = 3 independent experiments (mean of means) ± SEM. g, h Viability of basal-like PDXs (GCRC1735, GCRC1915, GCRC1963, and GCRC1986) in vitro after treatment with g phenformin (500 μM) and/or BSO (300 μM) or h phenformin (500 μM) and/or β-lapachone (1 μM) for 48 h. The data are shown as fold change in viability compared to vehicle and are representative of n = 3 independent experiments (mean of means) ± SEM. P values were calculated using a two-way ANOVA with a Tukey’s post hoc test. See also Supplementary Figures 9 and 10.
Fig. 9
Fig. 9. Targetable ROS-scavenging mechanisms selectively sensitize human breast cancers to biguanide treatment.
Most breast cancers are characterized by higher levels of oxidative phosphorylation and consequently increased mitochondrial membrane potential, in comparison to normal epithelial cells. Biguanides preferentially accumulate in cells with actively respiring mitochondria. Biguanide treatment as monotherapy inhibits complex I of the electron transport chain and OXPHOS leading to energetic stress. By inhibiting complex I, phenformin also increases mitochondrial superoxide generation. Combination therapy with phenformin and inhibiting tumor antioxidants, such as Nqo1 and glutathione, leads to oxidative stress in addition to energetic stress, and a potent tumoricidal response.

References

    1. Beca F, Polyak K. Intratumor heterogeneity in breast cancer. Adv. Exp. Med. Biol. 2016;882:169–189. - PubMed
    1. Kim J, DeBerardinis RJ. Mechanisms and implications of metabolic heterogeneity in cancer. Cell Metab. 2019;30:434–446. - PMC - PubMed
    1. Andrzejewski S, Gravel SP, Pollak M, St-Pierre J. Metformin directly acts on mitochondria to alter cellular bioenergetics. Cancer Metab. 2014;2:12. - PMC - PubMed
    1. Bridges HR, Jones AJ, Pollak MN, Hirst J. Effects of metformin and other biguanides on oxidative phosphorylation in mitochondria. Biochem. J. 2014;462:475–487. - PMC - PubMed
    1. Wheaton WW, et al. Metformin inhibits mitochondrial complex I of cancer cells to reduce tumorigenesis. Elife. 2014;3:e02242. - PMC - PubMed

Publication types

MeSH terms