. 2021 Jun 3;12(1):3307.
doi: 10.1038/s41467-021-23165-1.

Crowdsourced mapping of unexplored target space of kinase inhibitors

Collaborators, Affiliations

Crowdsourced mapping of unexplored target space of kinase inhibitors

Anna Cichońska et al. Nat Commun. .

Abstract

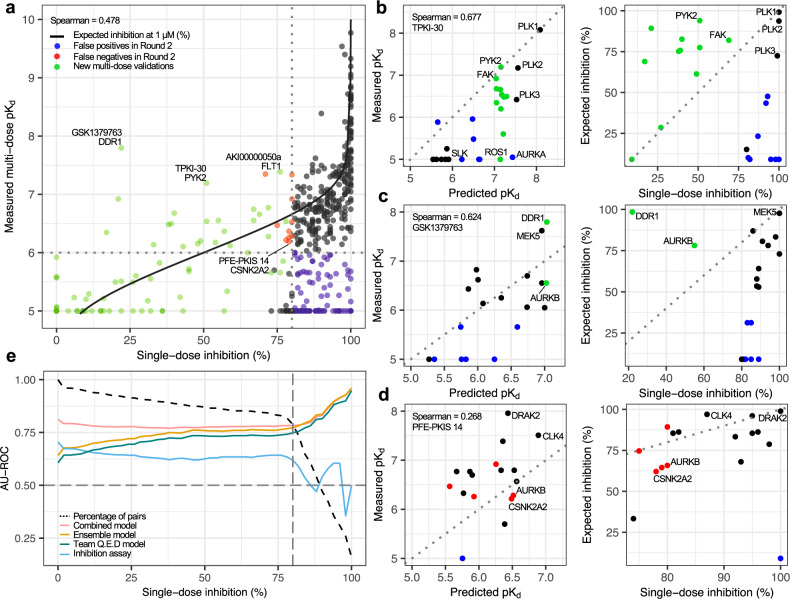
Despite decades of intensive search for compounds that modulate the activity of particular protein targets, a large proportion of the human kinome remains as yet undrugged. Effective approaches are therefore required to map the massive space of unexplored compound-kinase interactions for novel and potent activities. Here, we carry out a crowdsourced benchmarking of predictive algorithms for kinase inhibitor potencies across multiple kinase families tested on unpublished bioactivity data. We find the top-performing predictions are based on various models, including kernel learning, gradient boosting and deep learning, and their ensemble leads to a predictive accuracy exceeding that of single-dose kinase activity assays. We design experiments based on the model predictions and identify unexpected activities even for under-studied kinases, thereby accelerating experimental mapping efforts. The open-source prediction algorithms together with the bioactivities between 95 compounds and 295 kinases provide a resource for benchmarking prediction algorithms and for extending the druggable kinome.


Conflict of interest statement

The SGC is a registered charity that receives funds from AbbVie, Bayer Pharma AG, Boehringer Ingelheim, Canada Foundation for Innovation, Eshelman Institute for Innovation, Genome Canada, Innovative Medicines Initiative (ULTRA-DD 115766), Wellcome Trust, Janssen, Merck Kga, Merck Sharp & Dohme, Novartis Pharma AG, Ontario Ministry of Economic Development and Innovation, Pfizer, São Paulo Research Foundation-FAPESP, and Takeda. T.I.O. has received honoraria or consulted for Abbott, AstraZeneca, Chiron, Genentech, Infinity Pharmaceuticals, Merz Pharmaceuticals, Merck Darmstadt, Mitsubishi Tanabe, Novartis, Ono Pharmaceuticals, Pfizer, Roche, Sanofi and Wyeth. J.Z. is founder and CTO of Silexon AI Technology Co. Ltd. and has an equity interest. The rest of the authors declare no competing interests.

Figures

Fig. 1
Fig. 1. Implementation of the IDG-DREAM Drug-Kinase Binding prediction Challenge.
The participants had access to publicly available large-scale target profiling training data, and the quantitative predictions from regression models were then validated in two unpublished and blinded test datasets profiled by the Illuminating the Druggable Genome (IDG) program (Round 1 and Round 2 datasets). Heatmap on the left is for illustrative purposes only (see Supplementary Fig. 2 for the actual test data matrices, and Supplementary Fig. 3 for the Challenge timeline). All the models, new bioactivity data, and benchmarking infrastructure are openly available to support future target prediction and benchmarking studies. BF Bayes factor; RMSE Root Mean Square Error.
Fig. 2
Fig. 2. Challenge test datasets.
a The overlap between Round 1 and Round 2 kinase inhibitors and kinase targets, and their distributions in the kinome tree (b), and across various kinase groups (e). c The quantitative dissociation constant (Kd) of compound-kinase activities was measured in dose-response assays (see Methods), presented in the logarithmic scale as pKd = −log10(Kd). The higher the pKd value, the higher the inhibitory ability of a compound against a protein kinase (Supplementary Data 1 includes the compounds and kinases in Round 1 and Round 2 test datasets). The frequent values of pKd = 5 originate from inactive pairs (maximum tested concentration of 10 µM in the multi-dose activity profiling). d The selectivity index of kinase inhibitors was calculated based on the single-dose activity assay (at 1 µM concentration) across the full compound-kinase matrices before the Challenge. The kinome tree figure was created with KinMap, reproduced courtesy of Cell Signaling Technology, Inc. Source data are provided as a Source Data file.
Fig. 3
Fig. 3. Overall performance of the Challenge submissions.
a, c Performance of the submissions in terms of the two winning metrics in Round 1 (n = 169 submissions) and Round 2 (n = 99 submissions). The horizontal lines indicate median correlation and the colors mark the baseline model and the top-performing participants in Round 2 (see the color legend of f). The empty circles mark the submissions that did not differ from random predictions (the open pink circle indicates the Round 1 submission of Zahraa Sobhy as an example). The baseline model remained the same in both of the rounds. b, d Distributions of the random predictions (based on 10,000 permuted pKd values) and replicate distributions (based on 10,000 subsamples with replacement of overlapping pKd pairs between two large-scale target activity profiling studies,) in Round 1 (top panel) and Round 2 (bottom). The points correspond to the individual submissions. e, f Relationship of the two winning metrics across the submissions in Round 1 and Round 2. The triangle shape indicates submissions based on deep learning (DL) in Round 2 (f). For instance, team DMIS_DK submitted predictions based both on random forest (RF) and DL algorithms in Round 2, where the latter showed slightly better accuracy. A total of 33 submissions with Root Mean Square Error (RMSE) >2 are omitted in the RMSE results (c, e, f). Source data are provided as a Source Data file.
Fig. 4
Fig. 4. The top-performing Challenge models and their ensemble combination.
a Spearman correlation sub-challenge top performer in Round 2 (Q.E.D). b RMSE sub-challenge top performer in Round 2 (AI Winter is Coming). The points correspond to 394 pairs between 25 compounds and 207 kinases. c Ensemble model that combines the top four models selected based on their Spearman correlation in Round 2. d The mean aggregation ensemble model was constructed by adding an increasing number of top-performing models based on their Spearman correlation (the solid curve), until the ensemble correlation dropped below 0.45. The peak performance was reached after aggregating four teams (marked in the legend; see Supplementary Fig. 9 for all the teams. Note: ensemble prediction from a total of 21 best teams had a significantly better Spearman correlation compared to the Q.E.D model alone). The right-hand y-axis and the dotted curve show the Root Mean Square Error (RMSE) of the ensemble model as a function of an increasing number of top-performing models. Source data are provided as a Source Data file.
Fig. 5
Fig. 5. The Q.E.D model performance as a function of training data size and scope.
a The drop-out experiment removed increasing numbers of training compounds (as measured by maximum Tanimoto similarity with ECFP4 fingerprint between each training compound and all Round 2 test set compounds), retrained the Q.E.D model, and tested the performance. AD stands for all data. A noticeable decrease in performance begins to appear only at around 0.6 Tanimoto similarity suggesting that highly similar compounds in the training dataset are not necessarily required for accurate model performance. As a control, identical numbers of random compound-kinase pairs were removed, repeated 5 times to assess the variability of random removal. The error bars indicate the standard deviation of these replicates. Black points indicate proportions of removed compound-kinase pairs. b A histogram describing the full training dataset used to generate the results in a. c Model performance with multiple training datasets and varying pKd levels, where the ranges in the x-axis labels refer to the compound-kinase pairs that were included for the model training. AD stands for all data. Random dropout control was repeated 5 times. The error bars indicate the standard deviation of these replicates. d A histogram describing the full training dataset used to generate the results in c. Source data are provided as a Source Data file.
Fig. 6
Fig. 6. The effect of protein descriptors and bioactivity types on Q.E.D model accuracy.
The bars show Pearson correlations between the measured and Q.E.D model-predicted pKd’s calculated over the 394 Round 2 compound-kinase pairs based on different a protein kernels and b training bioactivity data types. The total number of training bioactivity data points is written in parentheses. The original, submitted Q.E.D model based on the full amino acid sequence-based protein kernel and using Kd, Ki, and EC50 bioactivities in the training dataset is marked with red. No other changes were introduced to the submitted Q.E.D model, which is an ensemble of the regressors with different regularization hyperparameter values and eight compound kernels, but where each regressor is built upon the same protein kernel based on full amino acid sequences. The protein kernel and training bioactivity type used in the baseline model are marked in boldface. The numbers inside the bars are Benjamini–Hochberg adjusted two-sided P values calculated with the Pearson and Filon test for comparing the correlation of the submitted Q.E.D model and each of its re-trained variants. Since the two correlations under comparison are calculated on the same set of data points and they have one variable in common (measured pKd), the dependence between pKd’s predicted by the submitted Q.E.D model and the new model variant is taken into account in the statistical test. Significant P values (adjusted P < 0.05) are written in boldface. Source data are provided as a Source Data file.
Fig. 7
Fig. 7. Top-performing model predictions compared against single-dose assays.
a Receiver operating characteristic (ROC) curves when ranking the 394 compound-kinase pairs in Round 2 using the pKd predictions either from the ensemble of the top-performing models (average predicted pKd from Q.E.D, DMIS_DK and AI Winter is Coming), or only from the Q.E.D model, compared against the experimental single-dose inhibition assays (the pairs with higher inhibition% are ranked first). The true positive activity class contains pairs with measured pKd > 6 (see Supplementary Fig. 15 for pKd > 7). The area under the ROC curve values are shown after the predictors (and the balanced accuracy is marked in the parentheses), and the diagonal dotted line shows the random predictor with an accuracy of AU-ROC = 0.50. b Precision-recall (PR) curves for the same activity classification analysis as shown in a. The area under the PR curve values are shown after the predictors and the horizontal dotted line indicates the random predictor with a precision of 0.64. Note: Round 2 Kd measurements were pre-selected to include mostly pairs with single-dose inhibition >80%, which makes Round 2 pairs optimal for systematic analysis of false positive predictions, and hence sensitivity (recall) and PPV (precision). However, these 394 pairs pre-selected for Kd profiling were less optimal for a comprehensive analysis of false negative predictions, and the evaluation of specificity. Source data are provided as a Source Data file.
Fig. 8
Fig. 8. Machine learning-based kinase activity predictions.
a Comparison of single-dose inhibition assay (at 1 µM) against multi-dose Kd assay activities across 475 compound-target pairs (395 from Round 2 and 81 from the post-Challenge experiments). The red points indicate false negatives and blue points false positives when using the cut-offs of pKd = 6 and inhibition = 80% among the 394 Round 2 pairs (including 75 pairs with inhibition >80% but that showed no activity in the dose-response assays, i.e, pKd = 5). The green points indicate the new 81 pairs profiled post-Challenge solely based on the ensemble model predictions, regardless of their inhibition levels. The black trace is the expected %inhibition rate based on measured pKd’s, estimated using the maximum ligand concentration of 1 µM both for the single-dose and dose-response assays (see Methods). bd Multi-dose (left) and single-dose (right) assays for kinases tested with TPKI-30, GSK1379763, and PFE-PKIS14. Green points indicate the new experimental validations based on the ensemble model predictions, whereas black points come from Round 2 data. Blue points indicate false positive predictions based either on predictive models or single-dose testing. e Predictive accuracy of the top-performing ensemble model (average predicted pKd), top-performing Q.E.D model and single-dose assay (at 1 µM), when classifying subsets of the 475 pairs into the true activity classes with measured pKd less or higher than 6. The y-axis indicates the area under the receiver operating characteristic (ROC) curve (AU-ROC) as a function of the single-dose inhibition% levels, x-axis the pairs with inhibition >x%, and the dashed black curve the percentage of all pairs that passed that single-dose activity threshold. The combined model trace corresponds to the average of measured and expected inhibition values, where the latter was calculated based on the mean ensemble of the top-performing model pKd predictions (Q.E.D, DMIS_DK and AI Winter is Coming). See Supplementary Fig. 16 for the corresponding analysis with precision-recall (PR) metric, and Supplementary Fig. 17 for the ROC and PR curves for all the 475 pairs. Source data are provided as a Source Data file.

References

    1. Oprea TI, et al. Unexplored therapeutic opportunities in the human genome. Nat. Rev. Drug Discov. 2018;17:317–332. doi: 10.1038/nrd.2018.14. - DOI - PMC - PubMed
    1. Arrowsmith CH, et al. The promise and peril of chemical probes. Nat. Chem. Biol. 2015;11:536–541. doi: 10.1038/nchembio.1867. - DOI - PMC - PubMed
    1. Santos R, et al. A comprehensive map of molecular drug targets. Nat. Rev. Drug Discov. 2017;16:19–34. doi: 10.1038/nrd.2016.230. - DOI - PMC - PubMed
    1. Dar AC, Das TK, Shokat KM, Cagan RL. Chemical genetic discovery of targets and anti-targets for cancer polypharmacology. Nature. 2012;486:80–84. doi: 10.1038/nature11127. - DOI - PMC - PubMed
    1. Fabian MA, et al. A small molecule–kinase interaction map for clinical kinase inhibitors. Nat. Biotechnol. 2005;23:329–336. doi: 10.1038/nbt1068. - DOI - PubMed

Publication types