. 2021 Jun 3;11(1):11765.
doi: 10.1038/s41598-021-91154-x.

Transcriptomic landscape of early age onset of colorectal cancer identifies novel genes and pathways in Indian CRC patients

Affiliations

Transcriptomic landscape of early age onset of colorectal cancer identifies novel genes and pathways in Indian CRC patients

Manish Pratap Singh et al. Sci Rep. .

Abstract

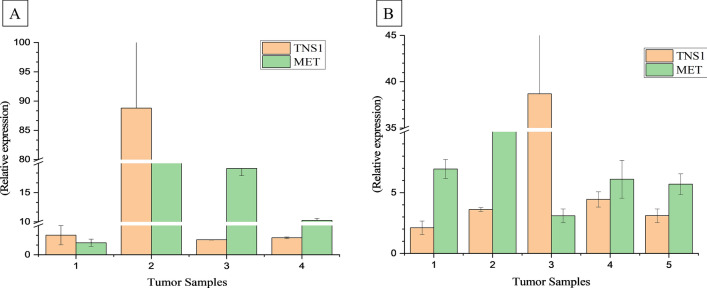
Past decades of the current millennium have witnessed an unprecedented rise in Early age Onset of Colo Rectal Cancer (EOCRC) cases in India as well as across the globe. Unfortunately, EOCRCs are diagnosed at a more advanced stage of cancer. Moreover, the aetiology of EOCRC is not fully explored and still remains obscure. This study is aimed towards the identification of genes and pathways implicated in the EOCRC. In the present study, we performed high throughput RNA sequencing of colorectal tumor tissues for four EOCRC (median age 43.5 years) samples with adjacent mucosa and performed subsequent bioinformatics analysis to identify novel deregulated pathways and genes. Our integrated analysis identifies 17 hub genes (INSR, TNS1, IL1RAP, CD22, FCRLA, CXCL3, HGF, MS4A1, CD79B, CXCR2, IL1A, PTPN11, IRS1, IL1B, MET, TCL1A, and IL1R1). Pathway analysis of identified genes revealed that they were involved in the MAPK signaling pathway, hematopoietic cell lineage, cytokine-cytokine receptor pathway and PI3K-Akt signaling pathway. Survival and stage plot analysis identified four genes CXCL3, IL1B, MET and TNS1 genes (p = 0.015, 0.038, 0.049 and 0.011 respectively), significantly associated with overall survival. Further, differential expression of TNS1 and MET were confirmed on the validation cohort of the 5 EOCRCs (median age < 50 years and sporadic origin). This is the first approach to find early age onset biomarkers in Indian CRC patients. Among these TNS1 and MET are novel for EOCRC and may serve as potential biomarkers and novel therapeutic targets in future.


Conflict of interest statement

The authors declare no competing interests.

Figures

Figure 1
Figure 1
Identification of DEGs in tumor samples. (A), (B), (C), (D) represents Volcano plot of all expressed genes in each pairwise comparison in tumors 1, 2, 3 and 4, respectively. The x-axis shows the log 2 (fold change) and the y-axis shows the – log 10 (1 − P). Each dot is a differentially expressed gene (DEG). Red dots denote upregulated DEGs and green dots are downregulated DEGs. (E) Expression heat map of top 20 down and upregulated DEGs. (F) Venn analysis of common DEGs among 4 tumor samples for log 2 (fold change) ± 2.
Figure 2
Figure 2
QRT-PCR analysis of upregulated and down regulated DEGs from RNA-Seq data analysis. The left panel of genes represents up regulated DEGs and the right panel of genes represents downregulated DEGs.
Figure 3
Figure 3
Functional characteristic analysis of DEGs on Shinny GO v0.61 (http://bioinformatics.sdstate.edu/go/). (AC) represents the gene ontology enrichment for upregulated DEGs and (DF) represents the gene ontology for down regulated DEGs. (A) and (D) networks are DEGs for biological process (BP), (B) and (E) are cellular components (CC) and (D) & (F) networks are for molecular function (MF) gene enrichment analysis. In each network the size of the node denotes no. of genes involved in a particular function and intensity of color denotes the significance of interaction. MONA GO (https://monago.erc.monash.edu/) (G and H) represent the cumulative biological processes for upregulated and downregulated DEGs, respectively.
Figure 4
Figure 4
Analysis of PPI interaction and hub genes identification. (A) Co-expression networks and sub-modules using WGCNA (Weighted correlation network analysis) of DEGs on iDEP 9.0 (http://bioinformatics.sdstate.edu/idep/) generates modules of the top 10 highly correlated genes. (B) Identification of significant hub genes from DEGs using DMNC and MCC algorithm on Cytoscape 3.7.1. Color represents the ranked hub genes on Cytoscape based on the corrected p value. (C) Venn analysis of both sets of hub genes to find common significant hub genes (http://bioinformatics.psb.ugent.be/webtools/Venn/).
Figure 5
Figure 5
TCGA based validation and survival analysis on GEPIA (http://gepia.cancer-pku.cn/index.html). (A) Overall survival analysis of significant hub genes on TCGA using the COAD cohort. (B) Gene expression analysis of TNS1, CXCL3, MET, IL1B and IL1A in all stages (I–IV) of CRC.
Figure 6
Figure 6
Pathway analysis and cellular processes analysis of Hub genes on string database version 11.0 (https://string-db.org/). Each node is representative of a gene interacting within the clusters. The nodes present in the clusters are filled by different colors respective of the pathway shared by that gene having significant FDR in the KEGG database. The color codes are provided in the right corner and details of respective pathways are provided in Table 2.
Figure 7
Figure 7
Differential expression analysis of TNS1 and MET gene on EOCRC. (A) Represents the relative expression analysis 4 tumor samples of the discovery cohort and (B) Represents the relative expression analysis of TNS1 and MET gene on validation cohort.

References

    1. Bray F, et al. Global cancer statistics 2018: GLOBOCAN estimates of incidence and mortality worldwide for 36 cancers in 185 countries. CA Cancer J. Clin. 2018;68:394–424. doi: 10.3322/caac.21492. - DOI - PubMed
    1. Siegel RL, Miller KD, Jemal A. Cancer statistics, 2019. CA Cancer J. Clin. 2019;69:7–34. - PubMed
    1. Abualkhair WH, et al. Trends in incidence of early-onset colorectal cancer in the United States among those approaching screening age. JAMA Netw. Open. 2020;3:e1920407–e1920407. doi: 10.1001/jamanetworkopen.2019.20407. - DOI - PMC - PubMed
    1. Anderson JC, Samadder JN. To screen or not to screen adults 45–49 years of age: That is the question. Am. J. Gastroenterol. 2018;113:1750–1753. doi: 10.1038/s41395-018-0402-3. - DOI - PMC - PubMed
    1. Wolf AMD, et al. Colorectal cancer screening for average-risk adults: 2018 guideline update from the American Cancer Society. CA Cancer J. Clin. 2018;68:250–281. doi: 10.3322/caac.21457. - DOI - PubMed

Publication types