. 2021 Jun 3;11(1):11799.
doi: 10.1038/s41598-021-91284-2.

BET inhibitor suppresses migration of human hepatocellular carcinoma by inhibiting SMARCA4

Affiliations

BET inhibitor suppresses migration of human hepatocellular carcinoma by inhibiting SMARCA4

Hae In Choi et al. Sci Rep. .

Abstract

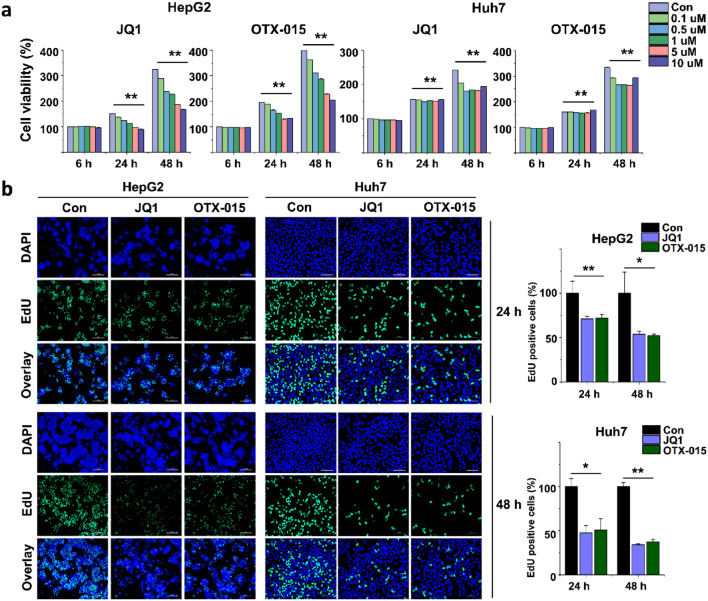
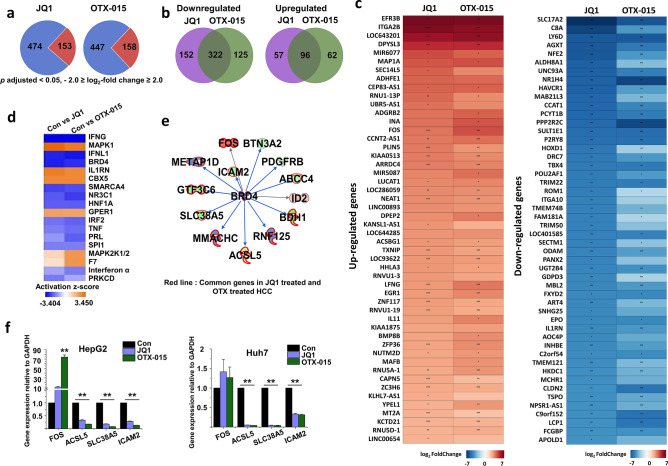
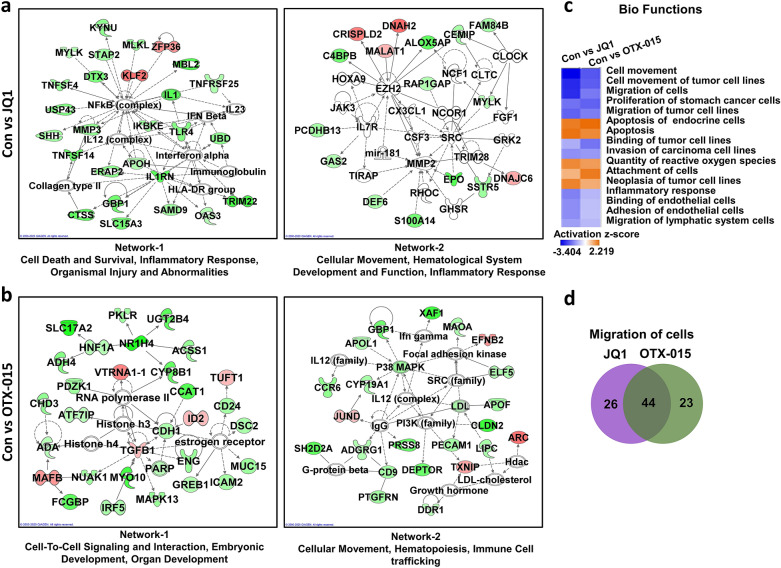
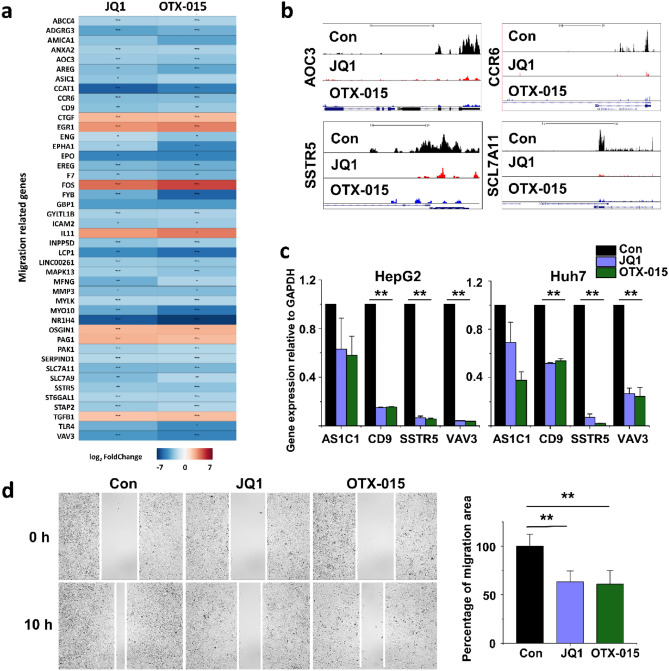
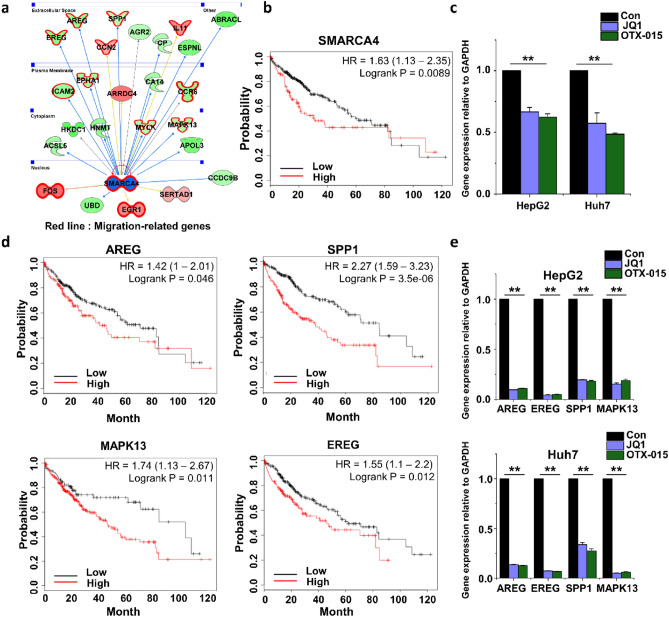
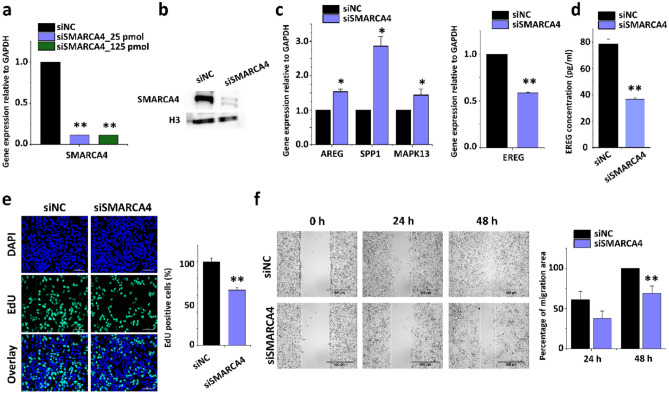
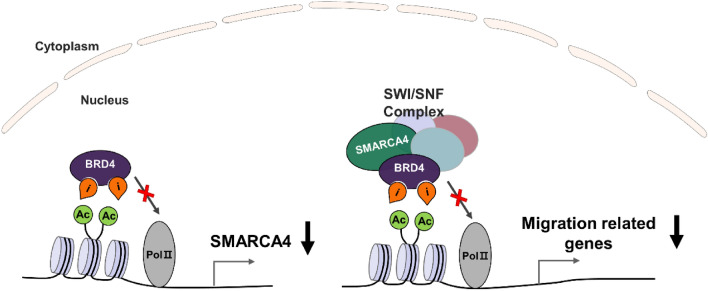
Hepatocellular carcinoma (HCC) is one of the most prevalent and poorly responsive cancers worldwide. Bromodomain and extraterminal (BET) inhibitors, such as JQ1 and OTX-015, inhibit BET protein binding to acetylated residues in histones. However, the physiological mechanisms and regulatory processes of BET inhibition in HCC remain unclear. To explore BET inhibitors' potential role in the molecular mechanisms underlying their anticancer effects in HCC, we analyzed BET inhibitor-treated HCC cells' gene expression profiles with RNA-seq and bioinformatics analysis. BET inhibitor treatment significantly downregulated genes related to bromodomain-containing proteins 4 (BRD4), such as ACSL5, SLC38A5, and ICAM2. Importantly, some cell migration-related genes, including AOC3, CCR6, SSTR5, and SCL7A11, were significantly downregulated. Additionally, bioinformatics analysis using Ingenuity Knowledge Base Ingenuity Pathway Analysis (IPA) revealed that SMARCA4 regulated migration response molecules. Furthermore, knockdown of SMARCA4 gene expression by siRNA treatment significantly reduced cell migration and the expression of migration-related genes. In summary, our results indicated that BET inhibitor treatment in HCC cell lines reduces cell migration through the downregulation of SMARCA4.


Conflict of interest statement

The authors declare no competing interests.

Figures

Figure 1
Figure 1
BET inhibition reduced cell proliferation of HCC. (a) HCC cell lines were treated with different concentrations of BET inhibitors (JQ1 or OTX-015) for different durations (6 h, 24 h, and 48 h). Cell proliferation was determined using a WST-1 assay. HCC cells treated with BET inhibitors were significantly reduced after 24 h of treatment. (b) Representative photo images of the EdU assay of HCC cells treated with BET inhibitors and quantification of EdU-positive cells. The data represent three biologically independent experiments. **p < 0.01.
Figure 2
Figure 2
Differential gene expression in BET inhibitor-treated HCC cells and comparison of JQ1-inducible and OTX-inducible transcriptional datasets. (a) Pie chart displaying the number of up- and downregulated genes of BET inhibitor-treated HCC cells. Blue indicates downregulation, and red indicates upregulation. (b) The overlap area indicates the number of shared up- and downregulated genes in JQ1- and OTX-015-treated HepG2 cells. (c) A heat map representing the top 50 up- and downregulated genes in BET inhibitor-treated HepG2 cells (p adjusted < 0.05, log2-fold change ≥ 2, log2-fold change ≤ − 2). The color scale shown in the heat map represents the log2 fold change values. Red color indicates upregulated genes while blue color indicates downregulated genes. The heat map was created in R using the ggplot2 package version 3.3.3 (URL: https://ggplot2.tidyverse.org). The p value with an asterisk attached in the cell represents *p < 0.05, **p < 0.01, and ***p < 0.001. (d) Upstream regulator analysis of alternated gene datasets in Con vs. JQ1-treated HCC and Con vs. OTX-015-treated HCC cells using Ingenuity pathway analysis (IPA; https://www.quiagenbioinformatics.com/products/ingenuity-pathway-analysis). (e) The activity of highly connected negative regulators of BRD4, a member of the BET family of proteins, led to this network’s inactivation, as assessed using the IPA molecule activity predictor in BET inhibitor-treated HCC cells. The red line indicates common genes in JQ1- and OTX-015-treated HepG2 cells. (f) Confirmation of differentially expressed genes by qPCR in BET inhibitor-treated HCC cells compared with DMSO-treated HCC cells. The values are the mean ± S.D. of triplicate wells. **p < 0.01.
Figure 3
Figure 3
IPA-based network analysis of JQ1- or OTX-015-treated HCC cells. (a) Gene networks of JQ1- or (b) OTX-015-treated HCC cells by IPA. (c) Biofunctional analysis of alternated gene datasets in Con vs. JQ1-treated HCC and Con vs. OTX-015-treated HCC cells using IPA. (d) The area of overlap indicates the number of shared genes that related with migration of cells in JQ1 and OTX-015 treated HepG2.
Figure 4
Figure 4
Downregulation of cell migration-related genes in BET inhibitor-treated HCC cells. (a) A heat map representing the migration-related genes in BET inhibitor-treated HepG2 cells compared with those in the controls. The color scale shown in the heat map represents the log2 fold change values. Red color indicates upregulated genes while blue color indicates downregulated genes. The heat map was created in R using the ggplot2 package version 3.3.3 (URL: https://ggplot2.tidyverse.org). The p value with an asterisk attached in the cell represents *p < 0.05, **p < 0.01, and ***p < 0.001. (b) The UCSC genome browser images show normalized RNA-seq read densities in control, JQ1-treated, and OTX-015-treated HCC cells. (c) Confirmation of differentially expressed genes using qPCR in JQ1- or OTX-015-treated HCC cells. The values are the mean ± S.D. from triplicate well measurements. **p < 0.01. The data represent three independent experiments. (d) The migration of HCC cells was determined using a wound-healing assay. Migrating HCC cells were determined after 10 h of JQ1 or OTX-015 treatment. The area filled with HCC cells that entered the middle blank fields was calculated. The data represent three biologically, independent experiments. **p < 0.01.
Figure 5
Figure 5
Differences in the expression of migration-related genes. (a) Migration response molecules were analyzed with an IPA molecule activity predictor. Shown are the migration response molecules regulated by SMARCA4. The red line indicates migration-related genes. (b) Kaplan–Meier plotter analysis for overall survival of HCC patients was divided into high and low SMARCA4 expression groups. The result indicated that patients with low SMARCA4 expression had a better prognosis than those with high SMARCA4 expression. (c) Confirmation of SMARCA4 expression levels in JQ1- or OTX-015-treated HCC cells. (d) Kaplan–Meier plotter analysis for overall survival of HCC patients was divided into high and low AREG, SPP1, MAPK13, and EREG expression groups. (e) Confirmation of the expression levels of AREG, EREG, SPP1, and MAPK13 in JQ1- or OTX-015-treated HCC cells. The values are the mean ± S.D. of triplicate well measurements. **p < 0.01.
Figure 6
Figure 6
SMARCA4 regulated cell migration responses in HCC cells. (a) Quantitative PCRs were showing relative mRNA expression levels of SMARCA4 in scrambled siRNA control (n = 3) and SMARCA4 siRNA-treated HCC cells. Gene expression level was normalized to GAPDH. The values are the mean ± S.D. of triplicate well measurements. **p < 0.01. (b) Western blot was showing down-regulated SMARCA4 protein levels in siRNA-treated HCC cells. (c) Confirmation of the expression levels of EREG, AREG, SPP1, and MAPK13 in SMARCA4 siRNA-treated HCC cells. The values are the mean ± S.D. of triplicate wells. *p < 0.05 and **p < 0.01. (d) ELISA result showing the release of EREG upon repression of SMRACA4 expression. The values are means ± SD of triplicate wells. **p < 0.01. (e) Effect of SMARCA4 siRNA on cell proliferation by EdU assay. The data represent three biologically, independent experiments. **p < 0.01. (f) The migration of HCC cells was determined using a wound-healing assay. HCC cells migrated after 24 h and 48 h of SMARCA4 siRNA-treatment. The area filled with HCC cells that entered the middle blank fields was calculated. The data represent three biologically independent experiments. **p < 0.01.
Figure 7
Figure 7
Schematic representation of SMARCA4 regulating cell migration by BET inhibitors. BRD4 and SMARCA4 have bromodomain to recognize histone acetylation and initiate transcription. SMARCA4 regulates transcription by binding to the acetyl residues of histone H3 and involves chromatin remodeling for gene expression by binding to BRD4 as an SWI/SNF complex.

Similar articles

Cited by

References

    1. Balogh J, et al. Hepatocellular carcinoma: A review. J. Hepatocell. Carcinoma. 2016;3:41–53. doi: 10.2147/JHC.S61146. - DOI - PMC - PubMed
    1. Yang JD, et al. A global view of hepatocellular carcinoma: trends, risk, prevention and management. Nat. Rev. Gastroenterol. Hepatol. 2019;16:589–604. doi: 10.1038/s41575-019-0186-y. - DOI - PMC - PubMed
    1. Katyal S, et al. Extrahepatic metastases of hepatocellular carcinoma. Radiology. 2000;216:698–703. doi: 10.1148/radiology.216.3.r00se24698. - DOI - PubMed
    1. Kummar S, Shafi NQ. Metastatic hepatocellular carcinoma. Clin. Oncol. 2003;15:288–294. doi: 10.1016/s0936-6555(03)00067-0. - DOI - PubMed
    1. Longo L, de Freitas LBR, Santos D, Grivicich I, Alvares-da-Silva MR. Sorafenib for advanced hepatocellular carcinoma: A real-life experience. Dig. Dis. 2018;36:377–384. doi: 10.1159/000490378. - DOI - PubMed

Publication types

MeSH terms