. 2021 Aug;5(8):1027-1045.
doi: 10.1038/s41562-021-01108-6. Epub 2021 Jun 3.

Mapping inequalities in exclusive breastfeeding in low- and middle-income countries, 2000-2018

Collaborators, Affiliations

Mapping inequalities in exclusive breastfeeding in low- and middle-income countries, 2000-2018

Natalia V Bhattacharjee et al. Nat Hum Behav. 2021 Aug.

Abstract

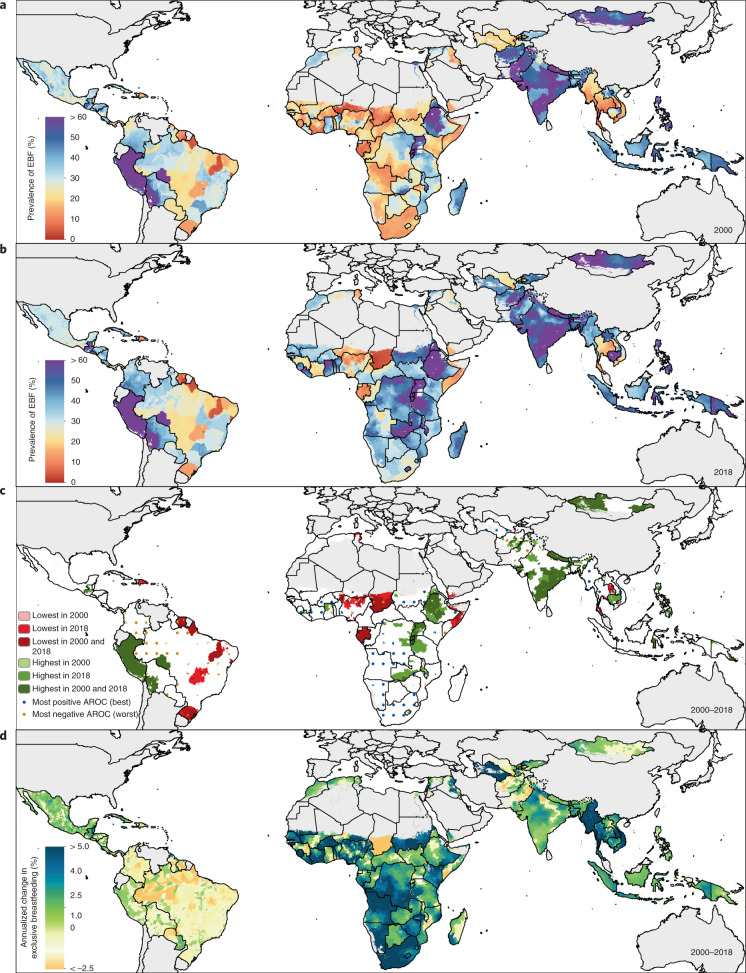
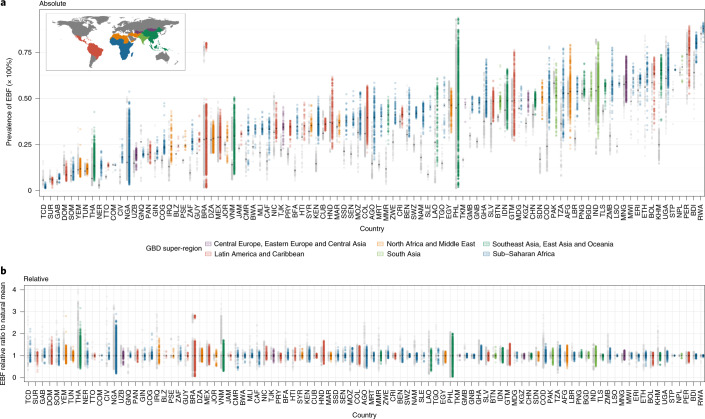
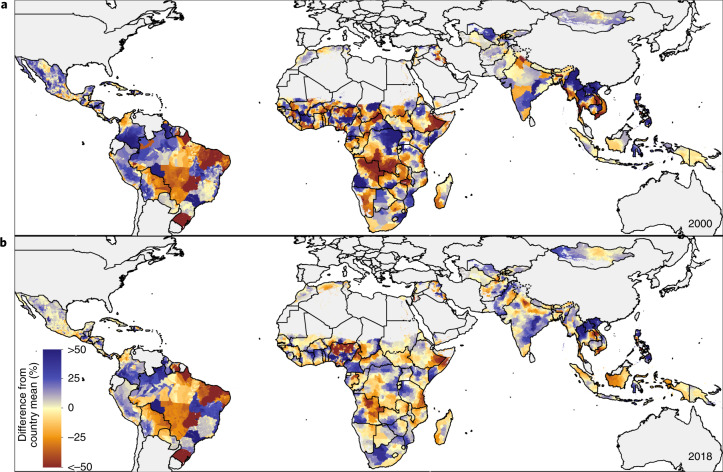
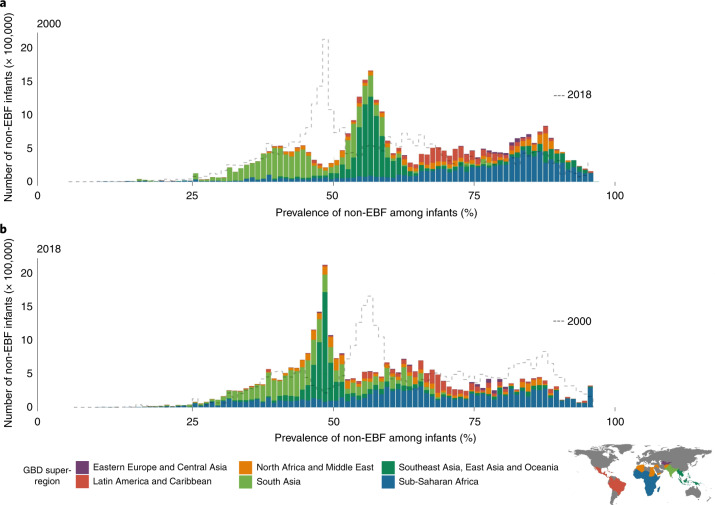
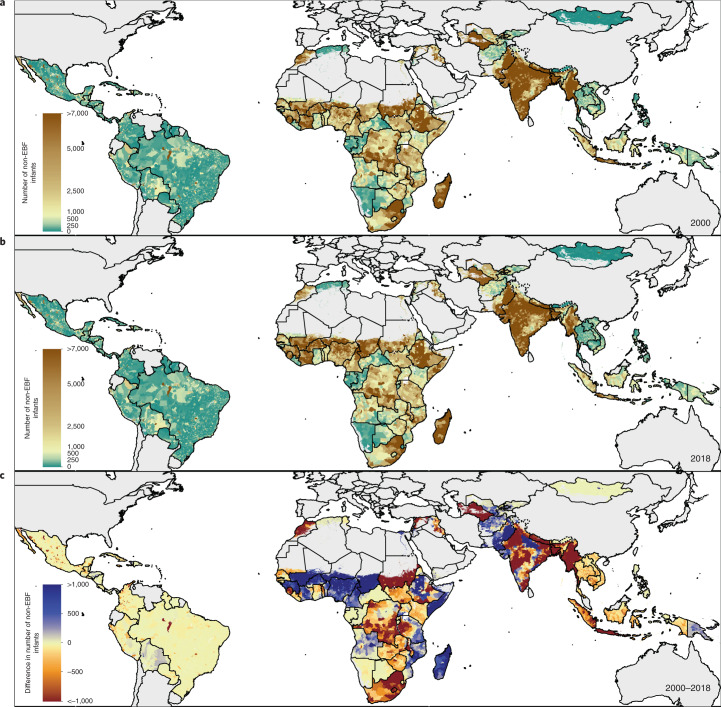
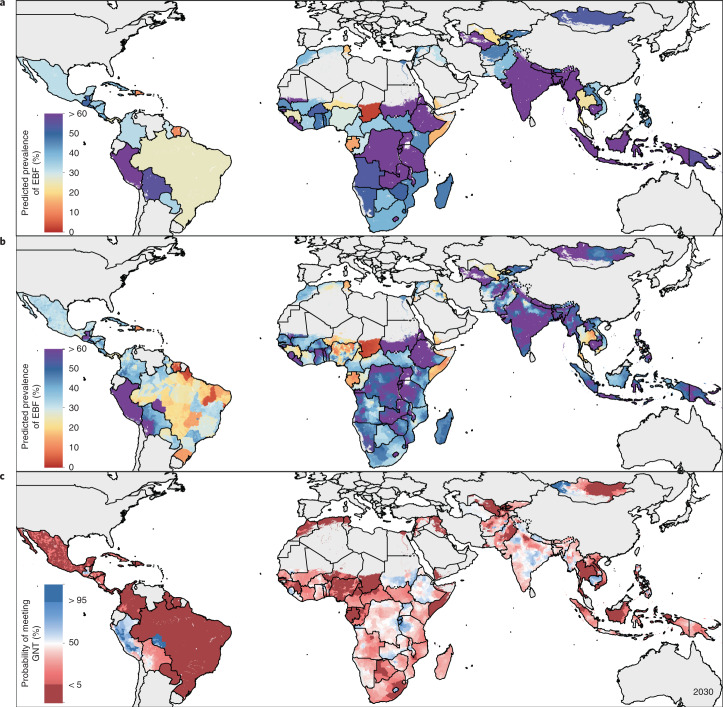
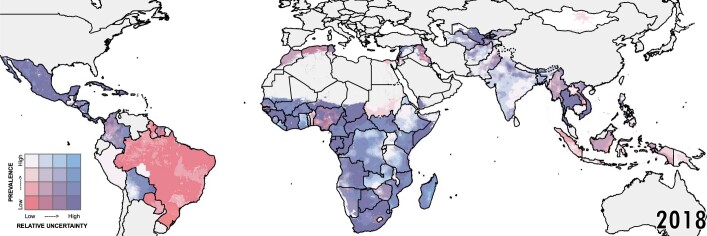
Exclusive breastfeeding (EBF)-giving infants only breast-milk for the first 6 months of life-is a component of optimal breastfeeding practices effective in preventing child morbidity and mortality. EBF practices are known to vary by population and comparable subnational estimates of prevalence and progress across low- and middle-income countries (LMICs) are required for planning policy and interventions. Here we present a geospatial analysis of EBF prevalence estimates from 2000 to 2018 across 94 LMICs mapped to policy-relevant administrative units (for example, districts), quantify subnational inequalities and their changes over time, and estimate probabilities of meeting the World Health Organization's Global Nutrition Target (WHO GNT) of ≥70% EBF prevalence by 2030. While six LMICs are projected to meet the WHO GNT of ≥70% EBF prevalence at a national scale, only three are predicted to meet the target in all their district-level units by 2030.


Conflict of interest statement

R.A. reports he received consultancy or speakers fees from UCB, Sandoz, Abbvie, Zentiva, Teva, Laropharm, CEGEDIM, Angelini, Biessen Pharma, Hofigal, AstraZeneca and Stada. A.Deshpande reports grants from Bill & Mellinda Gates Foundation, during the conduct of the study. J.J.J. reports personal fees from Boehringer Ingelheim, Zentiva, Amgen and Teva, all outside the submitted work. K.Krishan reports grants from DST PURSE and UGC Centre of Advanced Study, CAS II, awarded to the Department of Anthropology, Panjab University, Chandigarh, India, outside the submitted work. J.F.M. reports grants from Bill & Melinda Gates Foundation during the conduct of the study. S.R.P. reports non-financial support from Somnogen Canada Inc. and personal fees from editorial services, during the conduct of the study. E.U. reports having a Patent A system and method of reusable filters for anti-pollution mask pending and a Patent A system and method for electricity generation through crop stubble by using microbial fuel cells pending. All other authors declare no competing interests.

Figures

Fig. 1
Fig. 1. EBF prevalence and progress (2000–2018) among infants under 6 months across LMICs.
a,b, Prevalence of EBF practices at the district level in 2000 (a) and 2018 (b). c, Overlapping population-weighted highest and lowest deciles of prevalence and weighted AROC between 2000 and 2018, at the district level. d, Weighted annualized percentage change in EBF prevalence between 2000 and 2018. Maps reflect administrative boundaries, land cover, lakes and population; grey-coloured grid cells had fewer than ten people per 1 × 1-km grid cell and were classified as ‘barren or sparsely vegetated’ or were not included in this analysis.
Fig. 2
Fig. 2. Geographic inequalities in EBF prevalence across 94 countries for 2000 and 2018.
a, Absolute inequalities: range of EBF estimates in district-level units within 94 LMICs. b, Relative inequalities: range of ratios of EBF estimates in district-level units relative to country means. Each dot represents a district-level unit. The lower bound of each bar represents the district-level unit with the lowest EBF in each country. The upper end of each bar represents the district-level unit with the highest EBF in each country. Thus, each bar represents the extent of geographic inequality in EBF estimated for each country. Bars indicating the range in 2018 are coloured according to their GBD super-region. Grey bars indicate the range in EBF in 2000. The black diamond in each bar represents the median EBF estimated across district-level units in each country and year. A coloured bar that is shorter than its grey counterpart indicates that geographic inequality has narrowed. Countries are labeled by their ISO 3 codes (full country names are listed in Supplementary Table 4).
Fig. 3
Fig. 3. Relative geographic inequalities within countries in EBF prevalence in 2000 and 2018: comparing district-level units to the country-level means.
a,b, Relative deviation of EBF prevalence in district-level units from the country-level EBF mean in 2000 (a) and 2018 (b). Blue indicates a positive deviation from the EBF country-level mean, indicating a higher EBF prevalence level. Red indicates a negative deviation from the EBF country-level mean, indicating a lower EBF prevalence level. Maps reflect administrative boundaries, land cover, lakes and population; grey-coloured grid cells had fewer than ten people per 1 × 1-km grid cell and were classified as ‘barren or sparsely vegetated’ or were not included in this analysis.
Fig. 4
Fig. 4. Number of infants under 6 months who are not being exclusively breastfed, distributed across non-EBF prevalence in 2000 and 2018, across 94 countries.
a, Non-EBF infants under 6 months in 2000. b, Non-EBF infants under 6 months in 2018. The dotted line in the 2000 plot is the shape of the distribution in 2018 and the dotted line in the 2018 plot represents the distribution in 2000. Bar heights represent the total number of infants under 6 months who were not exclusively breastfed by district-level units, with corresponding non-EBF prevalence. Bins are a width of one non-EBF infant per 100 infants. The colour of each bar represents the global region as defined by the subset legend map. As such, the sum of heights of all bars represents the total number of non-EBF infants across the 94 countries.
Fig. 5
Fig. 5. Number of infants under 6 months who are not being exclusively breastfed at the district level, 2000 and 2018.
a,b, Number of infants under 6 months who are not being exclusively breastfed, aggregated to district-level units in 2000 (a) and 2018 (b). c, Difference in number of infants under 6 months who are not being exclusively breastfed between 2018 and 2000, aggregated to district-level units. Maps reflect administrative boundaries, land cover, lakes and population; grey-coloured grid cells had fewer than ten people per 1 × 1-km grid cell and were classified as ‘barren or sparsely vegetated’ or were not included in this analysis.
Fig. 6
Fig. 6. Projected prevalence for EBF for 2030 and probability of meeting the ≥70% WHO GNT by 2030.
a,b, Projected EBF prevalence for 2030 at the national (a) and district (b) levels. c, Probability of meeting the WHO GNT of at least 70% EBF prevalence by 2030 at the district level. Dark blue indicates a high probability (>95% posterior probability) and dark red indicates a low probability (<5% posterior probability) of meeting the WHO GNT by 2030. Maps reflect administrative boundaries, land cover, lakes and population; grey-coloured grid cells had fewer than ten people per 1 × 1-km grid cell and were classified as ‘barren or sparsely vegetated’ or were not included in this analysis.
Extended Data Fig. 1
Extended Data Fig. 1. Analytic process overview.
The process used to produce EBF prevalence estimates across LMICs involved three main parts. In the data-processing steps (orange), data were identified, extracted, and prepared for use in the models. In the modelling phase (yellow), we used these data and covariates in stacked generalization ensemble models and spatiotemporal Gaussian process models for each EBF indicator. In post-processing (green), we calibrated the prevalence estimates to match the GBD 2019 study estimates and aggregated the estimates to the first- and second-administrative levels in each country.
Extended Data Fig. 2
Extended Data Fig. 2. National time series plots and aggregated input data.
National time series plots of the post-GBD calibration final estimates by country during 2000–2018. Uncertainty ranges are presented in grey, and aggregated input data are classified by survey series (purple for country-specific, green for DHS, and yellow for MICS surveys), data type (square for polygon, circle for point data), and whether the survey is nationally or subnationally representative).
Extended Data Fig. 3
Extended Data Fig. 3. Relative uncertainty in EBF estimates for 2018.
Relative uncertainty in second-administrative-level estimates compared with mean estimated EBF prevalence in each second-administrative-level unit for 2018. Mean prevalence and relative uncertainty are split into population-weighted quartiles. These cut-off points for relative uncertainty (calculated as the absolute range of the uncertainty intervals divided by the estimate) are 0.684 (25th percentile), 0.916 (50th percentile), and 1.271 (75th percentile), respectively. The cut-off points for EBF prevalence are 25.8% (25th percentile), 35.4% (50th percentile), and 49.4% (75th percentile), respectively. Units in which our estimates are more uncertain are coloured with a scale of increasing blue hue, whereas areas in which the mean estimates of EBF are low are coloured with a scale of increasing red hue. Purple areas have low, but uncertain, estimates of EBF. White areas have high EBF estimates that are fairly certain. Relative uncertainty is defined as the ratio of the width of the 95% uncertainty interval to mean estimate. Maps reflect administrative boundaries, land cover, lakes, and population; grey-coloured grid cells had fewer than ten people per 1 × 1-km grid cell and were classified as ‘barren or sparsely vegetated’, or were not included in this analysis.

References

    1. Ending Preventable Child Deaths from Pneumonia and Diarrhoea by 2025: The Integrated Global Action Plan for Pneumonia and Diarrhoea (GAPPD) (WHO & UNICEF, 2013); https://www.who.int/maternal_child_adolescent/documents/global_action_pl... - PubMed
    1. Victora CG, et al. Breastfeeding in the 21st century: epidemiology, mechanisms, and lifelong effect. Lancet. 2016;387:475–490. doi: 10.1016/S0140-6736(15)01024-7. - DOI - PubMed
    1. Bhutta ZA, et al. Interventions to address deaths from childhood pneumonia and diarrhoea equitably: what works and at what cost? Lancet. 2013;381:1417–1429. doi: 10.1016/S0140-6736(13)60648-0. - DOI - PubMed
    1. Darmstadt G, et al. Evidence-based, cost-effective interventions: how many newborn babies can we save? Lancet. 2005;11:977–988. doi: 10.1016/S0140-6736(05)71088-6. - DOI - PubMed
    1. O’Sullivan A, Farver M, Smilowitz JT. The influence of early infant-feeding practices on the intestinal microbiome and body composition in infants. Nutr. Metab. Insights. 2015;8:1–9. - PMC - PubMed

Publication types