. 2021 Jun;7(6):842-855.
doi: 10.1038/s41477-021-00932-y. Epub 2021 Jun 3.

Synthetic promoter designs enabled by a comprehensive analysis of plant core promoters

Affiliations

Synthetic promoter designs enabled by a comprehensive analysis of plant core promoters

Tobias Jores et al. Nat Plants. 2021 Jun.

Abstract

Targeted engineering of plant gene expression holds great promise for ensuring food security and for producing biopharmaceuticals in plants. However, this engineering requires thorough knowledge of cis-regulatory elements to precisely control either endogenous or introduced genes. To generate this knowledge, we used a massively parallel reporter assay to measure the activity of nearly complete sets of promoters from Arabidopsis, maize and sorghum. We demonstrate that core promoter elements-notably the TATA box-as well as promoter GC content and promoter-proximal transcription factor binding sites influence promoter strength. By performing the experiments in two assay systems, leaves of the dicot tobacco and protoplasts of the monocot maize, we detect species-specific differences in the contributions of GC content and transcription factors to promoter strength. Using these observations, we built computational models to predict promoter strength in both assay systems, allowing us to design highly active promoters comparable in activity to the viral 35S minimal promoter. Our results establish a promising experimental approach to optimize native promoter elements and generate synthetic ones with desirable features.


Conflict of interest statement

Competing interests

The authors declare no competing interests.

Figures

Extended Data Fig. 1 |
Extended Data Fig. 1 |. Promoter strength and in vivo expression levels of corresponding genes are not correlated.
a, Correlation (Pearson’s r) between the promoter strength and expression levels of the corresponding genes in the indicated species. each boxplot (centre line, median; box limits, upper and lower quartiles; whiskers, 1.5 × interquartile range; points, outliers) represents the correlation for all individual tissue samples in the RNA-seq dataset (see Methods). The number of samples in the RNA-seq dataset is indicated at the bottom of the plot. b,c, examples of the correlation between gene expression (Arabidopsis adult cotyledon (b) or maize root cortex (c) samples) and promoter strength as determined in tobacco leaves (b) or maize protoplasts (c). These examples correspond to the highest correlations in (a).
Extended Data Fig. 2 |
Extended Data Fig. 2 |. Strength of maize promoters depends on the TATA box location in maize protoplasts.
a, Histogram showing the percentage of maize promoters with a TATA box at the indicated position (reproduced from Fig. 4). Three peaks in the distribution of TATA boxes are highlighted in grey. Peak 1 spans bases −72 to −65, peak 2 spans bases −59 to −50, and peak 3 spans bases −34 to −24. b, Violin plots, boxplots and significance levels (as defined in Fig. 2) of promoter strength for maize promoters without enhancer in the indicated assay system. Promoters without a TATA box (−) were compared to those with a TATA box outside (+/−) or within one of the three peaks highlighted in (a).
Extended Data Fig. 3 |
Extended Data Fig. 3 |. The BREu element is most active in maize protoplasts.
a-d, Violin plots of promoter strength in tobacco leaves (a,c) or maize protoplasts (b,d). Promoters with a strong or intermediate TATA box (motif score ≥ 0.7; see Methods) were grouped by GC content and split into promoters without (left half, darker colour) or with (right half, lighter colour) a BREu (a,b), or BREd (c,d) element. Violin plots, boxplots and significance levels are as defined in Fig. 2. Only one half is shown for violin plots. e,f, Logoplots for promoters with a BREu (e) or BREd (f) before (WT) and after (mut) introducing mutations that disrupt the elements. g, Logoplots for promoters without a BRE (WT) and with an inserted BREu (+ BREu) or BRed (+ BREd) element. h, Boxplots and significance levels (as defined in Fig. 4) for the relative strength of the promoter variants shown in (e-g). The corresponding WT promoter was set to 0 (horizontal black line).
Extended Data Fig. 4 |
Extended Data Fig. 4 |. The Y patch is a plant-specific core promoter element.
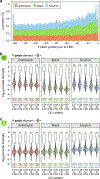
a, Histogram showing the percentage of promoters with a TATA box at the indicated position. b,c, Violin plots of promoter strength in tobacco leaves (b) or maize protoplasts (c). Promoters were grouped by GC content and split into promoters without (left half, darker colour) or with (right half, lighter colour) a Y patch. Violin plots, boxplots and significance levels are as defined in Fig. 2. Only one half is shown for violin plots.
Extended Data Fig. 5 |
Extended Data Fig. 5 |. Core promoter elements at the TSS influence promoter strength.
a-d, Violin plots of promoter strength in tobacco leaves (a,c) or maize protoplasts (b,d). Promoters were grouped by GC content and split into promoters without (left half, darker colour) or with (right half, lighter colour) an Inr (a,b), or TCT (c,d) element at the TSS. Violin plots, boxplots and significance levels are as defined in Fig. 2. Only one half is shown for violin plots.
Extended Data Fig. 6 |
Extended Data Fig. 6 |. Transcription factor binding sites contribute to promoter strength in an assay system-dependent manner.
a-d, Violin plots of promoter strength for libraries without enhancer in tobacco leaves (a,c) or maize protoplasts (b,d). Promoters were grouped by GC content and split into promoters without (left half, darker colour) or with (right half, lighter colour) a binding site for TCP (a,b) or HSF (c,d) transcription factors. Violin plots, boxplots and significance levels are as defined in Fig. 2. Only one half is shown for violin plots.
Extended Data Fig. 7 |
Extended Data Fig. 7 |. Transcription factor binding sites are more active upstream of the TATA box.
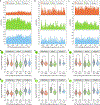
a-c, Histograms showing the number of promoters with a TCP (a), HSF (b), or NAC (c) transcription factor binding site at the indicated position. d-i, Violin plots, boxplots and significance levels (as defined in Fig. 2) of promoter strength for libraries without enhancer in tobacco leaves (d-f) or maize protoplasts (g-i). Promoters were grouped by the position of their TCP (d,g), HSF (e,h), or NAC (f,i) transcription factor binding site relative to the TATA box: either upstream (up) or downstream (down).
Extended Data Fig. 8 |
Extended Data Fig. 8 |. Promoter-proximal transcription factor binding sites influence enhancer responsiveness.
a-f, Violin plots of enhancer responsiveness in tobacco leaves (a,c,e) or maize protoplasts (b,d,f). Promoters were grouped by GC content and split into promoters without (left half, darker colour) or with (right half, lighter colour) a TCP (a,b), WRKY (c,d), or B3 (e,f) transcription factor binding site. Violin plots, boxplots and significance levels are as defined in Fig. 2. Only one half is shown for violin plots.
Extended Data Fig. 9 |
Extended Data Fig. 9 |. Mutations in transcription factor binding sites alter light-dependency.
a-c, One or two T > G mutations were introduced in binding sites for TCP (a,b) or WRKY (c) transcription factors. The orientation of a binding site in the wild type promoter determined the bases that were mutated. d, Boxplots and significance levels (as defined in Fig. 4) for the relative light-dependency of promoters harbouring mutations in the indicated transcription factor binding site as shown in (a-c). The corresponding wild type promoter was set to 0 (horizontal black line).
Extended Data Fig. 10 |
Extended Data Fig. 10 |. The in silico evolution of promoters is most effective in early rounds.
a,b, 150 native and 160 synthetic promoters were subjected to 10 rounds of in silico evolution and the strength of the evolved promoters was predicted with the tobacco model (a) or the maize model (b). The black line represents the median promoter strength after each round. c,d, Correlation (Pearson’s R2 and Spearman’s ρ) between the predicted and experimentally determined strength of promoters after 0, 3, or 10 rounds of in silico evolution. Promoter strengths measured in tobacco leaves were compared to predictions from the tobacco model (c) and the data from maize protoplasts was compared to the predictions from the maize model (d). The models used for the in silico evolution are indicated on each plot.
Fig. 1 |
Fig. 1 |. STARR-seq measures core promoter strength in tobacco leaves and maize protoplasts.
a, Assay scheme. The core promoters (bases −165 to +5 relative to the TSS) of all genes of Arabidopsis, maize and sorghum were array-synthesized and cloned into STARR-seq constructs to drive the expression of a barcoded GFP reporter gene. For each species, two libraries, one without and one with a 35S enhancer upstream of the promoter, were created. The libraries were subjected to STARR-seq in transiently transformed tobacco leaves and maize protoplasts. b, each promoter library (At, Arabidopsis; Zm, maize; Sb, sorghum) contained two internal control constructs driven by the 35S minimal promoter without (−) or with (+) an upstream 35S enhancer. The enrichment (log2) of recovered mRNA barcodes compared to DNA input was calculated with the enrichment of the enhancer-less control set to 0. In all following figures, this metric is indicated as promoter strength. each boxplot (centre line, median; box limits, upper and lower quartiles; whiskers, 1.5× interquartile range; points, outliers) represents the enrichment of all barcodes linked to the corresponding internal control construct. The number of barcodes is indicated at the bottom of the plot. c,d, Correlation (Pearson’s R2 and Spearman’s ρ) of two biological replicates of STARR-seq using the maize promoter libraries in tobacco leaves (c) or in maize protoplasts (d). e, Comparison of the strength of maize promoters in tobacco leaves and maize protoplasts. Pearson’s R2 and Spearman’s ρ are indicated.
Fig. 2 |
Fig. 2 |. Plant core promoters span a wide range of activity.
a,b, Violin plots of the strength of plant promoters from the indicated species as measured by STARR-seq in tobacco leaves (a) or maize protoplasts (b) for libraries without (−) or with (+) the 35S enhancer upstream of the promoter. c, enrichment of selected GO terms for genes associated with the 1,000 strongest promoters in the Arabidopsis (At), maize (Zm) and sorghum (Sb) promoter libraries without enhancer in tobacco leaves (top panel) and maize protoplasts (bottom panel). The red line marks the significance threshold (adjusted P ≤ 0.05). Non-significant bars are grey. The P values were determined using the gprofiler2 library in R with gSCS correction for multiple testing. exact P values are listed in Supplementary Table 11. d,e, Violin plots of promoter strength (libraries without 35S enhancer) in tobacco leaves (d) or maize protoplasts (e). Promoters were grouped by gene type. In a,b,d and e, violin plots represent the kernel density distribution and the boxplots within represent the median (centre line), upper and lower quartiles (box limits) and 1.5× the interquartile range (whiskers) for all corresponding promoters. Numbers at the bottom of the plot indicate the number of tested promoters. Significant differences between two samples were determined using the two-sided Wilcoxon rank-sum test and are indicated: *P ≤ 0.01; **P ≤ 0.001; ***P ≤ 0.0001; NS, not significant. exact P values are listed in Supplementary Table 11.
Fig. 3 |
Fig. 3 |. GC content affects promoter strength in tobacco leaves.
a, Distribution of GC content for all promoters of the indicated species. Lines denote the mean GC content of promoters (solid line) and the whole genome (dashed line). b, Violin plots, boxplots and significance levels (as defined in Fig. 2) of promoter strength for libraries without enhancer in tobacco leaves. Promoters are grouped by GC content to yield groups of approximately similar size. c, Correlation (Pearson’s r) between promoter strength and the GC content of a ten-base window around the indicated position in the plant promoters. d, As b but for promoter strength in maize protoplasts.
Fig. 4 |
Fig. 4 |. The TATA box is a key determinant of promoter strength.
a, Histograms showing the percentage of promoters with a TATA box at the indicated position. The region between positions −59 and −23 in which most TATA boxes reside is highlighted in grey. b,c, Violin plots, boxplots and significance levels (as defined in Fig. 2) of promoter strength for libraries without enhancer in tobacco leaves (b) or maize protoplasts (c). Promoters without a TATA box (−) were compared to those with a TATA box outside (+/−) or within (+/+) the −59 to −23 region. dg, Thirty plant promoters with a strong (d,e) or weak (f,g) TATA box (wild type, WT) were tested. One (mutA and mutB) or two (mutAB) T > G mutations were inserted into promoters with a strong TATA box (d,e). A canonical TATA box (+TATA) or one with a T > G mutation (+mutTATA) was used to replace the weak TATA box (f,g). Logoplots (f,d) of the TATA box regions of these promoters and their strength (g,e) relative to the WT promoter (set to 0, horizontal black line) are shown. Boxplots (centre line, median; box limits, upper and lower quartiles; whiskers, 1.5× interquartile range; points, outliers) denote the strength of the indicated promoter variants. Numbers at the bottom of the plot indicate the number of tested promoter elements. Significant differences from a null distribution were determined using the two-sided Wilcoxon signed rank test and are indicated: *P ≤ 0.01; **P ≤ 0.001; ***P ≤ 0.0001; NS, not significant. exact P values are listed in Supplementary Table 11. IC, information content.
Fig. 5 |
Fig. 5 |. Enhancer responsiveness of promoters depends on the TATA box and GC content.
a,b, Violin plots of enhancer responsiveness (promoter strengthwith enhancer divided by promoter strengthwithout enhancer) in tobacco leaves (a) or maize protoplasts (b). Promoters were grouped into three bins of approximately similar size according to the tissue-specificity τ of the expression of the associated gene. c,d, Violin plots of enhancer responsiveness in tobacco leaves (c) or maize protoplasts (d). Promoters without a TATA box (−) were compared to those with a TATA box outside (+/−) or within (+/+) the −59 to −23 region. e,f, Violin plots of enhancer responsiveness in tobacco leaves (e) or maize protoplasts (f) for promoters grouped by GC content. Violin plots, boxplots and significance levels in (af) are as defined in Fig. 2.
Fig. 6 |
Fig. 6 |. Promoter strength can be modulated by light.
a, Tobacco leaves were transiently transformed with STARR-seq promoter libraries and the plants were kept for 2 d in 16 h light/8 h dark cycles (light) or completely in the dark (dark) before mRNA extraction. b, Violin plots of light-dependency (promoter strengthlight divided by promoter strengthdark) for promoters in the libraries with (+) or without (−) the 35S enhancer. c, enrichment of selected GO terms for genes associated with the 1,000 most light-dependent promoters. The red line marks the significance threshold (adjusted P ≤ 0.05). Non-significant bars are grey. The P values were determined using the gprofiler2 library in R with gSCS correction for multiple testing. exact P values are listed in Supplementary Table 11. df, Violin plots of light-dependency. Promoters are grouped by GC content and split into promoters without (left half, darker colour) or with (right half, lighter colour) a TATA box (d) or a binding site for TCP (e) or WRKY (f) TFs. Violin plots, boxplots and significance levels in b and df are as defined in Fig. 2. Only one half is shown for violin plots in df.
Fig. 7 |
Fig. 7 |. Design and validation of synthetic promoters.
ac, Synthetic promoters with nucleotide frequencies similar to an average Arabidopsis (35.2% A, 16.6% C, 15.3% G and 32.8% T) or maize (24.5% A, 29.0% C, 22.5% G and 23.9% T) promoter were created and modified by adding a TATA box, Y patch and/or Inr element (a); promoter strength was determined by STARR-seq in tobacco leaves (b) and maize protoplasts (c). Promoters with an Arabidopsis-like nucleotide composition are shown on the left, those with maize-like base frequencies on the right. The strength of the 35S minimal promoter is indicated by a horizontal blue line. Individual data points are shown. df, TF-binding sites for TCP, NAC and HSF transcription factors were inserted at positions 35, 65 and/or 95 of the synthetic promoters with a TATA box (d) and the activity of promoters with a single binding site for the indicated TF (e) or multiple binding sites (f) was determined in tobacco leaves (left panel) or maize protoplasts (right panel). g,h, A single TCP (g) or HSF (h) TF-binding site was inserted at the indicated position in the synthetic promoters containing a TATA box. The strength of these promoters was measured in tobacco leaves (g) or maize protoplasts (h). Boxplots and significance levels in b,c and eh are as defined in Fig. 4. In eh, the corresponding promoter without any TF-binding site was set to 0 (horizontal black line).
Fig. 8 |
Fig. 8 |. Computational models can predict promoter strength and enable in silico evolution of plant promoters.
a, Correlation between the promoter strength as determined by STARR-seq using promoter libraries with the 35S enhancer and predictions from a linear model based on the GC content and motif scores for core promoter elements and TFs. The models were trained on data from the tobacco leaf system (tobacco model) or the maize protoplasts (maize model). The overall correlation is indicated in black and correlations for each species are coloured as indicated (inset). Correlations (Pearson’s R2) are shown for a test set of 10% of all promoters. b, Similar to a but the prediction is based on a CNN trained on promoter sequences. cf, Violin plots, boxplots and significance levels (as defined in Fig. 2) of promoter strength of the unmodified promoters (0 rounds of evolution) or after they were subjected to three or ten rounds of in silico evolution as determined in tobacco leaves (c,e) or maize protoplasts (d,f). The promoters were tested in a library with (c,d) or without (e,f) an upstream 35S enhancer. The models used for the in silico evolution are indicated on each plot. The promoter strength of the 35S promoter is indicated by a horizontal blue line.

References

    1. Liu W & Stewart CN Plant synthetic biology. Trends Plant Sci. 20, 309–317 (2015). - PubMed
    1. Lomonossoff GP & D’Aoust M-A Plant-produced biopharmaceuticals: a case of technical developments driving clinical deployment. Science 353, 1237–1240 (2016). - PubMed
    1. Smale ST & Kadonaga JT The RNA polymerase II core promoter. Annu. Rev. Biochem 72, 449–479 (2003). - PubMed
    1. Andersson R. & Sandelin A. Determinants of enhancer and promoter activities of regulatory elements. Nat. Rev. Genet 21, 71–87 (2020). - PubMed
    1. Ricci WA et al. Widespread long-range cis-regulatory elements in the maize genome. Nat. Plants 5, 1237–1249 (2019). - PMC - PubMed

Substances