. 2021 Jul;53(7):1104-1111.
doi: 10.1038/s41588-021-00877-0. Epub 2021 Jun 3.

Rapid genotype imputation from sequence with reference panels

Affiliations

Rapid genotype imputation from sequence with reference panels

Robert W Davies et al. Nat Genet. 2021 Jul.

Abstract

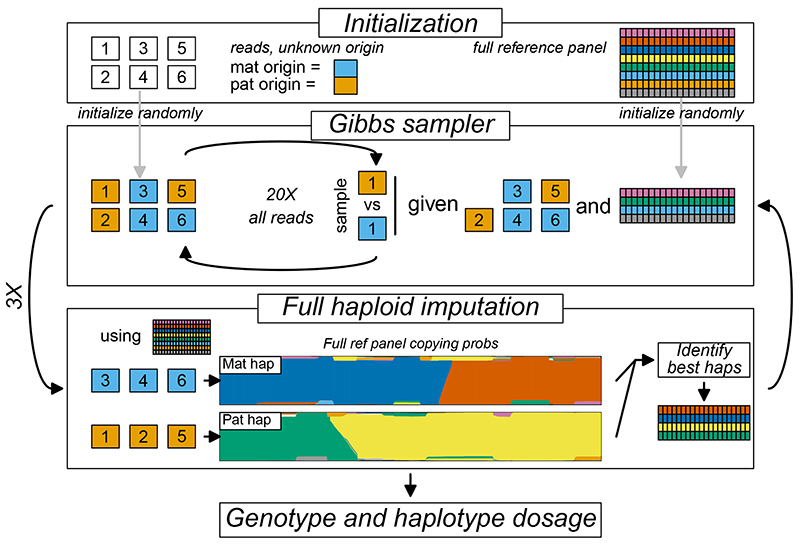
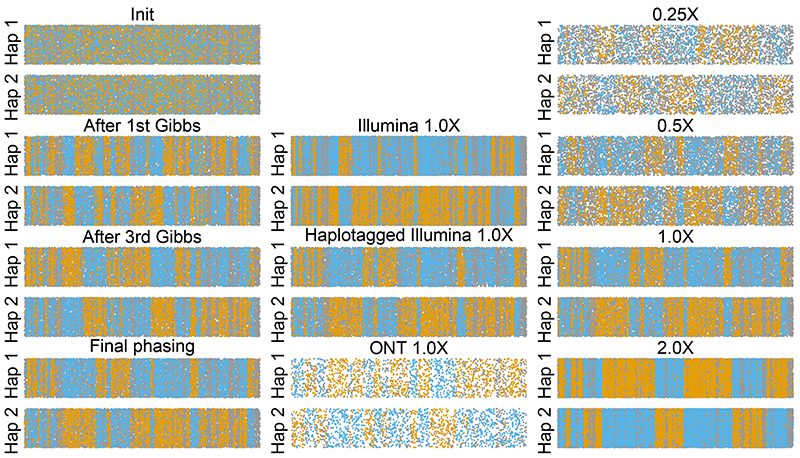
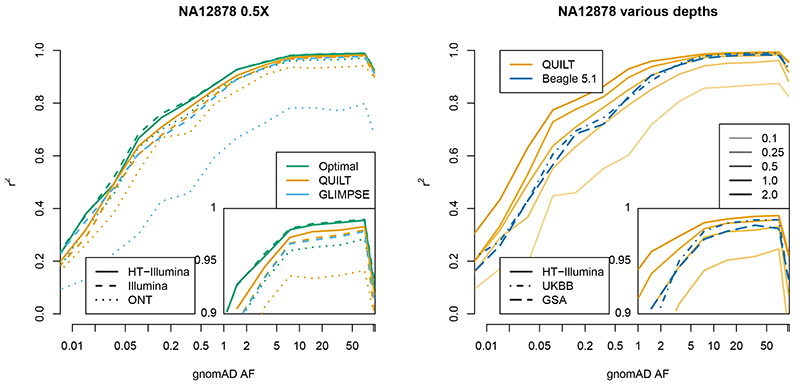
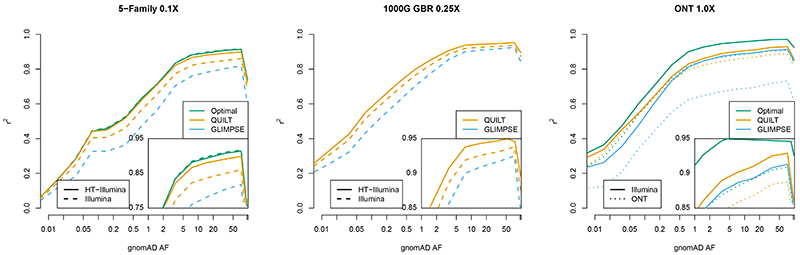
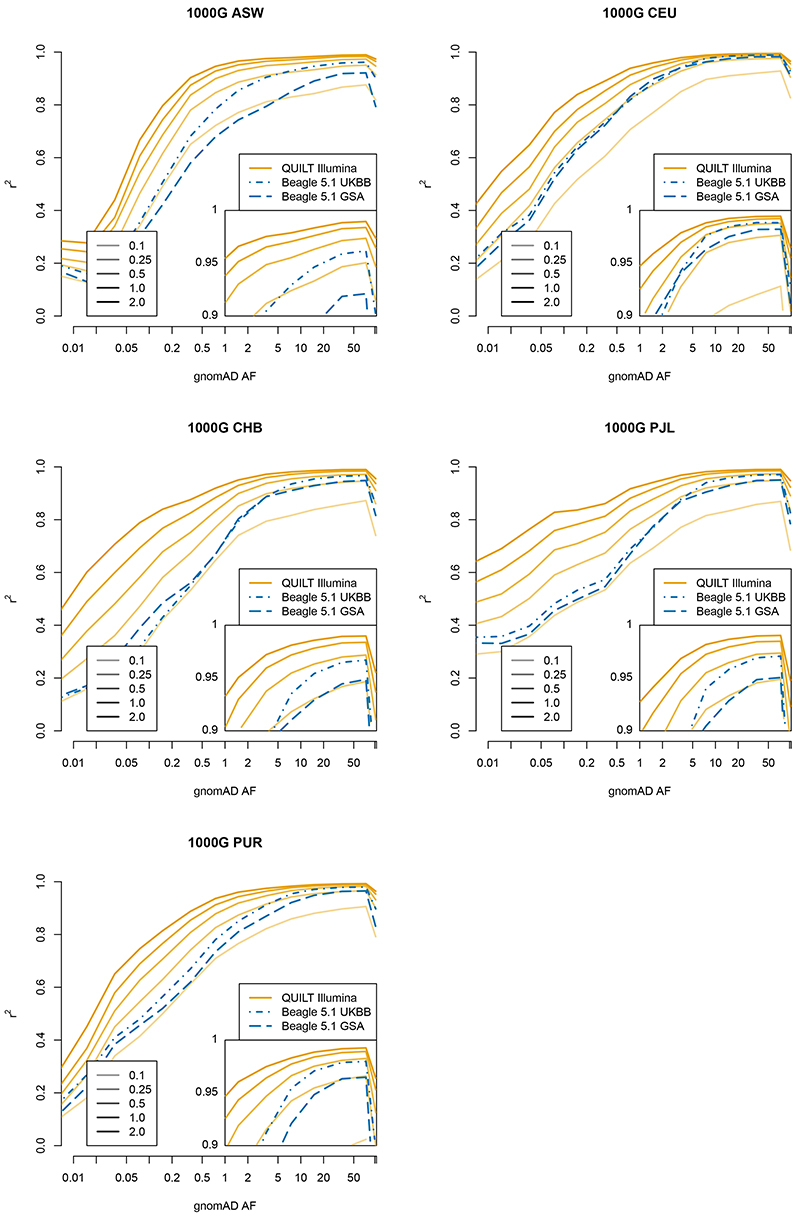
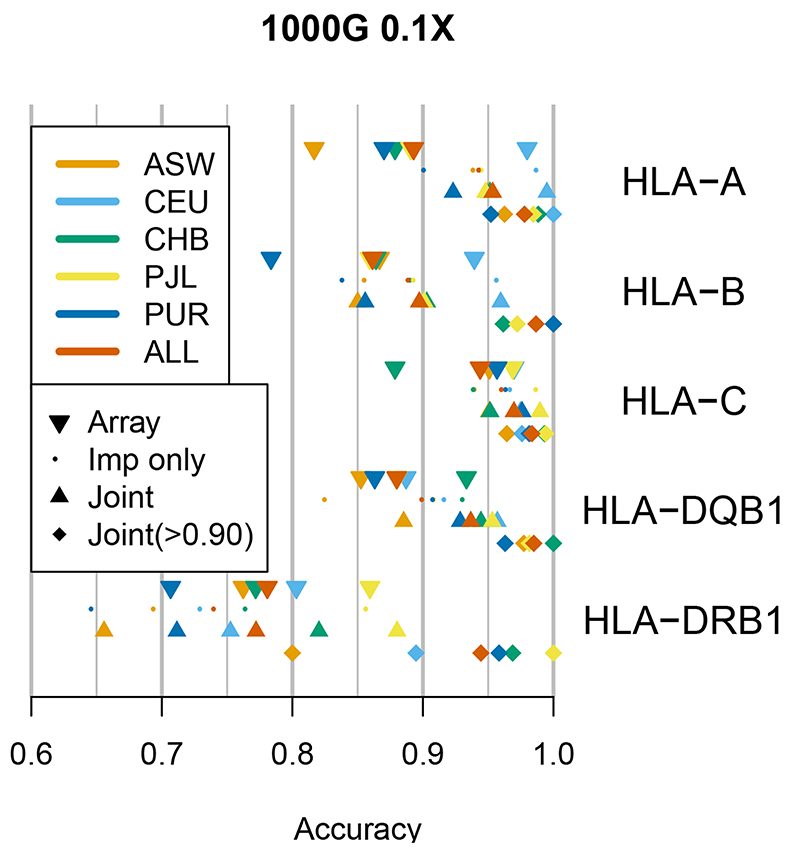
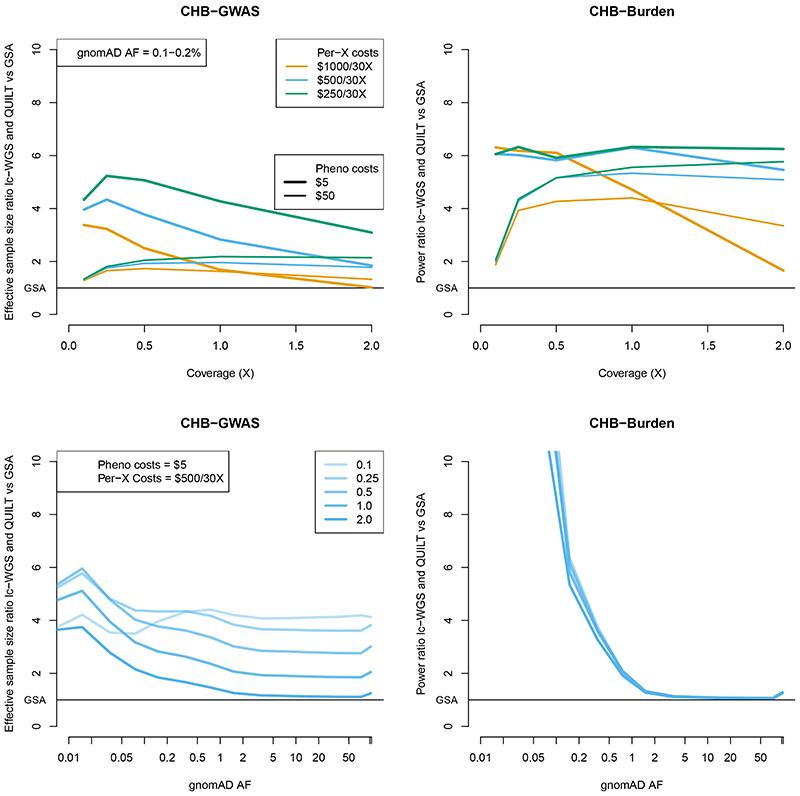
Inexpensive genotyping methods are essential to modern genomics. Here we present QUILT, which performs diploid genotype imputation using low-coverage whole-genome sequence data. QUILT employs Gibbs sampling to partition reads into maternal and paternal sets, facilitating rapid haploid imputation using large reference panels. We show this partitioning to be accurate over many megabases, enabling highly accurate imputation close to theoretical limits and outperforming existing methods. Moreover, QUILT can impute accurately using diverse technologies, including long reads from Oxford Nanopore Technologies, and a new form of low-cost barcoded Illumina sequencing called haplotagging, with the latter showing improved accuracy at low coverages. Relative to DNA genotyping microarrays, QUILT offers improved accuracy at reduced cost, particularly for diverse populations that are traditionally underserved in modern genomic analyses, with accuracy nearly doubling at rare SNPs. Finally, QUILT can accurately impute (four-digit) human leukocyte antigen types, the first such method from low-coverage sequence data.


Conflict of interest statement

Competing interests

M.K. and Y.F.C. declare competing financial interests in the form of patent and employment by the Max Planck Society. The remaining authors declare no competing interests.

Figures

Figure 1
Figure 1. Schematic of QUILT model.
Model shown for one Gibbs sampling. Model is initialized for a vector of read labels, and a subset of reference haplotypes. The QUILT model then iteratively proceeds between Gibbs sampling, to obtain new read labels given the current subset of reference haplotypes, and full haploid imputation, to obtain new reference haplotype subsets using the current read labels. QUILT completes after a pre-specified number of iterations. Genotype dosage is taken as an average across Gibbs samplings, while phase is taken from an additional Gibbs sampling using read labels taken as average across previous samplings.
Figure 2
Figure 2. Assessment of read label partitioning.
Per analysis, reads are grouped based on assignment to Hap1 or Hap2, with remaining y-axis variation being jitter. x-axis gives central location of read along 20 Mbp of chromosome 20. Reads are coloured blue and orange to reflect high posterior probability of coming from truth maternal or paternal chromosome, while grey indicates equally likely from either truth chromosome. Switches between runs of orange and blue denote probable switch errors. Columns denote effect of multiple iterations (left-most, for haplotagged 1.0X), different technologies (center, for 1.0X), and coverages (right-most, for haplotagged).
Figure 3
Figure 3. Imputation accuracy of NA12878 sample.
r2 per-bin is aggregated over SNPs with a given gnomAD allele frequency for a given technology, coverage and method.
Figure 4
Figure 4. Imputation accuracy of 5-Family, GBR and ONT samples.
r2 per-bin is aggregate over all SNPs in that gnomAD allele frequency bin across all samples, for a given technology, coverage and method.
Figure 5
Figure 5. Imputation accuracy of 1000 Genomes samples.
r2 per-bin is aggregate over all SNPs in that gnomAD allele frequency bin across all samples, for a given technology, coverage and method.
Figure 6
Figure 6. Imputation accuracy of HLA loci.
Accuracy is percent of correct unphased HLA alleles versus computationally inferred truth. Results are shown both per-population and in aggregate (ALL). Results are given both using only imputation (Imp only), as well as imputation plus direct read mapping (Joint, the default QUILT output). Results are further given at the subset of individuals with confidently inferred alleles (Joint(>0.90)). As reported elsewhere, HLA Class I loci (HLA-A, HLA-B and HLA-C) are less diverse than Class II loci (HLA-DRB1 and HLA-DQB1) and thus yield more accurate imputation results.
Figure 7
Figure 7. Relative increase in effective sample size and power using lc-WGS and QUILT.
Results are shown as a ratio of effective sample size for the GWAS setting, and a ratio of power for the burden test setting. Results use 1000 Genomes CHB imputation accuracy. Results for the top panel are given as a function of coverage, with variable phenotyping and per-X sequencing costs, for a fixed allele frequency (0.1-0.2%). Results for the bottom panel are given as a function of allele frequency, with varying coverage, assuming fixed phenotyping ($5 / sample) and per-X sequencing costs ($500 / 30X). All results assume a library preparation cost of 1.36 GBP /sample and an array cost of 30 GBP / sample.

References

    1. Pasaniuc B, Price AL. Dissecting the genetics of complex traits using summary association statistics. Nature Reviews Genetics. 2017;18:117–127. - PMC - PubMed
    1. Dudbridge F. Power and Predictive Accuracy of Polygenic Risk Scores. PLOS Genetics. 2013;9:e1003348. - PMC - PubMed
    1. Torkamani A, Wineinger NE, Topol EJ. The personal and clinical utility of polygenic risk scores. Nature Reviews Genetics. 2018;1 doi: 10.1038/s41576-018-0018-x. - DOI - PubMed
    1. Burton PR, et al. Genome-wide association study of 14,000 cases of seven common diseases and 3,000 shared controls. Nature. 2007;447:661–678. - PMC - PubMed
    1. Bycroft C, et al. The UK Biobank resource with deep phenotyping and genomic data. Nature. 2018;562:203. - PMC - PubMed

Publication types