. 2021 Oct;39(10):1246-1258.
doi: 10.1038/s41587-021-00927-2. Epub 2021 Jun 3.

Scalable, multimodal profiling of chromatin accessibility, gene expression and protein levels in single cells

Affiliations

Scalable, multimodal profiling of chromatin accessibility, gene expression and protein levels in single cells

Eleni P Mimitou et al. Nat Biotechnol. 2021 Oct.

Abstract

Recent technological advances have enabled massively parallel chromatin profiling with scATAC-seq (single-cell assay for transposase accessible chromatin by sequencing). Here we present ATAC with select antigen profiling by sequencing (ASAP-seq), a tool to simultaneously profile accessible chromatin and protein levels. Our approach pairs sparse scATAC-seq data with robust detection of hundreds of cell surface and intracellular protein markers and optional capture of mitochondrial DNA for clonal tracking, capturing three distinct modalities in single cells. ASAP-seq uses a bridging approach that repurposes antibody:oligonucleotide conjugates designed for existing technologies that pair protein measurements with single-cell RNA sequencing. Together with DOGMA-seq, an adaptation of CITE-seq (cellular indexing of transcriptomes and epitopes by sequencing) for measuring gene activity across the central dogma of gene regulation, we demonstrate the utility of systematic multi-omic profiling by revealing coordinated and distinct changes in chromatin, RNA and surface proteins during native hematopoietic differentiation and peripheral blood mononuclear cell stimulation and as a combinatorial decoder and reporter of multiplexed perturbations in primary T cells.


Conflict of interest statement

COMPETING INTERESTS

C.A.L., L.S.L., V.G.S., and A.R. are listed as co-inventors on a patent related to mtscATAC-seq (US provisional patent application 62/683,502). In the past three years, RS has worked as a consultant for Bristol-Myers Squibb, Regeneron, and Kallyope, and served as an SAB member for Immunai and Resolve BioSciences. A.R. is a founder and equity holder of Celsius Therapeutics, an equity holder in Immunitas Therapeutics and until August 31, 2020 was an SAB member of Syros Pharmaceuticals, Neogene Therapeutics, Asimov and ThermoFisher Scientific. From August 1, 2020, A.R. is an employee of Genentech. P.S. is listed as co-inventor on a patent related to this work (US provisional patent application 62/515-180).

Figures
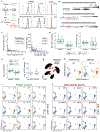
Extended Data Figure 1.
Extended Data Figure 1.. Additional technical and computational validation of ASAP-seq workflows.
a. PBMCs and compensation beads were stained with fluorophore-conjugated antibodies and subjected to the ASAP-seq workflow with samples withdrawn at the indicated steps and assessed for fluorophore intensity by flow cytometry. CD19 (staining B cells), CD11c (dendritic cells) and CD4 (lymphocytes and monocytes) signal on fixed cells is hardly affected by permeabilization alone, but after the 37°C incubation for 1h to mimic the Tn5 transposition reaction, some signal reduction is observed. b. Barcoding scheme of TSA tags using the bridge oligo for TotalSeq™-A (BOA). TSA tags do not contain UMIs, so to allow molecule counting, UBIs (N9V) are incorporated via the bridge oligo. c. Species mixing experiment as in Fig. 1c, using the Post-SPRI approach for tag recovery. Points are colored based on species classification using ATAC fragments. d. ATAC library complexity and TSS enrichment for fragments from each species under the two protein-tag library approaches. e. Comparison of protein tag complexity between libraries prepared using the pre- and post-SPRI approach. f. Comparison of ATAC library complexity between mtscATAC-seq and ASAP-seq. g. Two-dimensional embedding of the PBMC hashing data using t-SNE. The four major clusters (black) correspond to the four hashing antibodies used to stain the PBMCs. 13,772 cells were recovered and1,396 doublets (red) were detected. h. UMAP embedding resolving PBMC cell types based on chromatin accessibility for cells processed by mtscATAC-seq and ASAP-seq. Data for the two different samples were processed together using cell ranger-atac aggr before dimensionality reduction. i,j. Selected protein markers (i) and corresponding gene score activities (j) superimposed on the ATAC-clustered PBMCs (for the ASAP-seq sample) as in (h).
Extended Data Figure 2.
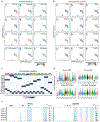
Extended Data Figure 2.. Additional validation and comparison of modular ASAP-seq workflows.
a. Barcoding scheme of TSB tags using the bridge oligo for TotalSeqB (BOB). TSB tags contain UMIs (encompassing the antibody barcode), negating the requirement for a UBI on the bridge oligo. b. Pairwise comparison of centered log-ratio (CLR) normalized TSA and TSB counts under OMNI lysis conditions (n=5,236 cells). Counts were collapsed for unique molecules using UBIs (TSA panel) or UMIs (TSB panel). c. Comparison of CLR normalised TSB counts under the two lysis conditions. Statistical comparisons are Wilcoxon rank sum test with Bonferroni adjusted p-values (ns = not significant; *padj < 0.05; ** padj < 0.01; *** padj < 0.001). d. UMAP embedding and cluster annotation of the LLL (n=5,236) and OMNI (n=4,748) processed cells. Data for the two different samples were processed together using cell ranger-atac aggr before dimensionality reduction. e. TSA and TSB CLR counts projected on the LLL embeddings. f. TSA and TSB CLR counts projected on the OMNI embeddings.
Extended Data Figure 3.
Extended Data Figure 3.. Supporting information for ASAP-seq bone marrow analyses.
a. Annotation of reduced dimension space with the Doublet Enrichment score from ArchR. Arrow indicates the monocytic progenitor population. b. Histogram of scores from panel (a). c. Feature plots for six additional antibody tags in the reduced dimension space. d. Correlation heatmap between 25 most variable TF activities and surface markers. e. Percent of cells in each ArchR cluster (y axis) mapping to the indicated Seurat cluster (x axis) after label transferring using the protein tags only f. Substitution rate (observed over expected) of mgatk-identified heteroplasmic mutations (y axis) in each class of mononucleotide and trinucleotide change resolved by the heavy (H) and light (L) strands of the mitochondrial genome. g. Projection of 13711G>A in single cells; threshold for + was 5% heteroplasmy. h. Distribution of observed mtDNA mutations in cells among major cell lineages. i. Association of antibody tag abundance to cell clones determined by mtDNA genotypes, highlighting the erythroid marker CD71. j. Developmental trajectory of erythroid differentiation using semi-supervised pseudotime analysis. k. Expression of select cell surface markers along the erythroid developmental trajectory highlighted in (j). Rows are min-max normalized. l. Expression of chromatin activity scores along the monocytic developmental trajectory for genes encoding proteins shown in Fig. 3h. m. Expression of chromatin activity scores along the erythroid developmental trajectory for genes encoding proteins shown in (j).
Extended Data Figure 4.
Extended Data Figure 4.. Supporting information for combined ASAP-seq and CITE-seq readouts.
a. Antibody tag complexity per condition and technology. Median tag complexity is 1.7-2x higher in CITE-seq compared to ASAP-seq and 1.3-1.6x higher in stimulation compared to control sample. The lower panels show the per-cluster mean tag abundance for the 50 most variable antibodies and corresponding Pearson correlations. b,c. Cellular distribution of protein tags measured by ASAP-seq (left) and CITE-seq (right) for control (top) and stimulated conditions (bottom) for, (b) CD278 (ICOS) and (c) CD71 (TFRC). d. Protein tag measurement importance in predicting cell cluster and stimulation from two different Random Forest models. Negative controls (rat epitopes) are shown in red. e-g. ASAP-seq and CITE-seq data co-embedding utilizing protein abundances. Cells are highlighted by (e) chromatin/RNA cluster identity, (f) stimulation condition and (g) technology assayed. h-j. UMAPs of chromatin accessibility, mRNA expression, and surface protein levels for (h) CD28, (i) CD4, and (j) CD52. k. Summary of changes in chromatin accessibility, gene expression and surface protein abundance for 103 expressed genes in B cells following T cell stimulation. l,m. UMAPs of chromatin accessibility, mRNA expression, and surface protein levels for genes with differential expression in B cells, including (l) CD184 (CXCR4) and (m) CD25 (IL2RA).
Extended Data Figure 5.
Extended Data Figure 5.. Supporting information for DOGMA-seq.
a-e. QC metrics of indicated modalities captured by DOGMA-seq applied on the stimulated PBMC sample. (a) TSS score, (b) ATAC fragment complexity, (c) % mtDNA content, (d) number of genes/cell and (e) protein tag complexity in the two different cell preparations compare similarly to the control PBMC sample in Fig. 5b–f. f. Percent of UMIs detected in the GEX library that map to mtRNA is higher in the digitonin-treated cells. g-h. Percent of UMIs mapping to exons is higher in the digitonin-treated (DIG) compared to LLL-treated cells (g), but similar when mitochondrial transcripts are excluded (h). i. CD138 tag counts projected on the three modality WNN stimulation clusters. j. Gene activity scores, transcript and protein tag counts projected for the indicated markers on the control and stimulated 3WNN clusters. k. Heatmaps showing percent overlap between clusters detected by 3WNN compared to 2WNN variations applied on the control PBMC dataset. l. Mean coverage along the mtDNA genome in control and stimulated PBMCs. m. Substitution rate (observed over expected) of mgatk-identified heteroplasmic mutations (y axis) in each class of mononucleotide and trinucleotide change resolved by the heavy (H) and light (L) strands of the mitochondrial genome for all cells in the PBMC-LLL condition. n. Observed (red) and permuted (gray) log2 heteroplasmy changes across the 106 identified variants. Statistical test: Kolmogorov–Smirnov Test. o. 3WNN UMAP embedding of control and stimulated PBMC samples under LLL and DIG processing. Dashed box indicates activated T-cell clusters. p. Comparison of peak to gene linkage for genes detected in both protein and RNA modalities. Each dot is a peak to gene link with the z score representing the magnitude of the association.
Extended Data Figure 6.
Extended Data Figure 6.. Supporting information for ASAP-seq based decoding of perturbations in primary T cells.
a. Schematic for CRISPR perturbation experiment in primary human T cells. CD4+ T cells from healthy donors were isolated and stimulated for 72 hours, followed by a resting period of four days to enable expansion. On Day 7, cells were electroporated with Cas9 RNPs and then rested for an additional 8 days before secondary stimulation. b. Heatmap of cell demultiplexing with hashing antibodies, indicating normalized abundance of each hashtag. c. Assessment of the effect of CRISPR perturbations on three indicated protein surface markers. d. UMAP embedding overlaid with expression of the eight indicated surface protein markers. e. Allele-specific CRISPR editing outcomes for ZAP70 gRNA1 (left) and ZAP70 gRNA2 (right). The wildtype allele is indicated by **. f. Volcano plots showing transcription factor motifs with significantly changed chromatin accessibility profiles between NTC cells and the indicated gRNAs (FDR <= 0.05, chromVAR accessibility change >= 0.25). g. Correlation of chromVAR median accessibility changes or FDR (bottom right panel) between the indicated gRNAs. h. Genomic tracks of TNFRSF18 and HAVCR2 loci with corresponding CLR-normalized protein abundance ridge plots. CLR-normalized protein abundance from the PBMC stimulation experiment is indicated by the corresponding boxplots. Differentially accessible regions are highlighted in blue.
Extended Data Figure 7.
Extended Data Figure 7.. Supporting information for intracellular ASAP-seq workflow.
a,b. Selected protein markers (a) and corresponding gene activity scores (b) superimposed on the ATAC-clustered PBMCs from the intracellular staining experiment (see Fig. 3a). c. Heatmap of cell demultiplexing with hashing antibodies, indicating normalized abundance of each hashtag for 24 different perturbation conditions. d. Violin plots showing distribution of CLR normalized protein counts for indicated proteins and their associated gRNA. e. Genomic tracks of IFNG and GZMB loci, indicating pseudo-bulk ATAC signal tracks across six Louvain clusters with corresponding log-normalized gene activity score violin plots shown to the right. Differentially accessible regions are highlighted in blue.
Figure 1.
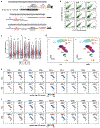
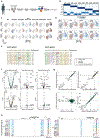
Figure 1.. ASAP-seq incorporates protein detection in scATAC-seq workflows.
a. Schematic of the cell-processing steps that allow retention and profiling of cell-surface markers jointly with chromatin accessibility. Cells are stained with oligo-conjugated antibodies before fixation, permeabilization and transposition with Tn5. b. In droplets, bridge oligos spiked into the barcoding mix promote templated extension of the antibody tags during the first cycle of amplification rendering them complementary to bead-derived barcoding oligos. Extended antibody tags are subsequently barcoded together with the transposed chromatin fragments. c. Species mixing experiment using the Pre-SPRI approach; number of unique nuclear fragments (left) and protein-tag counts (right) associated with each cell barcode. Points are colored based on species classification using ATAC-derived fragments (97.4% agreement by assignment; all but 1 discrepancy was an errant doublet versus singlet classification) d. TSS enrichment scores of mtscATAC-seq without (left) or with concomitant protein tag capture (right). n indicates the number of cells profiled. e. UMAP showing chromatin accessibility-based clustering of PBMCs stained with a 9-antibody panel, with selected markers highlighted. Color bar: protein tag centered log-ratio (CLR) values. f. Cellular distribution of two most commonly detected mtDNA mutations in the population. Thresholds for + were 5% heteroplasmy based on empirical density.
Figure 2.
Figure 2.. ASAP-seq enables a modular and versatile multi-omics toolkit.
a. Schematic of experimental design. PBMCs were stained with TBNK panels of the TSA or TSB format at a 1:1 ratio, followed by fixation and permeabilization under mild (LLL) or strong conditions (OMNI). b. Pairwise comparison of centered log-ratio (CLR) normalized TSA and TSB counts for indicated antibodies under mild lysis conditions (n=4,748 cells). Counts were collapsed for unique molecules using UBIs (TSA panel) or UMIs (TSB panel). c. Distribution of percent of mtDNA fragments retained in the library under the two lysis conditions. d. Comparison of CLR normalized TSA counts for indicated proteins under the two tested lysis conditions. Statistical comparisons are Wilcoxon rank sum test with Bonferroni adjusted p-values (ns = not significant; *padj < 0.05; ** Padj < 0.01; *** Padj < 0.001).
Figure 3.
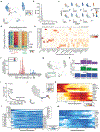
Figure 3.. Dissection of native human hematopoiesis with multi-modal cell state inference and mtDNA-based lineage tracing.
a. Schematic of experimental design. Whole human bone marrow mononuclear cells (BMMCs) were stained with hashtag antibodies and a 242 antibody panel for ASAP-seq processing. b. Reduced dimension representation and cell clustering of high-quality cells (n=10,928) inferred using chromatin accessibility. c. Rank sorting of informative protein tags in distinguishing cell cluster identification. Negative controls (rat epitopes) are shown in red. d. Characterization of cell populations for 6 selected markers. e. Characterization of 99 somatic mtDNA mutations identified in the BMMCs. Selected mutations enriched for lineage bias (13069G>A and 13711G>A; x-axis; see Extended Data Fig. 3e) and highest for allele frequency (16260C>T; y-axis) are highlighted. f. Projection of highlighted mutations from (e) on the reduced dimension space. Thresholds for + were 50% for 16260C>T and 5% for 13069G>A based on empirical density. g. Developmental trajectory of monocyte differentiation using semi-supervised pseudotime analysis. h. Expression of cell surface markers along the developmental trajectory highlighted in (g). Rows are min-max normalized. i. Comparison of maximum gene activity scores (x-axis) and protein (y-axis) during pseudotime. Each dot is a gene/surface protein pair.
Figure 4.
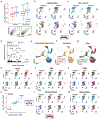
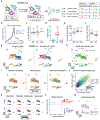
Figure 4.. ASAP-seq and CITE-seq reveal coordinated and distinct changes in chromatin, RNA, and protein levels.
a. Schematic of the experimental design. PBMCs were incubated with (stimulation) or without (control) multimeric α-CD3/CD28 for 16 hrs, followed by staining with the 227 antibody panel. An aliquot of the cells was withdrawn and subjected to CITE-seq, while the remaining cells were fixed and subjected to ASAP-seq. b,c. Reduced dimension representations using data integration methods and UMAP for (b) ASAP-seq and (c) CITE-seq for both control (left) and stimulated conditions (right). d. Correlation of surface marker fold changes (log2) upon stimulation as detected by CITE-seq and ASAP-seq. Top upregulated markers are highlighted in red, and downregulated in blue. e. Schematic and summary of number and proportion of differential features (chromatin accessibility peaks, genes, and surface proteins) detected for T cells between the stimulation and control. f. Summary of changes in chromatin accessibility, gene expression and surface protein abundance for 84 expressed genes during T cell stimulation. g. Pearson correlation between the log2 fold changes for each modality as shown in (f). h-j. UMAPs of single-cell chromatin accessibility, mRNA expression, and surface protein levels for both the control (top) and stimulation condition (bottom) shown on the reduced dimension space for (h) CD3, (i) CD69 and (j) PD-1.
Figure 5.
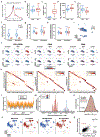
Figure 5.. DOGMA-seq enables a high-quality capture of multiple modalities sensitive to biological changes.
a. Schematic of the workflow and the modality capture enabled by DOGMA-seq. b. TSS enrichment scores of DOGMA-seq variations on the control PBMC data compared to a PBMC Multiome dataset released by 10x. c-f. Additional QC metric comparisons for the indicated conditions: (c) ATAC fragment complexity, (d) % mtDNA in ATAC library, (e) number of genes/cell detected and (f) protein tag complexity across the different cell preparations; median values are indicated. g. 3WNN UMAP embedding of control and stimulated PBMCs under the LLL condition. Box indicates the activated T-cell clusters. h. Control PBMC clusters labeled after projection into the Azimuth reference. i. 3WNN UMAPs of stimulated PBMCs highlighting the weight of each modality. j. Stimulation module score for each of the three modalities quantified in stimulated T cells. Each dot is a single cell with the stimulation score for each modality. Per-pair Pearson correlation of the data shown is reported. k. 3WNN UMAPs of control and stimulated PBMCs highlighting chromatin accessibility, mRNA expression, and surface protein levels for CD45 and isoforms CD45RA and CD45RO. l. Identification of high-confidence heteroplasmic (red; n=106) and homoplasmic (black; n=43) variants using mgatk. m. Cellular distribution of m.10761T>C in the 3WNN for all cells; the arrow points to a subset of gamma/delta (γ/δ) and MAIT cells. Threshold for + was 10% heteroplasmy based on empirical density.
Figure 6.
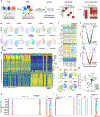
Figure 6.. Multiplexed CRISPR perturbations with ASAP-seq in primary human T cells.
a. Schematic workflow for combinatorial multiplexing with ASAP-seq. CRISPR-edited cells are first stained with oligo-conjugated hashtag antibodies and then pooled for downstream processing by ASAP-seq. gRNA identities are demultiplexed using hashing antibody counts. b. UMAP embedding of n = 5,825 single cells and their associated gRNAs. c. Heatmap showing mean expression for 27 selected surface protein markers across gRNA perturbations in stimulated cells. d. Heatmap representation of chromVAR bias-corrected transcription factor motif deviation scores for the top 100 most variable transcription factors across perturbation conditions. Associated gRNA and donor information are color-coded and indicated at the top of the plot. e. Overlay on ASAP-Seq UMAP of chromVAR transcription factor motif deviations. The motif for the given transcription factor is indicated at the top of the plot. f. Volcano plots showing transcription factor motifs with significantly changed chromatin accessibility profiles between NTC cells and guides targeting CD3E and ZAP70 (FDR <= 0.05, chromVAR accessibility change >= 0.25). g. Scatterplot of mean gene activity scores for 22 individual gene loci plotted against CLR-normalized mean protein tag counts associated with each gRNA. Values are normalized against NTC cells. h,i. Genomic tracks of (h) PDCD1 (gene encoding PD-1) and (i) IL2RA (gene encoding CD25), indicating pseudo-bulk ATAC signal tracks across gRNAs with corresponding CLR-normalized protein abundance ridge plots. Differentially accessible regions are highlighted in red. Differentially accessible regions not overlapping CARE enhancers are highlighted in blue (i) and the TSS is highlighted in green (i). NFKB2 sequence motif matches are indicated by *.
Figure 7.
Figure 7.. ASAP-seq enables detection of intracellular proteins with barcoded antibodies.
a. Schematic of the intracellular staining experimental design. PBMCs stained with the TSA TBNK panel directed against cell surface markers were fixed, lysed, and stained with TSB antibodies directed against intracellular markers, followed by transposition. b. Two-dimensional embedding of the PBMC chromatin accessibility data using UMAP, with major peripheral blood cell types highlighted. c,d. T cells and NK cells as highlighted in the dashed-line box from panel (b) with superimposed tag intensities for indicated (c) cell surface and (d) intracellular markers. Color bar: protein tag CLR values. e. UMAP embedding of n = 15,395 single cells targeted with distinct gRNAs. Colors indicate cluster identity (labeled on the bottom). The proportion of gRNA-targeted cells in each cluster are shown on the right. f. Violin plots showing the distribution of CLR normalized protein counts for indicated proteins and their associated gRNA. g. UMAP embedding overlaid with expression of two surface (top) and two intracellular (bottom) protein markers. Color bar: protein tag CLR values. h. Violin plot showing CLR normalized protein counts for indicated proteins across the six Louvain clusters.

Comment in

References

    1. Nam AS, Chaligne R & Landau DA Integrating genetic and non-genetic determinants of cancer evolution by single-cell multi-omics. Nat. Rev. Genet (2020) - PMC - PubMed
    1. Zhu C, Preissl S & Ren B Single-cell multimodal omics: the power of many. Nat. Methods 17, 11–14 (2020). - PubMed
    1. Schier AF Single-cell biology: beyond the sum of its parts. Nat. Methods 17, 17–20 (2020). - PubMed
    1. Stuart T & Satija R Integrative single-cell analysis. Nat. Rev. Genet 20, 257–272 (2019). - PubMed
    1. Stoeckius M et al. Simultaneous epitope and transcriptome measurement in single cells. Nat. Methods 14, 865–868 (2017). - PMC - PubMed

Publication types