. 2021 Sep;17(9):964-974.
doi: 10.1038/s41589-021-00800-y. Epub 2021 Jun 3.

Differential regulation of single microtubules and bundles by a three-protein module

Affiliations

Differential regulation of single microtubules and bundles by a three-protein module

Nandini Mani et al. Nat Chem Biol. 2021 Sep.

Abstract

A remarkable feature of the microtubule cytoskeleton is the coexistence of subpopulations having different dynamic properties. A prominent example is the anaphase spindle, where stable antiparallel bundles exist alongside dynamic microtubules and provide spatial cues for cytokinesis. How are the dynamics of spatially proximal arrays differentially regulated? We reconstitute a minimal system of three midzone proteins: microtubule-crosslinker PRC1 and its interactors CLASP1 and Kif4A, proteins that promote and suppress microtubule elongation, respectively. We find that their collective activity promotes elongation of single microtubules while simultaneously stalling polymerization of crosslinked bundles. This differentiation arises from (1) strong rescue activity of CLASP1, which overcomes the weaker effects of Kif4A on single microtubules, and (2) lower microtubule- and PRC1-binding affinity of CLASP1, which permits the dominance of Kif4A at overlaps. In addition to canonical mechanisms where antagonistic regulators set microtubule length, our findings illuminate design principles by which collective regulator activity creates microenvironments of arrays with distinct dynamic properties.


Figures

Extended Data Fig. 1
Extended Data Fig. 1. Related to Fig. 1
a. Domain diagram of CLASP1 constructs used in this study (top), along with SDS-PAGE gel of all purified proteins used in this study (bottom). SR-rich: Serine Arginine rich, CLIP-ID: CLIP-Interacting Domain, M: molecular weight marker, with corresponding masses in kDa on the side. b. SEC-MALS profiles showing elution volumes of CLASP1 constructs from a Superose-6 column, and their corresponding molecular weights in solution. Mean and standard deviation of calculated Molecular weight (expected weight of monomer): CLASP1(1-654)-GFP (black) 108.8 ± 0.8 kDa (101.5 kDa); CLASP1(805-1471)-GFP (red) 107.6 ± 10.8 kDa (102.2 kDa); CLASP1(654-1471)-GFP (blue):128.7 ± 0.3 kDa (120 kDa). c. Auto-correlation function for apex of eluting peak of CLASP1(805-1471)-GFP shown in (b), obtained through dynamic light scattering studies. Calculated hydrodynamic radius, Rh= 5.49 ± 0.12 nm.
Extended Data Fig. 2
Extended Data Fig. 2. Related to Fig. 1
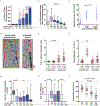
n = number of kymographs analyzed from 3 independent experiments, except where indicated. P values were calculated from an ordinary one-way ANOVA test with Dunnett correction for multiple comparisons. a. Scatter plot with bar graph showing mean of fraction of time microtubules are stalled. Error bars indicate standard deviation. Assay conditions: tubulin control (0.0 ± 0.1, n = 59), 200 nM CLASP1 (0.0 ± 0.0, n = 67), 200 nM CLASP1 + 125 nM Kif4A (0.3 ± 0.3, n = 67), 200 nM CLASP1 + 250 nM Kif4A (0.4 ± 0.3, n = 73), 200 nM CLASP1 + 1000 nM Kif4A (0.6 ± 0.4, n = 73) and 1000 nM Kif4A (0.9 ± 0.1, n = 39). b. Box and whisker plot of average length of microtubule before catastrophe. Plus-sign indicates mean. Horizontal lines within box indicate the 25th, median (center line) and 75th percentile. Error bars indicate minimum and maximum range. Mean and standard deviation for assay conditions: Tubulin control (3.0 ± 2.4 μm, n = 241), 200 nM CLASP1 (6.1 ± 3.2 μm, n = 150), 200 nM CLASP1 + 125 nM Kif4A (4.0 ± 1.9 μm, n = 82), 200 nM CLASP1 + 250 nM Kif4A (3.2 ± 1.8 μm, n = 107), 200 nM CLASP1 + 1000 nM Kif4A (1.7 ± 1.0 μm, n = 152) and 1000 nM Kif4A (0.9 ± 0.6 μm, n = 24). P < <0.0001 for 1000 nM Kif4A compared to tubulin control. c. Scatter plot of Kif4A-GFP intensity per pixel on taxol-stabilized microtubules in the presence of 150 μM ATP (n = number of microtubules analyzed from 2 independent experiments). Concentrations refer to monomeric Kif4A. Mean and standard deviation of intensity for assay conditions with Kif4A-GFP: 20 nM (504.2 ± 395.8, n=54), 100 nM (2556 ± 1182, n=69), 400 nM (7823 ± 1961, n=68), 1000 nM (8276 ± 3386, n=69). d. Representative kymographs generated from single molecule TIRF experiments of 1 nM CLASP1-GFP on dynamic microtubules (left, 25 kymographs examined) and 12 nM Kif4A-GFP (right, 34 kymographs analyzed), showing GFP channels. Scale bars: x= 2 μm and y=15 s. Schematic indicates position and polarity of microtubule at the start of imaging. Red lines on kymographs indicate the position of the microtubule as deduced from the X-rhodamine channel. e. Scatter plot of tip to lattice GFP intensity ratio. Horizontal line indicates the mean. Error bars indicate standard deviation. Tip to lattice intensity ratios for 1 nM CLASP1-GFP (1.01 ± 0.04; n =25); 10 nM CLASP1-GFP (0.99 ± 0.12; n =17); 4 nM Kif4A-GFP (1.36 ± 0.36; n =33); 12 nM Kif4A-GFP (1.71 ± 0.66; n =34). P = 0.0066 for 1 nM CLASP1 compared to 4 nM Kif4A. f. Scatter plot of the total GFP intensity. Horizontal line indicates the mean. Error bars indicate standard deviation. Total intensity values for 1 nM CLASP1-GFP (0.41 x 10⁶±0.18 x 10⁶; n = 25); 10 nM CLASP1-GFP (1.58 x 10⁶±0.44 x 10⁶; n = 17); 4 nM Kif4A-GFP (0.43 x 10⁶±0.26 x 10⁶; n=33); 12 nM Kif4A-GFP (0.67 x 10⁶±0.35 x 10⁶; n =34). P is not significant for for 1 nM CLASP1 compared to 4 nM Kif4A. g. Box and whisker plot of average number of catastrophes in 20 minutes. Plus-sign indicates mean. Horizontal lines within box indicate the 25th, median (center line) and 75th percentile. Error bars indicate minimum and maximum range. Mean and standard deviation for assay conditions: tubulin control (5.1 ± 2.2, n = 65), 200 nM CLASP1 (1.9 ± 1.6, n = 76), 200 nM CLASP1 + 125 nM Kif4A (1.5 ± 1.5, n = 69), 200 nM CLASP1 + 250 nM Kif4A (1.8 ± 1.7, n = 73), 200 nM CLASP1 + 1000 nM Kif4A (2.3 ± 2.5, n = 73) and 1000 nM Kif4A (1.6 ± 3.2, n = 38). P < 0.0001 for (i) tubulin control to 200 nM CLASP1. P is not significant (> 0.05) for 200 nM CLASP1 to (i) 200 nM CLASP1 + 125 nM Kif4A, (ii) 200 nM CLASP1 + 250 nM Kif4A, (iii) 200 nM CLASP1 + 1000 nM Kif4A and to (iv) 1000 nM Kif4A. h. Box and whisker plot of average number of rescues in 20 minutes. Plus-sign indicates mean. Horizontal lines within box indicate the 25th, median (center line) and 75th percentile. Error bars indicate minimum and maximum range. Mean and standard deviation for assay conditions: tubulin control (0.1 ± 0.4, n = 60), 200 nM CLASP1 (2.0 ± 1.5, n = 67), 200 nM CLASP1 + 125 nM Kif4A (1.4 ± 1.5, n = 67), 200 nM CLASP1 + 250 nM Kif4A (1.4 ± 1.5, n = 73), 200 nM CLASP1 + 1000 nM Kif4A (0.9 ± 1.3, n = 73) and 1000 nM Kif4A (0.0 ± 0.0, n = 37). P < 0.0001 for tubulin control to 200 nM CLASP1 and P = 0.0025 for 200 nM CLASP1 + 1000 nM Kif4A to 1000 nM Kif4A. i. Scatter plot of CLASP1-GFP fluorescence intensity per pixel on single microtubules in the presence of CLASP1-GFP and Kif4A at indicated concentrations. Red bars indicate mean (center line) and standard error of mean. Mean and standard deviation of intensity per pixel for assay conditions: 200 nM CLASP1 (25.9 ± 4.6, n = 59), 200 nM CLASP1 + 125 nM Kif4A (23.0 ± 6.5, n = 59), 200 nM CLASP1 + 250 nM Kif4A (18.4 ± 6.3, n = 60) and 200 nM CLASP1 + 1000 nM Kif4A (12.8 ± 6.3, n = 59). P values < 0.0001 for 200 nM CLASP1 when compared to (i) 200 nM CLASP1 + 250 nM Kif4A and (ii) 200 nM CLASP1 and 1000 nM Kif4A. n is number of microtubules analyzed from 3 independent experiments.
Extended Data Fig. 3
Extended Data Fig. 3. Related to Fig. 2
a. Schematics and montages of representative microtubule bundles (red) grown from microtubule seeds (blue) in the presence of 5 nM Kif4A and 0.5 nM PRC1. A total of 20 events were examined. Schematics indicate the plus end (+) of the microtubules within the bundle. Velocity arrow indicates direction of microtubule sliding. X-Rh MT: X-Rhodamine microtubules. Scale bar represents 2 μm. b & c. Representative image of single microtubule (left) and cross-linked microtubule (right), showing HiLyte 647 (top), X-Rhodamine (middle) and merged (bottom) channels at the start (T=0) and end (T=20 min) of dynamic bundle assay. Scale bars represent 2 μm. The schematics below the montages indicate the positions of the seed (blue), microtubules (red) at the start and end of the experiment. Assay conditions are (b) 0.5 nM PRC1 + 200 nM CLASP1-GFP (Events examined: 47 single and 29 overlaps), and (c) 0.5 nM PRC1 + 200 nM CLASP1-GFP + 10 nM Kif4A (Events examined: 42 single and 49 overlaps).
Extended Data Fig. 4
Extended Data Fig. 4. Related to Fig. 3
a. Summary of dynamics of PRC1 cross-linked microtubules, showing percentage of microtubules exhibiting dynamic instability, no growth or only growth in black. For all kymographs, the total number of events, percentage of events that are complete catastrophes and rescues in the presence of CLASP1-GFP, PRC1 and Kif4A at varying concentrations are shown in blue. b & c. Schematics and representative montages of microtubule bundles (red) grown from microtubule seeds (blue). Schematics indicate the plus end of the microtubules within the bundle. Velocity arrow indicates direction of microtubule sliding. Dotted gray lines indicate regions of overlap. X-Rh MT: X-Rhodamine microtubules. Scale bar represents 2 μm. Assay conditions and number of events (n) examined across 3 independent experiments are (b) 200 nM CLASP1-GFP + 0.5 nM PRC1 + 125 nM Kif4A (n=30) and (c) 200 nM CLASP1-GFP + 0.5 nM PRC1 + 50 nM Kif4A (n=39).
Extended Data Fig. 5
Extended Data Fig. 5. Related to Fig. 4
n = number of kymographs of cross-linked microtubules analyzed a. Box and whisker plot of average microtubule length before catastrophe of cross-linked microtubules. Plus-sign indicates mean. Horizontal lines within box indicate the 25th, median (center line) and 75th percentile. Error bars indicate minimum and maximum range. Mean and standard deviation for assay conditions: 200 nM CLASP1 + 0.5 nM PRC1 + 125 nM Kif4A (0.0 ± 0.0 μm, n = 30), 200 nM CLASP1 + 0.5 nM PRC1 + 50 nM Kif4A (0.4 ± 1.0 μm, n = 39), 200 nM CLASP1 + 0.5 nM PRC1 + 10 nM Kif4A (0.3 ± 0.7 μm, n = 36), 200 nM CLASP1 + 0.5 nM PRC1 + 5 nM Kif4A (3.9 ± 1.9 μm, n = 28), 200 nM + 0.5 nM PRC1 (9.1 ± 3.6 μm, n = 53), 20 nM CLASP1 + 0.5 nM PRC1 + 5 nM Kif4A (1.5 ± 0.9 μm, n = 55) and 0.5 nM PRC1 + 5 nM Kif4A (0.9 ± 0.4 μm, n = 37). c. Box and whisker plot of average number of rescues in 20 minutes for cross-linked microtubules. Plus-sign indicates mean. Horizontal lines within box indicate the 25th, median (center line) and 75th percentile. Error bars indicate minimum and maximum range. Mean and standard deviation for assay conditions 200 nM CLASP1 + 0.5 nM PRC1 + 125 nM Kif4A (Not Determined, n = 30), 200 nM CLASP1 + 0.5 nM PRC1 + 50 nM Kif4A (Not Determined, n = 39), 200 nM CLASP1 + 0.5 nM PRC1 + 10 nM Kif4A (Not Determined, n = 36), 200 nM CLASP1 + 0.5 nM PRC1 + 5 nM Kif4A (0.7 ± 1.2, n = 37), 200 nM + 0.5 nM PRC1 (1.6 ± 1.5, n = 33), 20 nM CLASP1 + 0.5 nM PRC1 + 5 nM Kif4A (0.9 ± 1.3, n = 23) and 0.5 nM PRC1 + 5 nM Kif4A (Not Determined n = 20).
Extended Data Fig. 6
Extended Data Fig. 6. Related to Fig. 5
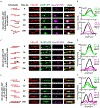
a, c, e. Schematics and montages of X-rhodamine labeled microtubules (red) which grow from X-rhodamine labeled seeds (red) and form new bundles. Time T= 0 refers to the first image where the two growing ends encounter each other, as judged by the intensity in the tubulin channel. Schematics indicate the plus end of the microtubules within the bundle. Velocity arrow indicates direction of microtubule sliding. Dotted red arrows indicate microtubule growth. Dotted gray lines indicate regions of overlap. X-Rho MT: X-Rhodamine microtubules. Scale bar represents 2 μm. b, d, f. Line scans of intensities of GFP (top) and Alexa-647 (bottom) channels along a line joining the two microtubules and containing the overlap, at times T = 0, 10s 30s and 90s following bundle formation. Intensities were normalized to a value of 100 for the maximum intensity recorded for each channel, across all time points. Assay conditions are a & b: 200 nM CLASP1-GFP + 0.5 nM Alexa 647-labeled PRC1 + 50 nM Kif4A (8 events analyzed from 2 independent experiments) c & d: 200 nM CLASP1-GFP + 0.5 nM PRC1 + 50 nM Alexa 647-labeled Kif4A (31 events analyzed from 3 independent experiments) e & f: 200 nM CLASP1-GFP + 0.5 nM PRC1 + 5 nM Alexa 647-labeled Kif4A (22 events analyzed from 3 independent experiments)
Extended Data Fig. 7
Extended Data Fig. 7. Related to Fig. 5
a. Scatter plot of CLASP1-GFP fluorescence intensities on single and cross-linked microtubules. Error bars indicate standard error of mean. Mean intensity and standard error of mean for assay conditions: 0.5 nM PRC1 + 200 nM CLASP1-GFP, single microtubules (24.2 ± 0.9, n=54), cross-linked microtubules (80.2 ± 8.1, n=30). n = number of microtubules analyzed from 3 independent experiments in each condition. b. Scatter plot of Kif4A-GFP fluorescence intensities on single and cross-linked microtubules. Error bars indicate standard error of mean. Mean intensity and standard error of mean for assay conditions: 0.5 nM PRC1 + 10 nM Kif4A-GFP, single microtubules (80.1 ± 13, n=46), cross-linked microtubules (1106 ± 90.1, n=57). n = number of microtubules analyzed from 3 independent experiments in each condition. c. Bio-Layer interferometry assay to quantify the binding affinity of CLASP1(654-1471)-GFP to PRC1(1-486). Error bars represent standard error of mean. Data from 3 independent experiments were fit to a Hill equation. KD : 1.04 ± 0.44 μM (R2 of fit = 0.90). d. Representative SDS-PAGE gel showing input proteins (lanes 2-4) and proteins appearing in the bound fraction (lanes 5-11) of pull-down assay with immobilized Flag-Kif4A, from one of 3 independent experiments. Reaction conditions corresponding to each lane are described in the table below the gel. Concentration of CLASP1(654-1471)-GFP used in each reaction is indicated in parentheses below the table. M: molecular weight marker, with corresponding masses in kDa on the side.
Extended Data Fig. 8
Extended Data Fig. 8. Related to Fig. 5
a. Representative kymographs of dynamic single X-rhodamine-labeled microtubules (X-Rho MTs) with 50 nM Alexa 647-labeled EB3 + 0.5 nM PRC1 (n = 70), 50 nM Alexa 647-labeled EB3 + 0.5 nM PRC1 + 5 nM Kif4A-GFP (n = 93), 50 nM Alexa 647-labeled EB3 + 0.5 nM PRC1 + 50 nM Kif4A-GFP (n = 60). Scale bar represents 2 μm. n = number of Kymographs analyzed from 3 independent experiments b. Scatter plot of intensities of EB3 at microtubule tips with increasing concentrations of Kif4A-GFP. Mean and standard deviation are indicated by black bars. Assay condition (n=number of growth events analyzed): 50 nM Alexa 647-labeled EB3 + 0.5 nM PRC1 (186.40 ± 173.80, n=281), 50 nM Alexa 647-labeled EB3 + 0.5 nM PRC1 + 5 nM Kif4A-GFP (143.80 ± 155.20, n=98), 50 nM Alexa 647-labeled EB3 + 0.5 nM PRC1 + 50 nM Kif4A-GFP (28.11 ± 47.85, n=43). For 50 nM Alexa 647-labeled EB3 + 0.5 nM PRC1compared to (i) 50 nM Alexa 647-labeled EB3 + 0.5 nM PRC1 + 5 nM Kif4A-GFP, P= 0.048, (ii) 50 nM Alexa 647-labeled EB3 + 0.5 nM PRC1 + 50 nM Kif4A-GFP, P < <0.0001, in an ordinary one-way ANOVA test with Dunnett correction for multiple comparisons. c. Representative kymographs of a cross-linked X-rhodamine-labeled microtubule bundle in the presence of 50 nM Alexa 647-labeled EB3, 0.5 nM PRC1 and 5 nM Kif4A-GFP. Schematics above and below the merged kymograph indicate positions of the microtubules (red) and PRC1 (gray dashed line) at the start and end of the experiment, respectively. + indicates microtubule polarity. Scale bar represents 2 μm. A total of 45 kymographs from 3 independent experiments were examined.
Extended Data Fig. 9
Extended Data Fig. 9. Related to Fig. 5
a. Representative kymographs of cross-linked X-rhodamine-labeled microtubule bundle (X-Rho MTs) in the presence of 0.5 nM PRC1, 200 nM CLASP1-GFP and 50 nM Alexa 647-labeled EB3. Intensity profile below merged kymograph shows the normalized intensities of the GFP (green) and Alexa 647 (magenta) channels at the time-point represented by dashed yellow line on kymograph. Gray box indicates the position of microtubule seeds. Intensities were normalized to a value of 100 for the maximum intensity recorded for each channel. Schematics on bottom right represent the positions of microtubules (red), EB3 (magenta) and PRC1 (gray dashed lines) at the same time-point. Scale bar represents 2 μm. A total of 73 kymographs from 3 independent experiments were examined. b. Representative BLI sensorgram of the binding response of 1μM CLASP1(654-1471)-GFP in solution to immobilized EB3, in the presence of 10 mM (black), 25 mM (blue) and 50 mM (red) KCl. Vertical dotted black line demarcates the binding and dissociation phases. The sensorgrams have been corrected for drift of EB3 from the sensor and non-specific binding of CLASP1(654-1471)-GFP to the sensor. Binding curves from 3 independent experiments were analyzed. c. Representative kymographs of cross-linked X-rhodamine-labeled microtubules (X-Rho MTs) in the presence of 0.5 nM PRC1, 200 nM CLASP1-GFP, 50 nM Kif4A and 50 nM Alexa 647-labeled EB3. Intensity profile below merged kymograph shows the normalized intensities of the GFP (green) and Alexa-647 (magenta) channels at the time-point represented by dashed yellow line on kymograph. Gray box indicates the position of microtubule seeds. Intensities were normalized to a value of 100 for the maximum intensity recorded for each channel. Schematics on bottom right represent the positions of microtubules (red), EB3 (magenta) and PRC1 (gray dashed lines) at the same time-point. Scale bar represents 2 μm. A total of 67 kymographs from 3 independent experiments were examined.
Figure 1:
Figure 1:. The rescue activity of CLASP1 overrides growth suppression by Kif4A on single microtubules.
Also see Extended data Figs. 1 and 2 n = total number of kymographs analyzed from a total of 3 independent experiments for each condition, except where indicated. All concentrations correspond to dimeric Kif4A and monomeric CLASP1-GFP, except where indicated. P-values were calculated from an ordinary one-way ANOVA test with Dunnett correction for multiple comparisons. a. Representative kymographs of X-rhodamine-microtubules in the presence of Kif4A and CLASP1-GFP. GMPCPP-seeds are not shown. indicates growth event and direction of growth. Curved arrow indicates a catastrophe event. * indicates a rescue event on the microtubule. ∣ indicates a period of stalled growth (‘pause’) on the microtubule. Scale bar represents 2 μm. Number of kymographs examined: tubulin control (65), 200 nM CLASP1 (76), 200 nM CLASP1 + 125 nM Kif4A (69), 200 nM CLASP1 + 250 nM Kif4A (73), 200 nM CLASP1 + 1000 nM Kif4A (73) and 1000 nM Kif4A (38). b. Histogram of growth rates for each condition seen in (a). Number of events analyzed: tubulin control (306), 200 nM CLASP1 (218), 200 nM CLASP1 + 125 nM Kif4A (308), 200 nM CLASP1 + 250 nM Kif4A (381), 200 nM CLASP1 + 1000 nM Kif4A (331) and 1000 nM Kif4A (78). c. Scatter plot of duration-weighted microtubule growth rate. Mean (center line) and standard deviation as indicated by red bars, for assay conditions: tubulin control (16.4 ± 2.6 nm/s, n = 58), 200 nM CLASP1 (12.4 ± 2.2 nm/s, n = 66), 200 nM CLASP1 + 125 nM Kif4A (6.9 ± 2.8 nm/s, n = 67), 200 nM CLASP1 + 250 nM Kif4A (5.7 ± 2.6 nm/s, n = 73), 200 nM CLASP1 + 1000 nM Kif4A (3.7 ± 3.7 nm/s, n = 73) and 1000 nM Kif4A (0.3 ± 0.8 nm/s, n = 38). P < 0.0001 for each column when compared to tubulin alone. d. Box and whisker plot of maximum microtubule length. Horizontal lines within box indicate the 25th, median (center line) and 75th percentile. Plus-sign indicates mean. Error bars indicate minimum and maximum range. Mean and standard deviation for assay conditions with tubulin alone (6.0 ± 2.9 μm, n = 60), 200 nM CLASP1 (12.1 ± 3.2 μm, n = 68), 200 nM CLASP1 + 125 nM Kif4A (7.0 ± 2.3 μm, n = 67), 200 nM CLASP1 + 250 nM Kif4A (5.4 ± 2.1 μm, n = 72), 200 nM CLASP1 + 1000 nM Kif4A (2.2 ± 1.4 μm, n = 74) and 1000 nM Kif4A (0.6 ± 0.5 μm, n = 40). P < 0.0001 for 1000 nM Kif4A when compared to the tubulin control. e. Scatter plot of GFP intensity per pixel on taxol-stabilized microtubules in the presence of 150 nM ATP, Kif4A-GFP (blue dots) or CLASP1-GFP (red dots). All concentrations refer to monomeric proteins. Inset shows magnified region containing intensities for CLASP1-GFP(red dots). Mean and standard deviation of intensities for assay conditions with CLASP1-GFP: 8 nM (26.9 ±18, n=76), 40 nM (95.3 ± 41.8, n=70), 60 nM (109 ± 30.0, n=70), 80 nM (400.1 ± 166.9, n=70), 160 nM (397.6 ± 90.3, n=70), 400 nM (754.5 ± 154.3, n=70), 800 nM (854.3 ± 122.1, n=35). Assay conditions with Kif4A-GFP: 20 nM (894.0 ± 253.9, n=70), 100 nM (1856 ± 380.3, n=70), 150 nM (2649 ± 1527, n=70), 200 nM (3982 ± 2346, n=70), 400 nM (6814 ± 2085, n=70), 1000 nM (7542 ± 1640, n=70). n refers to number of microtubules analyzed from 2 independent experiments for each condition. f. Scatter plot and Bar graph showing mean of the ratio of rescue to total number of catastrophe events in 20 minutes. Error bars indicate standard deviation. Assay conditions: Tubulin control (0.0 ± 0.1, n = 60), 200 nM CLASP1 (1.0 ± 0.2, n = 57), 200 nM CLASP1 + 125 nM Kif4A (0.9 ± 0.3, n = 43), 200 nM CLASP1 + 250 nM Kif4A (0.9 ± 0.3, n = 49), 200 nM CLASP1 + 1000 nM Kif4A (0.4 ± 0.3, n = 42) and 1000 nM Kif4A (0.0 ± 0.0, n = 10). P < 0.0001 for tubulin control to 200 nM CLASP1, for 200 nM CLASP1 + 250 nM Kif4A to 200 nM CLASP1 + 1000 nM Kif4A and to 1000 nM Kif4A. P is not significant for 200 nM CLASP1 to (i) 200 nM CLASP1 + 125 nM Kif4A and to (ii) 200 nM CLASP1 + 250 nM Kif4A.
Figure 2:
Figure 2:. The collective activity of Kif4A, CLASP1 and PRC1 differentially regulates the dynamics of single and cross-linked microtubules
Also see Extended data Fig. 3, Supplementary Video 1 and Supplementary Video 2. a. Schematic of the dynamic microtubule assay used to examine the collective activity of PRC1, Kif4A and CLASP1-GFP on cross-linked and single microtubules. b-e. Representative kymograph of X-Rhodamine channel of single (b,d) and cross-linked microtubule (c,e). The position of the seed is shown as a blue box. The schematics above and below the kymograph indicate the positions of the seed (blue) and microtubules (red) at the start and end of the experiment, respectively. Scale bar represents 2 μm. Assay conditions: (b,c) 0.5 nM PRC1 + 200 nM CLASP1-GFP (Kymographs of 47 single and 29 cross-linked microtubules were examined), (d,e) 0.5 nM PRC1 + 200 nM CLASP1-GFP + 10 nM Kif4A (Kymographs of 42 single and 49 cross-linked microtubules were examined).
Figure 3:
Figure 3:. Dynamics of cross-linked microtubules in presence of Kif4A, CLASP1 and PRC1
Also see Extended data Fig. 4 Schematics and representative montages of microtubule bundles (red) grown from microtubule seeds (blue) in 3 independent experiments. Schematics indicate the plus end of the microtubules within the bundle. Velocity arrow indicates direction of microtubule sliding. Dotted red arrows indicate microtubule growth. Dotted gray lines indicate regions of overlap. X-Rh MT: X-Rhodamine microtubules. Scale bar represents 2 μm. Assay conditions and number of events (n) examined are (a) 200 nM CLASP1-GFP + 0.5 nM PRC1 + 10 nM Kif4A (n=36), (b) 200 nM CLASP1-GFP + 0.5 nM PRC1 + 5 nM Kif4A (n=37), (c) 200 nM CLASP1-GFP + 0.5 nM PRC1 (n = 33)
Figure 4:
Figure 4:. Kif4A activity dominates to suppress dynamics of cross-linked microtubules while CLASP1 activity promotes the elongation of single microtubules under identical reaction conditions
Also see Extended data Fig. 5 n = total number of kymographs of overlaps (a-c) and single microtubules (d-f) analyzed from 3 independent experiments in each condition a. Scatter plot of duration-weighted growth rate of cross-linked microtubules. Black bars indicate mean (center line) and standard deviation. Assay conditions: 200 nM CLASP1 + 0.5 nM PRC1 + 125 nM Kif4A 0.0 ± 0.0 nm/s [n = 30]; 200 nM CLASP1 + 0.5 nM PRC1 + 50 nM Kif4A 0.4 ± 0.8 nm/s [n = 39]; 200 nM CLASP1 + 0.5 nM PRC1 + 10 nM Kif4A 0.3 ± 0.6 nm/s [n = 35]; 200 nM CLASP1 + 0.5 nM PRC1 + 5 nM Kif4A 6.1 ± 2.8 nm/s [n = 36] and 200 nM + 0.5 nM PRC1 11.8 ± 2.3 nm/s [n = 33] b. Box and whisker plot of maximum length of cross-linked overlap. Plus-sign indicates mean. Horizontal lines within box indicate the 25th, median (center line) and 75th percentile. Error bars indicate minimum and maximum range. Mean and standard deviation for assay conditions: 200 nM CLASP1 + 0.5 nM PRC1 + 125 nM Kif4A (0.0 ± 0.0 μm, n = 30), 200 nM CLASP1 + 0.5 nM PRC1 + 50 nM Kif4A (0.3 ± 0.6 μm, n = 33), 200 nM CLASP1 + 0.5 nM PRC1 + 10 nM Kif4A (0.3 ± 0.7 μm, n = 36), 200 nM CLASP1 + 0.5 nM PRC1 + 5 nM Kif4A (5.7 ± 2.1 μm, n = 37), 200 nM + 0.5 nM PRC1 (15.2 ± 4.4 μm, n = 33), 20 nM CLASP1 + 0.5 nM PRC1 + 5 nM Kif4A (1.5 ± 1.3 μm, n = 24) and 0.5 nM PRC1 + 5 nM Kif4A (0.8 ± 0.7 μm, n = 20). c. Scatter plot of the ratio of rescues to total number of catastrophe events in microtubule bundles in 20 minutes. Black bars indicate mean (center line) and standard deviation. ND: Not determined because no dynamics were observed. Assay conditions: 200 nM CLASP1 + 0.5 nM PRC1 + 125 nM Kif4A (Not Determined, n = 30), 200 nM CLASP1 + 0.5 nM PRC1 + 50 nM Kif4A (Not Determined, n = 39), 200 nM CLASP1 + 0.5 nM PRC1 + 10 nM Kif4A (Not Determined, n = 36), 200 nM CLASP1 + 0.5 nM PRC1 + 5 nM Kif4A (0.9 ± 0.3, n = 15), 200 nM + 0.5 nM PRC1 (1.0 ± 0.1, n = 24), 20 nM CLASP1 + 0.5 nM PRC1 + 5 nM Kif4A (0.3 ± 0.4, n = 17) and 0.5 nM PRC1 + 5 nM Kif4A (0.0 ± 0.0, n = 12). d. Scatter plot of duration-weighted growth rates of single microtubules. Black bars indicate mean (center line) and standard deviation. Assay conditions: 200 nM CLASP1 + 0.5 nM PRC1 + 125 nM Kif4A (3.9 ± 2.9 nm/s, n = 76); 200 nM CLASP1 + 0.5 nM PRC1 + 50 nM Kif4A (8.4 ± 2.1 nm/s, n = 69); 200 nM CLASP1 + 0.5 nM PRC1 + 10 nM Kif4A (11.3 ± 2.5 nm/s, n = 60); 200 nM CLASP1 + 0.5 nM PRC1 + 5 nM Kif4A (12.5 ± 1.7 nm/s, n = 52); and 200 nM + 0.5 nM PRC1 (12.7 ± 2.1 nm/s, n = 47). e. Box and whisker plot of maximum length of single microtubules. Plus-sign indicates mean. Horizontal lines within box indicate the 25th, median (center line) and 75th percentile. Error bars indicate minimum and maximum range. Mean and standard deviation for assay conditions: 200 nM CLASP1 + 0.5 nM PRC1 + 125 nM Kif4A (5.0 ± 2.1 μm, n = 76); 200 nM CLASP1 + 0.5 nM PRC1 + 50 nM Kif4A (8.4 ± 2.8 μm, n = 69); 200 nM CLASP1 + 0.5 nM PRC1 + 10 nM Kif4A (12.1 ± 3.3 μm, n = 60); 200 nM CLASP1 + 0.5 nM PRC1 + 5 nM Kif4A (11.1 ± 3.8 μm, n = 53); and 200 nM + 0.5 nM PRC1 (12.2 ± 3.4 μm, n = 47). 20 nM CLASP1 + 0.5 nM PRC1 +5 nM Kif4A (6.1 ± 1.7 μm, n = 39); 0.5 nM PRC1 + 5 nM Kif4A (4.1 ± 1.8 μm, n = 50). f. Scatter plot of the ratio of rescues to total number of catastrophe events in single microtubules in 20 minutes. Black bars indicate mean (center line) and standard deviation. Assay conditions: 200 nM CLASP1 + 0.5 nM PRC1 + 125 nM Kif4A (0.93 ± 0.18, n = 41); 200 nM CLASP1 + 0.5 nM PRC1 + 50 nM Kif4A (0.95 ± 0.18, n = 63); 200 nM CLASP1 + 0.5 nM PRC1 + 10 nM Kif4A (0.99 ± 0.06, n = 52), 200 nM CLASP1 + 0.5 nM PRC1 + 5 nM Kif4A (0.95 ± 0.15, n = 50), 200 nM + 0.5 nM PRC1 (0.93 ± 0.18, n = 45); 20 nM CLASP1 + 0.5 nM PRC1 + 5 nM Kif4A (0.20 ± 0.26, n = 39); 0.5 nM PRC1 + 5 nM Kif4A (0.0 ± 0.0, n = 50).
Figure 5:
Figure 5:. The stronger recruitment of Kif4A to cross-linked overlaps relative to CLASP1 recruitment arises from differences in the PRC1-binding affinities of Kif4A and CLASP1.
Also see Extended data Figs. 6-9 and Supplementary Video 3 a. BLI assay to quantify the binding affinity of CLASP1 constructs to PRC1. Error bars represent standard error of mean. Data collected from 3 independent experiments were fit to a Hill equation. KD : CLASP1(1-654)-GFP > 10 μM; CLASP1(805-1471)-GFP > 10 μM and CLASP1(654-1471)-GFP: 1.19 ± 0.24 μM (R2 of fit = 0.98). b. BLI assay to quantify the binding affinity of Kif4A-GFP to PRC1. Error bars represent standard error of mean. Data collected from 3 independent experiments were fit to a Hill equation. KD : 12.47± 2.09 nM (R2 of fit = 0.98). c. Schematic of pull-down assay used to test for competition between Kif4A and CLASP1 for PRC1-binding. Anti-Flag antibody coated magnetic beads were incubated first with Flag-Kif4A, washed and then incubated with either PRC1(1-486) or a combination of PRC1(1-486) + CLASP1(654-1471)-GFP. PRC1(1-486) is known to directly bind to Kif4A. For CLASP1(654-1471)-GFP to appear in the Kif4A-bound protein fraction, PRC1(1-486) needs to be able to bind to Kif4A and CLASP1 simultaneously in solution. d. Scatter plot with bar graph showing mean of normalized intensities of protein bands of PRC1(1-486) (left side) and CLASP1(654-1471)-GFP (right side, gray box) from SDS-PAGE gels of pull-down assay described in (c). Error bars indicate standard deviation of intensities from 3 independent experiments. Normalized intensities and standard deviation of PRC1(1-486) bands in sample containing PRC1(1-486): 0.18 ± 0.10; FLAG-Kif4A + PRC1(1-486): 0.80 ± 0.12; FLAG-Kif4A + PRC1(1-486) + 5 μM CLASP1(654-1471)-GFP: 1.36 ± 0.67; FLAG-Kif4A + PRC1(1-486) + 10 μM CLASP1(654-1471)-GFP: 1.12 ± 0.12. P-values for PRC1(1-486) compared to FLAG-Kif4A + PRC1(1-486) + 5 μM and 10 μM CLASP1(654-1471)-GFP are 0.0079 and 0.0252, in an ordinary one-way ANOVA test with Dunnett correction for multiple comparisons. (Note: the intensity of the PRC1(1-486) band in Flag-Kif4A sample was >3x higher than in sample without Flag-Kif4A in every repeat of 3 independent experiments. The statistical significance in the difference between these samples is difficult to assess due to the high variation in the SDS-gel background relative to the low signal in the control lane without Flag-Kif4A). Normalized intensities of CLASP1(654-1471)-GFP in sample containing CLASP1(654-1471)-GFP: 0.16 ± 0.15; FLAG-Kif4A + CLASP1(654-1471)-GFP: 0.25 ± 0.07; FLAG-Kif4A- + PRC1(1-486) + 5 μM CLASP1(654-1471)-GFP: 1.62 ± 0.95; FLAG-Kif4A + PRC1(1-486) + 10 μM CLASP1(654-1471)-GFP: 1.60 ± 0.66. P values for CLASP1(654-1471)-GFP compared to FLAG-Kif4A + PRC1(1-486) + 5 μM and 10 μM CLASP1(654-1471)-GFP are 0.0386 and 0.0405 in an ordinary one-way ANOVA test with Dunnett correction for multiple comparisons. P value is not significant for CLASP1(654-1471)-GFP compared to FLAG-Kif4A + CLASP1(654-1471)-GFP.
Figure 6:
Figure 6:. An inverse microtubule affinity-activity relationship along with differences in PRC1-binding affinity between CLASP1 and Kif4A underlie differential regulation of single and cross-linked microtubules by the PRC1-CLASP1-Kif4A protein module.
a. The dynamics of single microtubules (top) and cross-linked microtubules (bottom) are differentially regulated by the PRC1-CLASP1-Kif4A protein module. Box with dotted lines indicates regime where dynamics switch between continuous growth (→) and no elongation (┤). In the presence of constant CLASP1 concentration, the switch for each microtubule populations occurs at strikingly different Kif4A concentrations. b. (i) Differences in three properties of CLASP1 compared to Kif4A underlie this differentiation: Lower intrinsic microtubule-binding affinity of CLASP1 relative to Kif4A, higher intrinsic activity of CLASP1 relative to Kif4A, and higher PRC1-binding affinity of Kif4A compared to CLASP1. As a result, (ii) the high activity of CLASP1 as a rescue factor overcomes Kif4A activity on single microtubules, despite lower CLASP1 microtubule affinity. (iii) However, on cross-linked microtubules, the enrichment of Kif4A through its stronger PRC1-binding and microtubule-binding helps it overcome CLASP1 activity. The low affinity of CLASP1 for microtubules permits Kif4A activity to suppress the growth of crosslinked microtubules.

Similar articles

Cited by

References

    1. Bitan A, Rosenbaum I & Abdu U Stable and dynamic microtubules coordinately determine and maintain Drosophila bristle shape. Development 139, 1987–1996, doi:10.1242/dev.076893 (2012). - DOI - PubMed
    1. Pous C et al.Functional specialization of stable and dynamic microtubules in protein traffic in WIF-B cells. J Cell Biol 142, 153–165, doi:10.1083/jcb.142.1.153 (1998). - DOI - PMC - PubMed
    1. Baas PW, Rao AN, Matamoros AJ & Leo L Stability properties of neuronal microtubules. Cytoskeleton (Hoboken) 73, 442–460, doi:10.1002/cm.21286 (2016). - DOI - PMC - PubMed
    1. Lindeboom JJ et al.A mechanism for reorientation of cortical microtubule arrays driven by microtubule severing. Science 342, 1245533, doi:10.1126/science.1245533 (2013). - DOI - PubMed
    1. Foe VE & von Dassow G Stable and dynamic microtubules coordinately shape the myosin activation zone during cytokinetic furrow formation. J Cell Biol 183, 457–470, doi:10.1083/jcb.200807128 (2008). - DOI - PMC - PubMed

Methods References

    1. Hyman A et al.Preparation of modified tubulins. Methods Enzymol 196, 478–485 (1991). - PubMed
    1. Folta-Stogniew E & Williams KR Determination of molecular masses of proteins in solution: Implementation of an HPLC size exclusion chromatography and laser light scattering service in a core laboratory J.Biomol Tech 10, 51–63 (1999) - PMC - PubMed
    1. Koppel DE Analysis of macromolecular polydispersity in intensity correlation spectroscopy: the method of cumulants J Chem Phys 57, 4814–4820 (1972)

Publication types

MeSH terms