. 2021 Jun;27(6):1097-1104.
doi: 10.1038/s41591-021-01356-z. Epub 2021 Jun 3.

Phenotypic signatures in clinical data enable systematic identification of patients for genetic testing

Affiliations

Phenotypic signatures in clinical data enable systematic identification of patients for genetic testing

Theodore J Morley et al. Nat Med. 2021 Jun.

Abstract

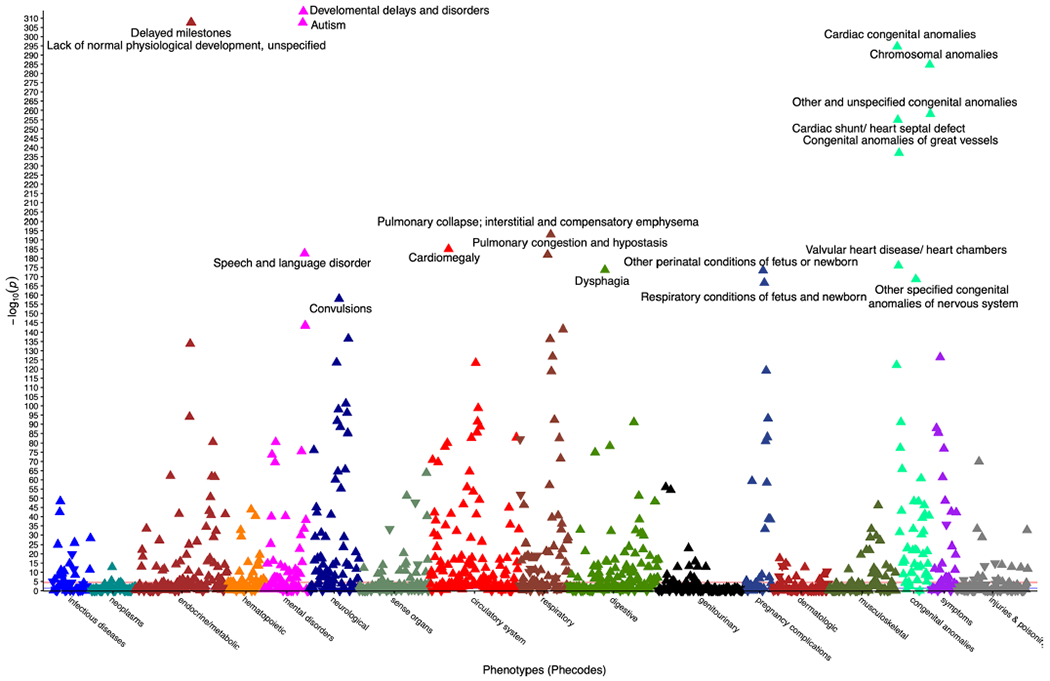
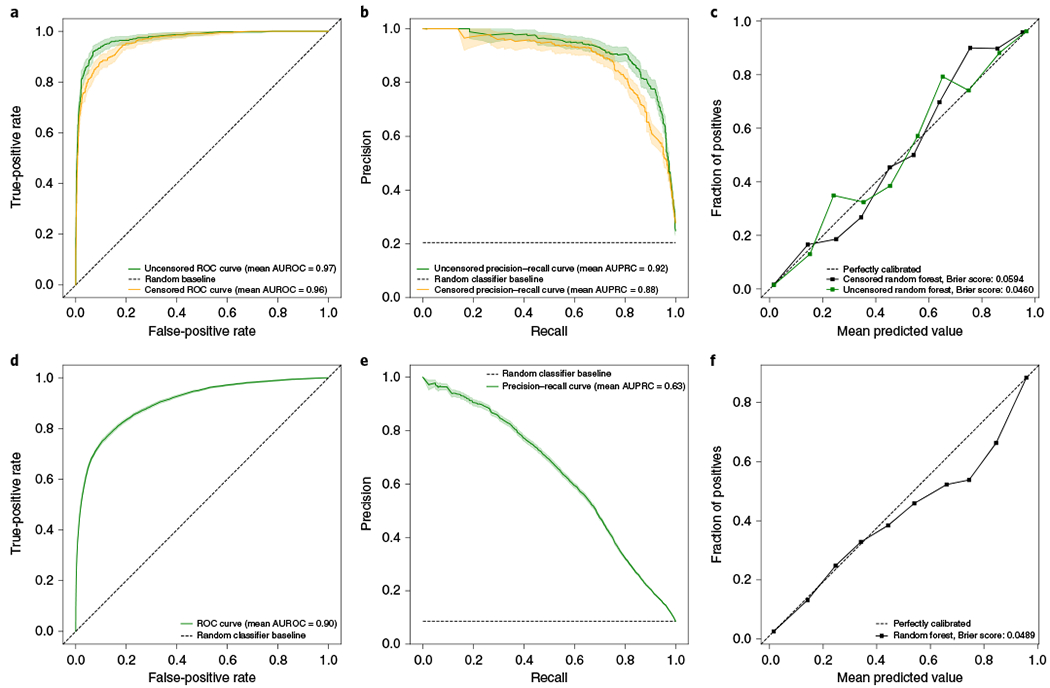
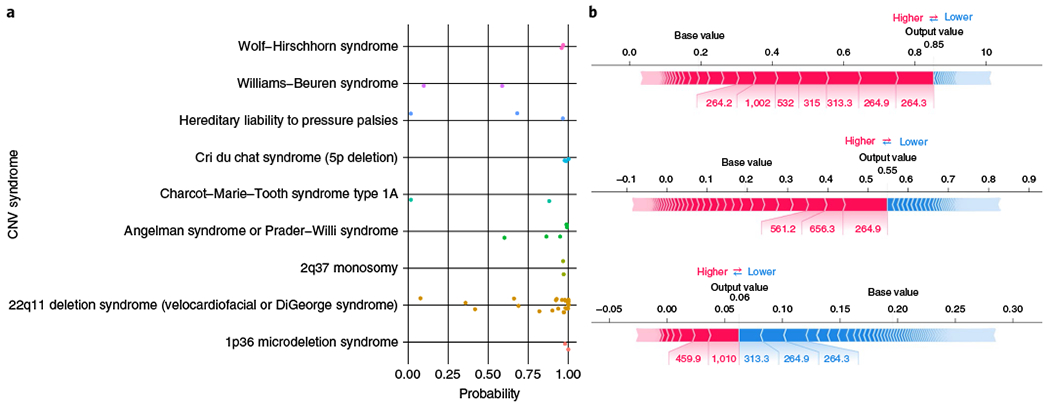
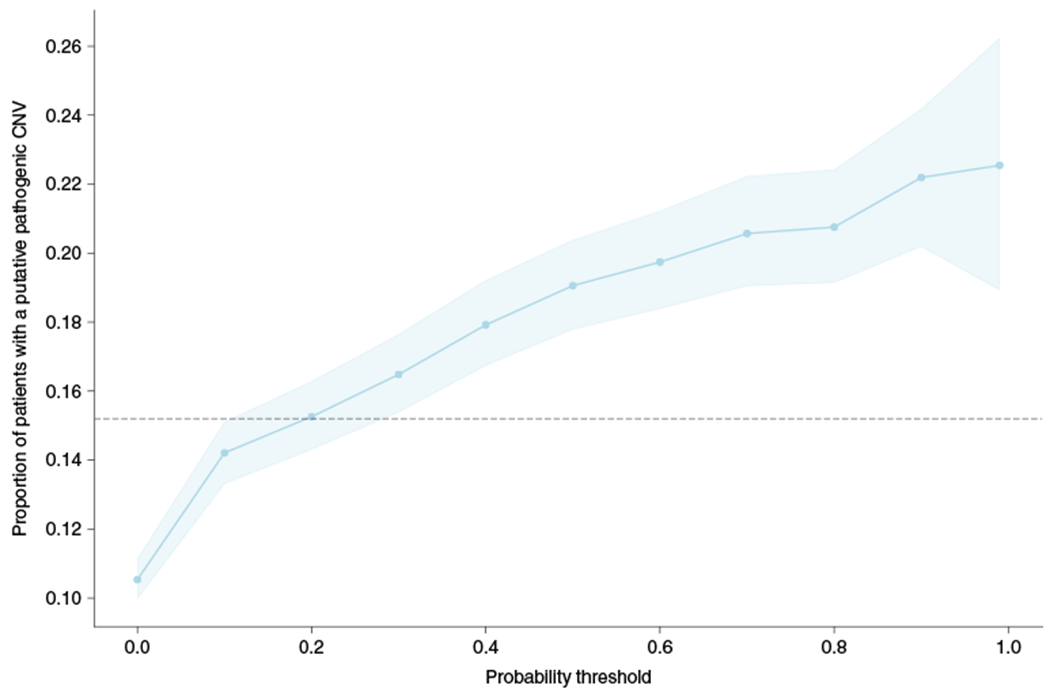
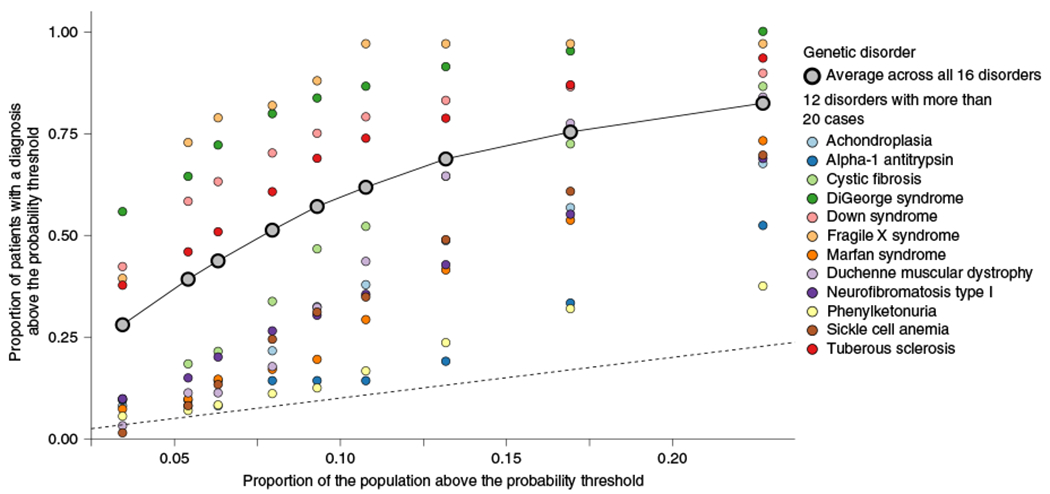
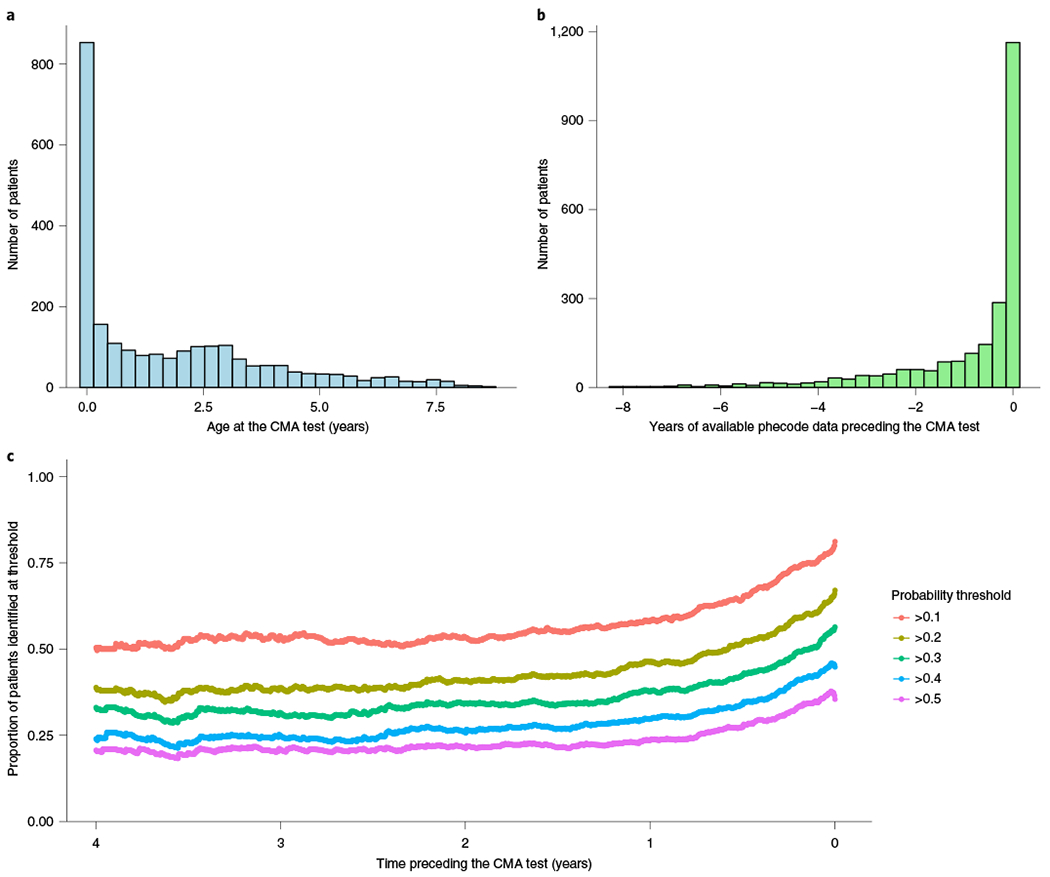
Around 5% of the population is affected by a rare genetic disease, yet most endure years of uncertainty before receiving a genetic test. A common feature of genetic diseases is the presence of multiple rare phenotypes that often span organ systems. Here, we use diagnostic billing information from longitudinal clinical data in the electronic health records (EHRs) of 2,286 patients who received a chromosomal microarray test, and 9,144 matched controls, to build a model to predict who should receive a genetic test. The model achieved high prediction accuracies in a held-out test sample (area under the receiver operating characteristic curve (AUROC), 0.97; area under the precision-recall curve (AUPRC), 0.92), in an independent hospital system (AUROC, 0.95; AUPRC, 0.62), and in an independent set of 172,265 patients in which cases were broadly defined as having an interaction with a genetics provider (AUROC, 0.9; AUPRC, 0.63). Patients carrying a putative pathogenic copy number variant were also accurately identified by the model. Compared with current approaches for genetic test determination, our model could identify more patients for testing while also increasing the proportion of those tested who have a genetic disease. We demonstrate that phenotypic patterns representative of a wide range of genetic diseases can be captured from EHRs to systematize decision-making for genetic testing, with the potential to speed up diagnosis, improve care and reduce costs.


Conflict of interest statement

Competing interests

The authors declare no competing interests.

Figures

Extended Data Fig. 1 |
Extended Data Fig. 1 |. PheWAS of CMA cases versus matched controls.
PheWAS Manhattan plot showing significance of associations from logistic regressions of each of 1,620 phecodes and whether an individual received a CMA vs controls. Triangle points represent direction of effect and points are colored by phecode category. For clarity, only phecodes with uncorrected p-values below 5 × 10−150 are labeled.
Extended Data Fig. 2 |
Extended Data Fig. 2 |. Age of patients at date of CMA testing differs by syndrome.
Age of patients at the time of their CMA report grouped into the most common syndromic region by combining diagnosis and genomic coordinates of reported abnormal variant. Independent patient numbers within each category: 15q11.2 syndromes (32), 16p11.2 syndromes (14), 1q21.1 syndromes (9), CMT/HNPP (18), DiGeorge/22q11.2 Duplication syndrome (31), Down Syndrome (7), Turner/Klinefelter (14), Williams syndrome (9).
Fig. 1 |
Fig. 1 |. Predictive performance of the model in a held-out CMA test set and a general hospital population.
Performance metrics of the prediction model applied to the held-out CMA test dataset (both uncensored and censored versions) (a-c) and to a hospital population (d-f). ROC, receiver operating characteristic. Data are presented as mean values generated via bootstrapping (n = 1,000) with a 95% confidence interval.
Fig. 2 |
Fig. 2 |. Identification of patients with CNV syndromes and interpretability.
a, Probabilities of genetic testing generated by the prediction model for each of the 46 patients in the hospital sample with a CNV overlapping at least 50% of a known CNV syndrome, stratified by disease. b, Tree Explainer plots for all three HNPP patients, showing the phecodes that contributed to the posterior probabilities from the random forest model. The probabilities given are before recalibration (that is, they are decision scores), the blocks represent a phecode, red implies that it contributes to increased probability, blue implies that it contributes to decreased probability, and width represents the amount of the contribution.
Fig. 3 |
Fig. 3 |. Proportion of patients with a putative pathogenic CNV identified by the model.
The proportion of patients with a CNV overlapping a putative pathogenic CNV by at least 50% in ClinGen, stratified by the probability threshold. The dashed line represents the proportion of patients in the CMA group with reported abnormal gains or losses that overlap a ClinGen CNV by at least 50%. Data are presented as the mean values generated by bootstrapping (n = 1,000) with a 95% confidence interval.
Fig. 4 |
Fig. 4 |. Prediction performance across diverse genetic diseases.
The proportion of patients diagnosed with one of 16 genetic diseases above a probability threshold compared with the proportion of patients that would be tested above the same probability threshold. The dashed line represents the identity line, where the proportion of cases above the threshold is equal to the proportion of the sample tested above that threshold. The plotted points correspond to values at different probability thresholds (>0.1, >0.2, >0.3, >0.4, >0.5, >0.6, >0.7, >0.8, >0.9) increasing from right to left. Each column of points corresponds to one of those thresholds, with the most liberal threshold (>0.1), the right most stack of points, resulting in the largest proportion of patients with a genetic disease being identified as well as the largest proportion of the population being tested. The second column of points from the right corresponds to the probability threshold of 0.2, the third from the right is >0.3, etc.
Fig. 5 |
Fig. 5 |. Clinical time period preceding the genetic test.
Assessment of whether the model can identify patients who received a CMA test earlier than when they actually received it through current practice. a, Distribution of the age at which the patients received a CMA test. b, Distribution of the years of phecode data that were available before the CMA test. c, Proportion of patients who the model would have identified for genetic testing at probability thresholds of 0.1, 0.2, 0.3, 0.4 and 0.5 stratified by the time preceding their actual CMA test, up to 4 years prior.

References

    1. Nguengang Wakap S et al. Estimating cumulative point prevalence of rare diseases: analysis of the Orphanet database. Eur. J. Hum. Genet 28, 165–173 (2020). - PMC - PubMed
    1. Ferreira CR The burden of rare diseases. Am. J. Med. Genet. A 179, 885–892 (2019). - PubMed
    1. Rosenthal ET, Biesecker LG & Biesecker BB Parental attitudes toward a diagnosis in children with unidentified multiple congenital anomaly syndromes. Am. J. Med. Genet 103, 106–114 (2001). - PubMed
    1. About Rare Diseases (Orphanet, accessed June 2020); https://www.orpha.net/consor/cgi-bin/Education_AboutRareDiseases.php?lng=EN
    1. About Rare Diseases (EURORDIS Rare Diseases Europe, accessed June 2020); https://www.eurordis.org/about-rare-diseases

Publication types