

The Chromatin Accessibility Landscape of Peripheral Blood Mononuclear Cells in Patients With Systemic Lupus Erythematosus at Single-Cell Resolution
- PMID: 34084162
- PMCID: PMC8168536
- DOI: 10.3389/fimmu.2021.641886
The Chromatin Accessibility Landscape of Peripheral Blood Mononuclear Cells in Patients With Systemic Lupus Erythematosus at Single-Cell Resolution
Abstract
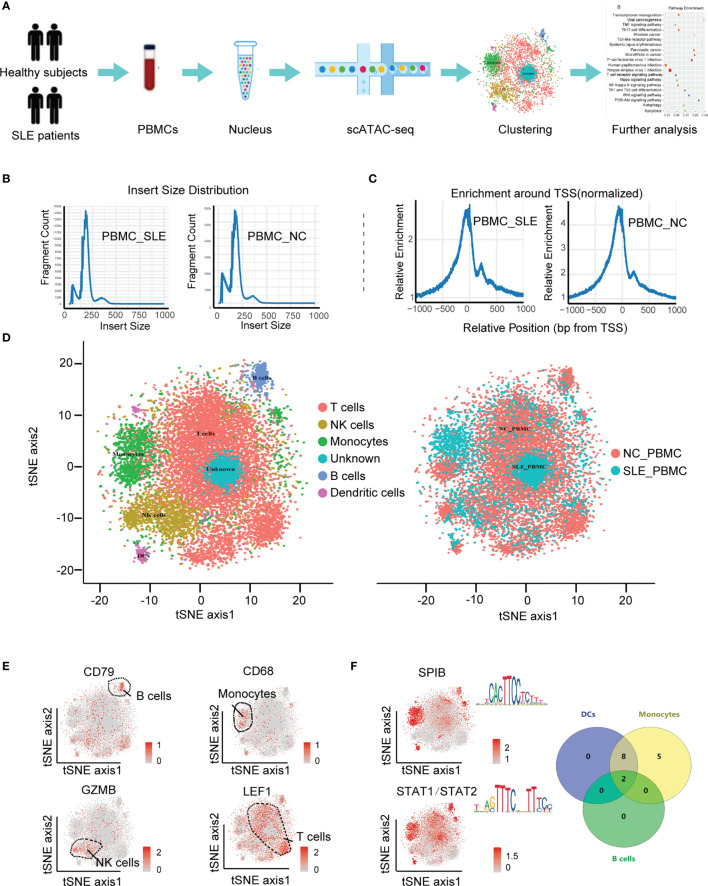
Objective: Systemic lupus erythematosus (SLE) is a complex autoimmune disease, and various immune cells are involved in the initiation, progression, and regulation of SLE. Our goal was to reveal the chromatin accessibility landscape of peripheral blood mononuclear cells (PBMCs) in SLE patients at single-cell resolution and identify the transcription factors (TFs) that may drive abnormal immune responses.
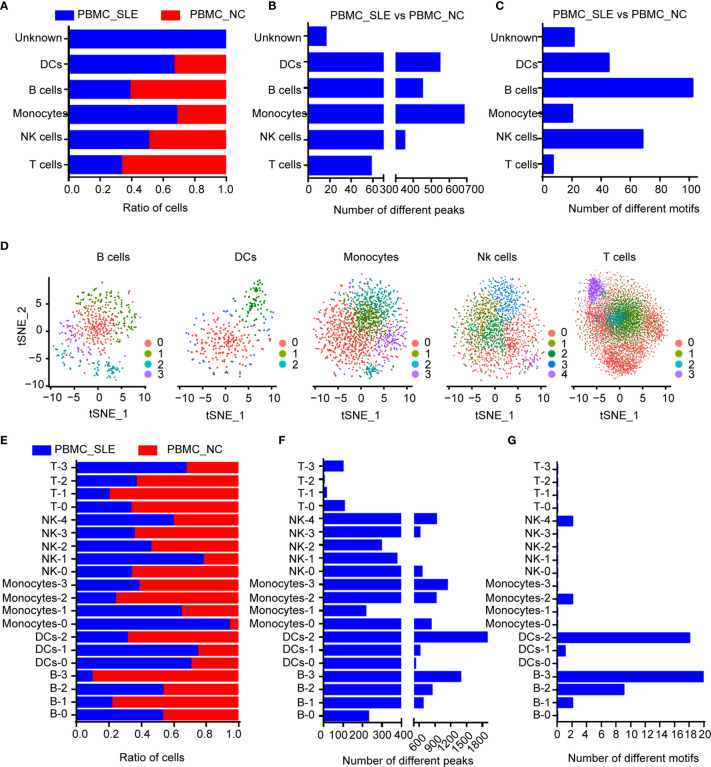
Methods: The assay for transposase accessible chromatin in single-cell sequencing (scATAC-seq) method was applied to map the landscape of active regulatory DNA in immune cells from SLE patients at single-cell resolution, followed by clustering, peak annotation and motif analysis of PBMCs in SLE.
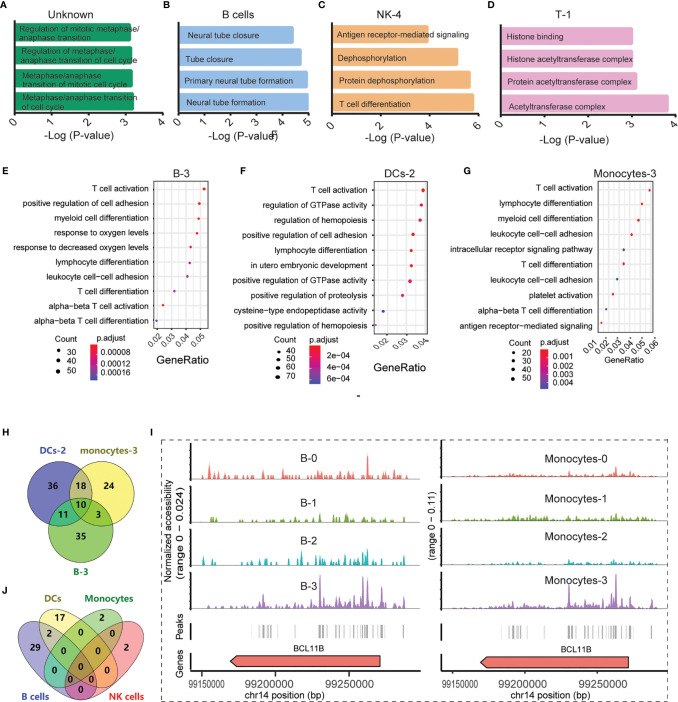
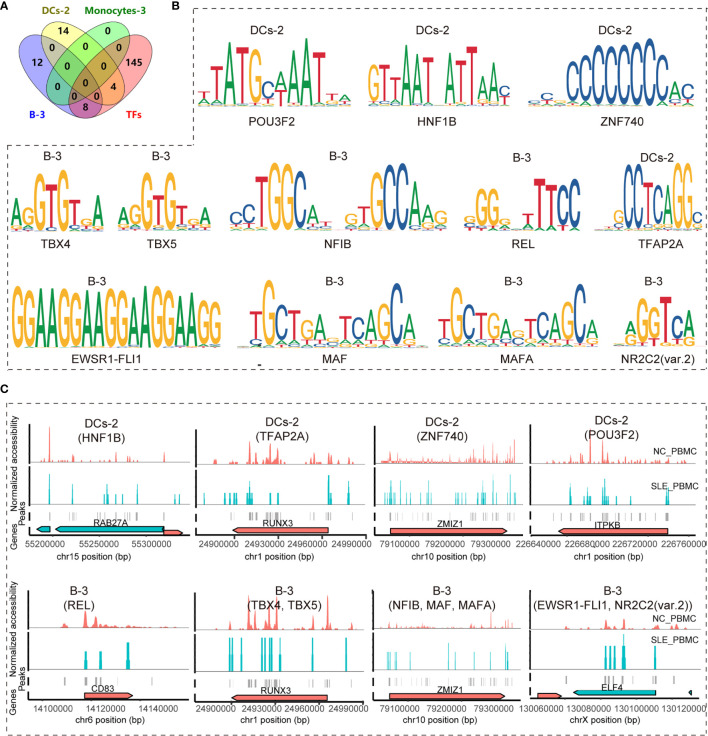
Results: Peripheral blood mononuclear cells were robustly clustered based on their types without using antibodies. We identified twenty patterns of TF activation that drive abnormal immune responses in SLE patients. Then, we observed ten genes that were highly associated with SLE pathogenesis by altering T cell activity. Finally, we found 12 key TFs regulating the above six genes (CD83, ELF4, ITPKB, RAB27A, RUNX3, and ZMIZ1) that may be related to SLE disease pathogenesis and were significantly enriched in SLE patients (p <0.05, FC >2). With qPCR experiments on CD83, ELF4, RUNX3, and ZMIZ1 in B cells, we observed a significant difference in the expression of genes (ELF4, RUNX3, and ZMIZ1), which were regulated by seven TFs (EWSR1-FLI1, MAF, MAFA, NFIB, NR2C2 (var. 2), TBX4, and TBX5). Meanwhile, the seven TFs showed highly accessible binding sites in SLE patients.
Conclusions: These results confirm the importance of using single-cell sequencing to uncover the real features of immune cells in SLE patients, reveal key TFs in SLE-PBMCs, and provide foundational insights relevant for epigenetic therapy.
Keywords: marker; peripheral blood mononuclear cells; single-cell chromatin accessible assay; systemic lupus erythematosus; transcription factor.
Copyright © 2021 Yu, Hong, Wu, Zheng, Zeng, Dai, Yin, Liu, Tang and Dai.
Conflict of interest statement
The authors declare that the research was conducted in the absence of any commercial or financial relationships that could be construed as a potential conflict of interest.
Figures
Similar articles
-
Integrated analysis of ATAC-seq and RNA-seq reveals the transcriptional regulation network in SLE.Int Immunopharmacol. 2023 Mar;116:109803. doi: 10.1016/j.intimp.2023.109803. Epub 2023 Feb 2. Int Immunopharmacol. 2023. PMID: 36738683
-
Epigenetic regulation of immune cells in systemic lupus erythematosus: insight from chromatin accessibility.Expert Opin Ther Targets. 2024 Jul;28(7):637-649. doi: 10.1080/14728222.2024.2375372. Epub 2024 Jul 2. Expert Opin Ther Targets. 2024. PMID: 38943564 Review.
-
Multi-omics integration identifies NK cell-mediated cytotoxicity as a therapeutic target in systemic lupus erythematosus.Front Immunol. 2025 May 13;16:1580540. doi: 10.3389/fimmu.2025.1580540. eCollection 2025. Front Immunol. 2025. PMID: 40433370 Free PMC article.
-
Single-cell RNA sequencing of peripheral blood mononuclear cells from pregnant women with Systemic lupus erythematosus.Int Rev Immunol. 2024;43(6):381-393. doi: 10.1080/08830185.2024.2376649. Epub 2024 Jul 27. Int Rev Immunol. 2024. PMID: 39066603
-
The unexplained female predominance of systemic lupus erythematosus: clues from genetic and cytokine studies.Clin Rev Allergy Immunol. 2011 Feb;40(1):42-9. doi: 10.1007/s12016-009-8192-4. Clin Rev Allergy Immunol. 2011. PMID: 20063186 Free PMC article. Review.
Cited by
-
Single-Cell Sequencing: High-Resolution Analysis of Cellular Heterogeneity in Autoimmune Diseases.Clin Rev Allergy Immunol. 2024 Jun;66(3):376-400. doi: 10.1007/s12016-024-09001-6. Epub 2024 Aug 26. Clin Rev Allergy Immunol. 2024. PMID: 39186216 Review.
-
On Deep Landscape Exploration of COVID-19 Patients Cells and Severity Markers.Front Immunol. 2021 Sep 16;12:705646. doi: 10.3389/fimmu.2021.705646. eCollection 2021. Front Immunol. 2021. PMID: 34603282 Free PMC article.
-
Single-Cell Sequencing in Rheumatic Diseases: New Insights from the Perspective of the Cell Type.Aging Dis. 2022 Dec 1;13(6):1633-1651. doi: 10.14336/AD.2022.0323. eCollection 2022 Dec 1. Aging Dis. 2022. PMID: 36465169 Free PMC article.
-
Transcription factor ELF4 in physiology and diseases: Molecular roles and clinical implications.Genes Dis. 2024 Aug 23;12(3):101394. doi: 10.1016/j.gendis.2024.101394. eCollection 2025 May. Genes Dis. 2024. PMID: 40083328 Free PMC article. Review.
-
Angiotensin receptor blockers modulate the lupus CD4+ T cell epigenome characterized by TNF family-linked signaling.JCI Insight. 2024 Dec 17;10(3):e176811. doi: 10.1172/jci.insight.176811. JCI Insight. 2024. PMID: 39688922 Free PMC article.
References
Publication types
MeSH terms
Substances
LinkOut - more resources
Full Text Sources
Medical
Molecular Biology Databases
Miscellaneous