. 2021 May 18:12:662048.
doi: 10.3389/fimmu.2021.662048. eCollection 2021.

CD40 Activity on Mesenchymal Cells Negatively Regulates OX40L to Maintain Bone Marrow Immune Homeostasis Under Stress Conditions

Affiliations

CD40 Activity on Mesenchymal Cells Negatively Regulates OX40L to Maintain Bone Marrow Immune Homeostasis Under Stress Conditions

Barbara Bassani et al. Front Immunol. .

Abstract

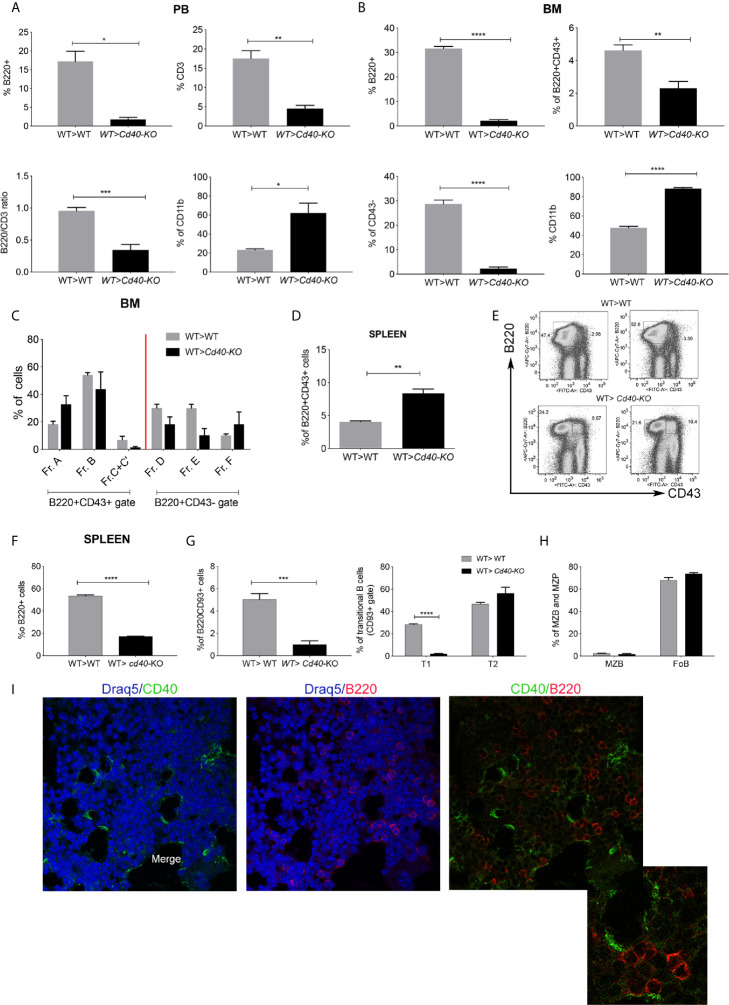
Background: Within the bone marrow (BM), mature T cells are maintained under homeostatic conditions to facilitate proper hematopoietic development. This homeostasis depends upon a peculiar elevated frequency of regulatory T cells (Tregs) and immune regulatory activities from BM-mesenchymal stem cells (BM-MSCs). In response to BM transplantation (BMT), the conditioning regimen exposes the BM to a dramatic induction of inflammatory cytokines and causes an unbalanced T-effector (Teff) and Treg ratio. This imbalance negatively impacts hematopoiesis, particularly in regard to B-cell lymphopoiesis that requires an intact cross-talk between BM-MSCs and Tregs. The mechanisms underlying the ability of BM-MSCs to restore Treg homeostasis and proper B-cell development are currently unknown.

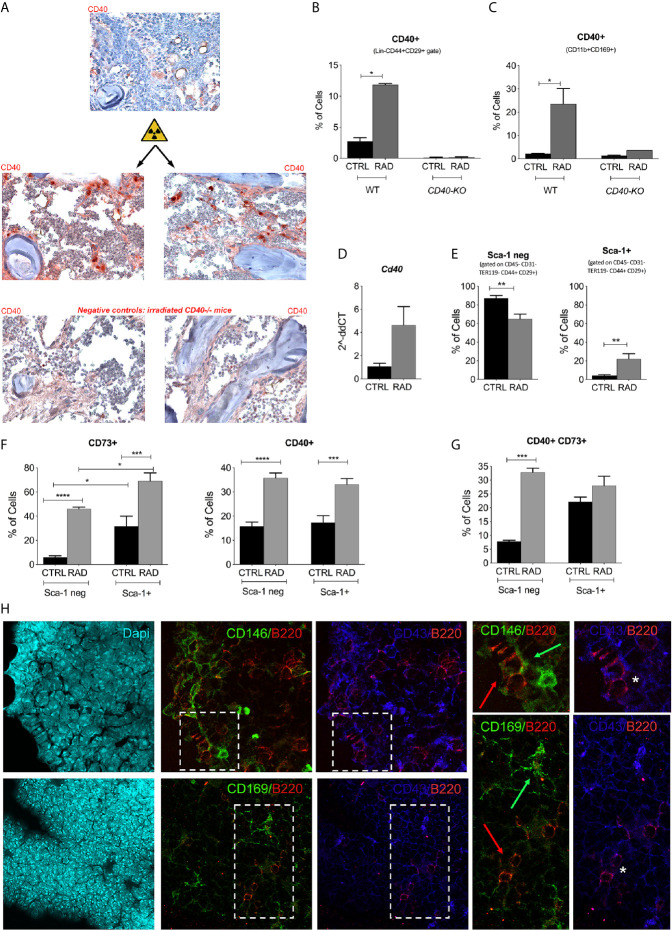
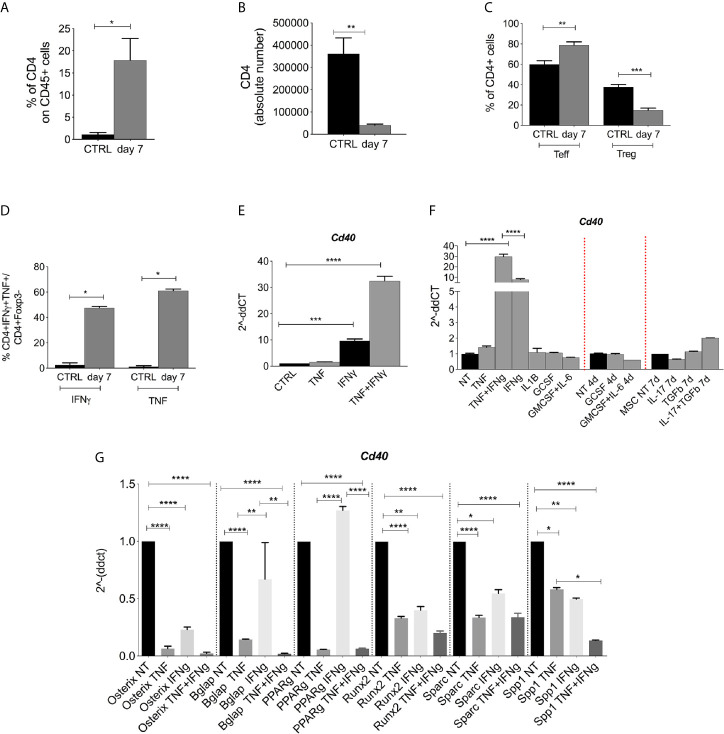
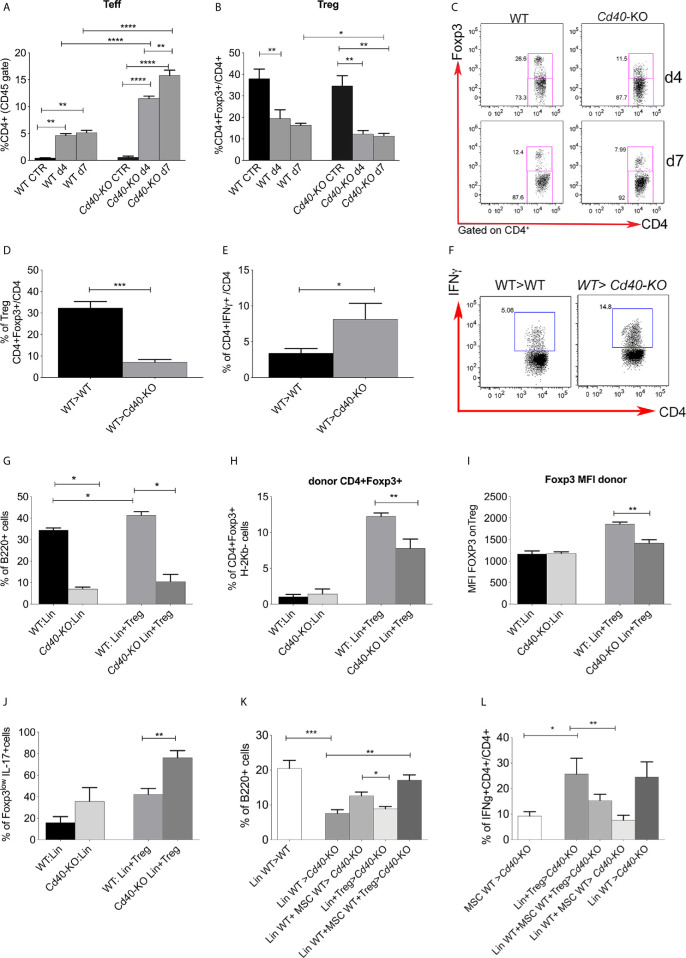
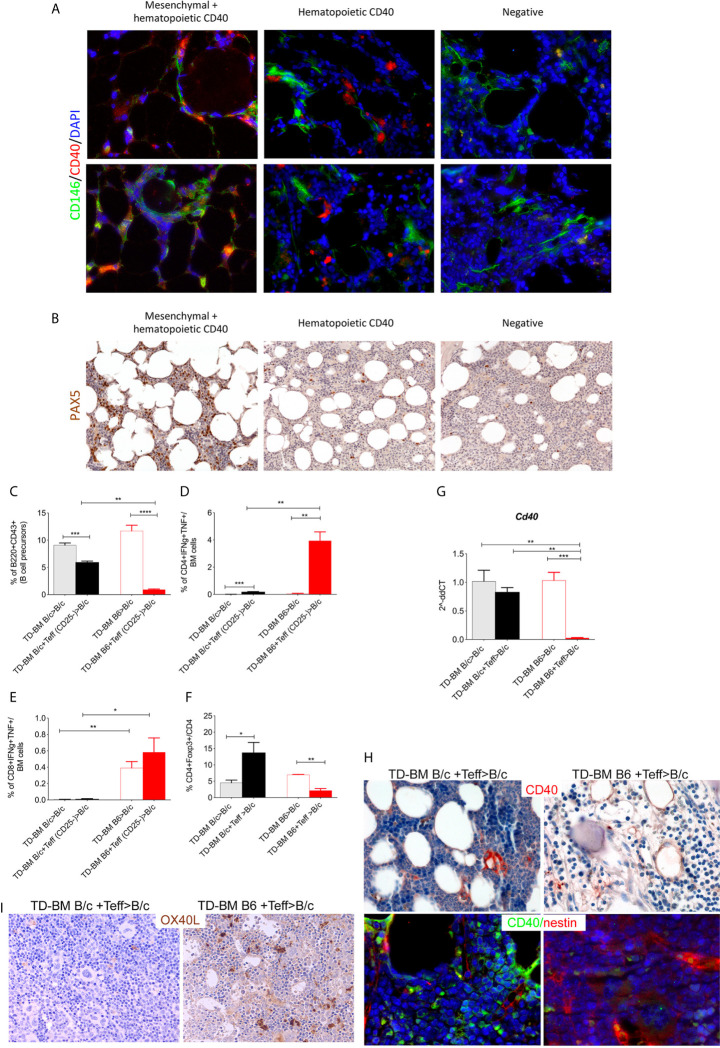
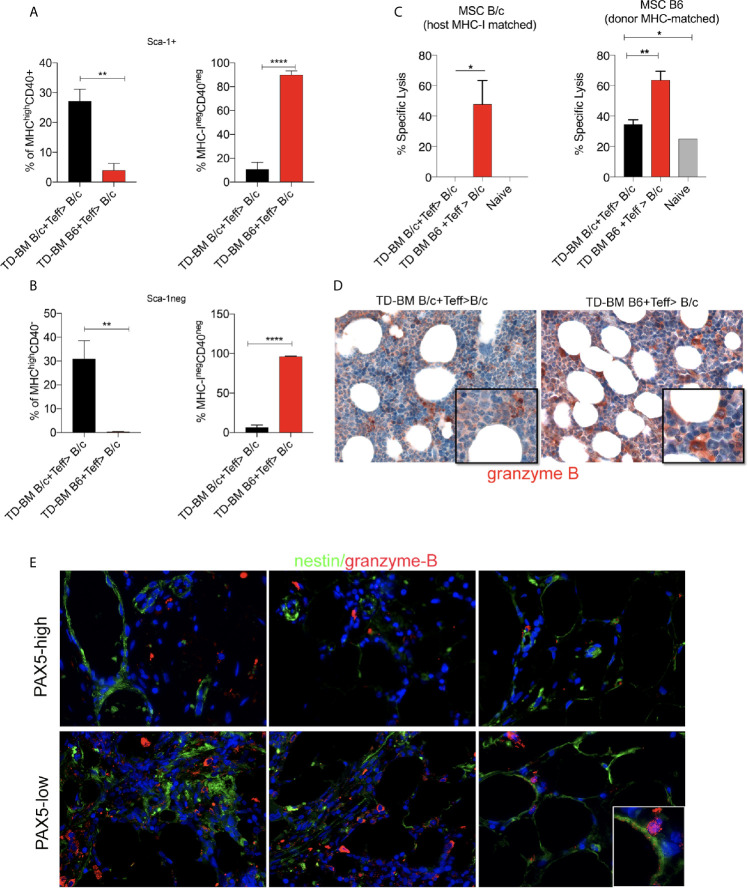
Methods: We studied the role of host radio-resistant cell-derived CD40 in restoring Teff/Treg homeostasis and proper B-cell development in a murine model of BMT. We characterized the host cellular source of CD40 and performed radiation chimera analyses by transplanting WT or Cd40-KO with WT BM in the presence of T-reg and co-infusing WT or - Cd40-KO BM-MSCs. Residual host and donor T cell expansion and activation (cytokine production) and also the expression of Treg fitness markers and conversion to Th17 were analyzed. The presence of Cd40+ BM-MSCs was analyzed in a human setting in correlation with the frequency of B-cell precursors in patients who underwent HSCT and variably developed acute graft-versus-host (aGVDH) disease.

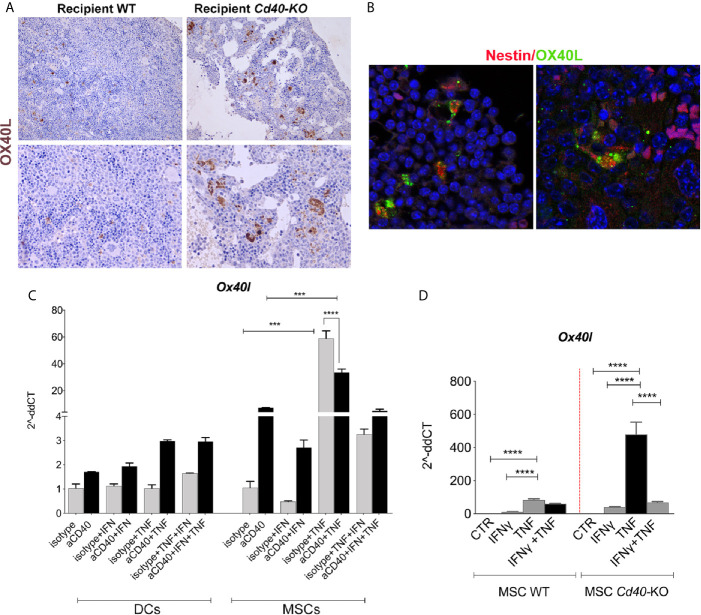
Results: CD40 expression is nearly undetectable in the BM, yet a Cd40-KO recipient of WT donor chimera exhibited impaired B-cell lymphopoiesis and Treg development. Lethal irradiation promotes CD40 and OX40L expression in radio-resistant BM-MSCs through the induction of pro-inflammatory cytokines. OX40L favors Teff expansion and activation at the expense of Tregs; however, the expression of CD40 dampens OX40L expression and restores Treg homeostasis, thus facilitating proper B-cell development. Indeed, in contrast to dendritic cells in secondary lymphoid organs that require CD40 triggers to express OX40L, BM-MSCs require CD40 to inhibit OX40L expression.

Conclusions: CD40+ BM-MSCs are immune regulatory elements within BM. Loss of CD40 results in uncontrolled T cell activation due to a reduced number of Tregs, and B-cell development is consequently impaired. GVHD provides an example of how a loss of CD40+ BM-MSCs and a reduction in B-cell precursors may occur in a human setting.

Keywords: B-cell development; CD40; OX40L; bone marrow transplantation; mesenchymal cell.


Conflict of interest statement

The authors declare that the research was conducted in the absence of any commercial or financial relationships that could be construed as a potential conflict of interest.

Figures

Figure 1
Figure 1
Analysis of B-cell development in WT>WT and WT>Cd40-KO BM chimeras. (A) Cumulative data from PB FACS analysis showing the frequencies of B220+, CD3+, and CD11b+ cells and also the B220/CD3 ratio in the PB of WT>Cd40-KO compared to those of WT>WT BM chimeras. Representative plots and gating strategies are shown in Supplementary Figure 2A . (B) Cumulative FACS analysis of the BM showing the overall decrease in B220+CD43+ and B220+CD43- B-cell subsets in Cd40-KO recipients along with the increase in the frequency of CD11b+ myeloid cells (C) Cumulative data showing the frequency of pre-pro-B and early pro-B precursors (A and B fractions) and of late pro-B and large pre-B precursors (C’-C) in chimeric mice. (D) Cumulative data showing the frequency of B220+CD43+ B-cell precursors in the spleens of Cd40-KO recipient mice. (E) Representative dot plots showing that B220+CD43+ cells are nearly absent in the spleens of WT but not Cd40-KO recipients. (F) Frequency of B220+ B-cells is lower in the spleen of chimeric mice than it is in WT mice. (G) Frequency of B220+CD93+ and B220+CD93- B-cells in the spleens of chimeric mice. Splenic immature B220+CD93+ B-cell are divided into transitional T1, T2, and T3 cells based on expression of CD23 and IgM (T1 = IgM + CD23-, T2 = IgM + CD23+, T3 = IgMlowCD23+). (H) Frequency of MZB and FoB within the gate of B220+CD93- cells is also highlighted. The relative gating strategy is shown in Supplementary Figure 2 . For all panels, the data are derived from 5 mice/group and are representative of one experiment out of 3 performed. Statistical analysis: Student’s t test (*p <0.05, **p < 0.005, ***p < 0.001, ****p < 0.0001). (I) Immunofluorescence analysis showing CD40+ elements in green and B220+ B-cells in red.
Figure 2
Figure 2
Expression of CD40 in the BM microenvironment. (A) Representative image of CD40 IHC staining in the femurs and tibias of WT mice harvested 7 days post-irradiation. (B) FACS analysis showing the up-modulation of CD40 on BM-MSC isolated from irradiated (RAD) and non-irradiated (CTRL) BALB/c (CTRL n=5; RAD n=4) and Cd40-KO mice (CTRL n=5; RAD n=2). *p < 0.05, Mann-Whitney test. (C) FACS analysis showing the up-modulation of CD40 on CD169+ cells isolated from irradiated (RAD) and non-irradiated (CTRL) BALB/c (CTRL n=5; RAD n=4) and Cd40-KO mice (CTRL n=5; RAD n=2) *p < 0.05, Mann-Whitney test. (D) RT-PCR analysis showing the expression of CD40 on primary BM-MSCs (not expanded in vitro) purified from BM at days 4 and 7 post-radiation and compared to basal expression. *p < 0.05, Mann-Whitney test (n=5/group). (E) Cumulative FACS analysis showing the frequency of Sca-1+ and Sca-1- BM-MSCs (CD29+CD44+CD45-Ter119-CD31-CD117-CD34- gate) in irradiated mice (**p < 0.005; Student t test; n=8 for controls and n=10 for irradiated mice). (F) Cumulative FACS analysis showing the frequency of CD73+ and CD40+ BM-MSCs within the Sca-1+ and Sca-1- gate (n=8 for controls and n=10 for irradiated mice). *p < 0.05, **p < 0.005, ***p < 0.001, ****p < 0.0001, Tukey’s multiple comparisons using a one-way ANOVA. (G) Cumulative FACS analysis showing the frequency of CD40+CD73-, CD40+CD73+, and CD40-CD73+ BM-MSCs in irradiated (RAD) vs non-irradiated mice (CTRL). n=8 for controls and n=10 for irradiated mice; **p < 0.005, ***p < 0.001, ****p < 0.0001, Tukey’s multiple comparisons using a one-way ANOVA. (H) Triple marker confocal microscopy analysis showing CD146+ (green, panels above) or CD169+ (panels below) elements in B220+ (red) and CD43+ (blue) cells. Arrows in the two enlargements indicate the spatial localization of B220+ (red arrow) and CD146+ (green arrow panel above) or CD169+ (green arrow panel below) cells. CD43+B220+ double positive cells (asterisk) are B cell precursors. The analysis indicated that B220+ (in part CD43+) exhibits preferential contact with CD146 but not CD169+ cells.
Figure 3
Figure 3
CD40 expression is induced by pro-inflammatory cytokines. (A) FACS analysis showing the frequency of CD4+ within the CD45 cells in lethally irradiated (not reconstituted) or naive mice (n = 4 per group). *p < 0.05, Mann-Whitney test. (B) Absolute number of CD4+ cells within the BM of irradiated (not reconstituted) or naive mice. (n = 4 per group, *p < 0.05, Mann-Whitney test). (C) Frequency of Teffs (CD25-Foxp3−) and Tregs (CD25+Foxp3+) in irradiated mice (CD4 gate) (n = 4 per group). **p < 0.005, ***p < 0.001, compared according to unpaired t test. (D) FACS analysis showing the frequency of Teffs producing IFNγ and TNF (CD4+Foxp3− gate) (n = 4 per group). **p < 0.005, ***p < 0.001, compared according to unpaired t test. (E) Semi-quantitative qPCR analysis showing Cd40 expression on BM-MSCs at 24 h post TNF and IFNg stimulation. ***p < 0.001, ****p <0.0001. (n=3/group, One-way ANOVA, Tukey’s multiple comparison). (F) RT-PCR analysis for CD40 expression in BM-MSCs (ex vivo isolated and in vitro expanded) treated in vitro with IL-1b, G-CSF, GM-CSF+IL-6, IL-17, and TGF-b. (****p <0.0001, One-way ANOVA, Tukey’s multiple comparison). (G) TNF and IFNg stimulation of BM-MSC alters the differentiation program toward osteo-and adipo- lineages. RT-PCR analyses showed that after 24 h, the treatment with 10 ng/ml IFNg and 50 ng/ml TNFa decreased the expression of osteoblast and adipocytes differentiation markers on BM-MSC compared to levels on untreated cells. The combination of TNF and IFNg was additive in decreasing the expression of Spp1 (*p < 0.05, **p < 0.005, ****p < 0.0001, One-way ANOVA, Tukey’s multiple comparison).
Figure 4
Figure 4
Characterization of T-cell status in the Cd40-KO recipient BM chimeras. (A) Frequency of Teffs (CD25-Foxp3−) and (B) Tregs (CD25+Foxp3+) in WT and Cd40-KO irradiated mice (CD4 gate) compared to that in naive control mice (n = 4 per group). **p < 0.005, ***p < 0.001, ****p < 0.0001, Student t test. (C) Representative dot plot showing Tregs in wt and Cd40-KO mice upon irradiation (D) Frequency of Tregs in the BM of WT>WT and WT>Cd40-KO BM chimeras (n = 4 per group, ***p < 0.001, Student t test). (E) Cumulative data and (F) representative dot gating strategy showing the production of IFNγ by CD4+Foxp3− Teffs in the BM of WT>WT and WT>Cd40-KO BM chimeras (n = 4 per group, *p < 0.05, compared according to Student’s t test, one representative experiment out of two performed). (G) Frequency of B220+ cells in the WT>WT and WT>Cd40-KO BM chimeras after lethally irradiating CxB6F1 WT or Cd40-KO mice with lin- cells and spleen-derived Tregs from donor BALB/c mice (n = 5 per group). *p < 0.05, compared according to Student’s t test. (H) Frequency of donor (H-2Kd+Kb-) CD4+Foxp3+ Tregs in the WT>WT and WT>Cd40-KO BM chimeras reconstituted with lin- and Tregs (n = 5 per group). *p < 0.05, compared according to Student’s t test. (I) Cumulative data showing the MFI of Foxp3 on Treg cells. (J) IL-17 production by Foxp3lowTregs in Cd40-KO recipients (n = 5 per group). **p < 0.005, compared according to Student’s t test. (K) Frequency of B-cells in the BM of Cd40-KO and WT mice receiving Lin- cells co-infused with Treg and MSC from WT donors (n= 4/group, p < 0.05; **p < 0.005, One-way ANOVA, Dunnett’s multiple comparison test). (L) Frequency of IFNγ−producing CD4+ cells in BM transplanted Cd40-KO and WT mice receiving Lin- cells co-infused with Treg and MSC from WT donors (n= 4/group, p < 0.05; **p < 0.005, One-way ANOVA, Dunnett’s multiple comparison test).
Figure 5
Figure 5
OX40L release is negatively regulated by CD40 triggering. (A) Representative images of OX40L staining in BM sections of the WT>WT and WT>Cd40-KO BM chimeras. (B) IF revealed the co-localization between nestin (BM-MSC marker, red) and OX40L (green). (C) ox40l expression in Dendritic cells (DCs) and BM-MSCs stimulated with IFN-γ 10 ng/ml, TNF-α 50 ng/ml, and aCD40 mAb or with isotype control (5 μg/ml) for 24 h (n = 3/group, one-way ANOVA, Tukey’s mupltiple comparison). (D) Quantitative RT-PCR analysis for Ox40l in WT and Cd40-KO BM-MSCs treated in vitro with IFN-γ, TNF-α, or their combination (***p < 0.001, ****p < 0.0001, ANOVA, Tukey’s multiple comparison).
Figure 6
Figure 6
Lack of CD40+ BM-MSCs in BOM from aGVHD patients. (A) Representative double-marker immunofluorescence analysis for CD40 (red) and CD146 (green) showing that CD40 expression is shared by CD146+ mesenchymal elements (red arrows) or confined to CD146- hematopoietic cells (white arrows). (B) Pax5 IHC showing a variable expression of Pax5, where the highest fractions of Pax5+ cells were observed in cases in which CD40 was expressed also in the mesenchymal cells. Patient characteristics and quantitative IHC data are included in Supplementary Table 1 . Frequency of B220+CD43+ B-cell precursors (C), CD4+Foxp3− Teffs (D), and CD8+ (E) T-cells releasing IFNγ and TNF and the frequency of CD4+Foxp3+ Tregs (F) in aGVHD mice (TD-BM B6+Teff> B/c) compared to those characteristics in control animals. Controls were comprised of mice that did not receive MHC-mismatched Teff (TD-BM B6 > B/c) or MHC-matched BM chimeras (TD-BM B/c+/-Teff> B/c) (*p < 0.05, ***p < 0.001, ****p < 0.0001, one-way ANOVA, Tukey’s multiple comparison; n=4/group, one representative experiment out of 3 performed). (G) qPCR analysis of Cd40 expression in BM-MSCs isolated from aGVHD and control mice. **p < 0.005, ***p < 0.001, compared according to ANOVA, Tukey’s multiple comparison. (H) Representative CD40 IHC and co-immunofluorescence analysis for CD40 (green) and nestin (red) in BM sections from aGVHD (TD-BM B6 + Teff>BALB/c) compared to levels in controls (TD-BM B/c + Teff>B/c). (I) Representative OX40L IHC staining in aGVHD mice (TD-BM B6 + Teff>BALB/c) compared to levels in controls (TD-BM BALB/c + Teff>BALB/c).
Figure 7
Figure 7
Downregulation of CD40 expression in the BM-MSCs of aGVHD mice. (A) Frequency of MHChighCD40+, MHCnegCD40neg BM-MSCs in the Sca-1+ gate of Lin-CD44+CD29+ BM-MSCs in aGVHD (TD-BM B6 + Teff>BALB/c) vs control (TD-BM BALB/c + Teff>BALB/c) mice. The analysis was performed at 14 days post-transplantation. **p < 0.005, ****p < 0.0001, compared according to Student’s t test (n=3/group). (B) Frequency of MHChighCD40+, MHCnegCD40neg BM-MSCs in the Sca-1 negative gate of Lin-CD44+CD29+ BM-MSCs in aGVHD (TD-BM B6 + Teff>B/c) vs control (TD-BM B/c + Teff>B/c) mice. The analysis was performed at 14 days post-transplantation. **p < 0.005, ****p < 0.0001, compared according to Student’s t test. (n = 3/group). (C) Cytotoxicity assay performed on MSCs incubated with splenocytes freshly isolated from aGVHD (TD-BM B6 + Teff>B/c) or from controls (TD-BM B/c + Teff>B/c), *p < 0.05, **p < 0.005; (D) Representative granzyme B IHC staining of BM biopsies from aGVHD mice (TD-BM B6 + Teff>B/c) compared to that of controls (TD-BM B/c + Teff>B/c) (**p< 0.005, one-way ANOVA, Tukey’s multiple comparison). (E) Representative double-marker immunofluorescence analysis for granzyme B (red) and nestin (green) showing the co-localization between granzyme B and nestin+ elements in PAX-5-low patients.

Similar articles

Cited by

References

    1. Schirrmacher V, Feuerer M, Fournier P, Ahlert T, Umansky V, Beckhove P. T-Cell Priming in Bone Marrow: The Potential for Long-Lasting Protective Anti-Tumor Immunity. Trends Mol Med (2003) 9(12):526–34. 10.1016/j.molmed.2003.10.001 - DOI - PubMed
    1. Pietras EM. Inflammation: A Key Regulator of Hematopoietic Stem Cell Fate in Health and Disease. Blood (2017) 130(15):1693–8. 10.1182/blood-2017-06-780882 - DOI - PMC - PubMed
    1. Pierini A, Nishikii H, Baker J, Kimura T, Kwon HS, Pan Y, et al. . Foxp3(+) Regulatory T Cells Maintain the Bone Marrow Microenvironment for B Cell Lymphopoiesis. Nat Commun (2017) 8:15068. 10.1038/ncomms15068 - DOI - PMC - PubMed
    1. Baratono SR, Chu N, Richman LP, Behrens EM. Toll-Like Receptor 9 and Interferon-Gamma Receptor Signaling Suppress the B-cell Fate of Uncommitted Progenitors in Mice. Eur J Immunol (2015) 45(5):1313–25. 10.1002/eji.201445319 - DOI - PMC - PubMed
    1. Kim S, Park K, Choi J, Jang E, Paik DJ, Seong RH, et al. . Foxp3+ Regulatory T Cells Ensure B Lymphopoiesis by Inhibiting the Granulopoietic Activity of Effector T Cells in Mouse Bone Marrow. Eur J Immunol (2015) 45(1):167–79. 10.1002/eji.201444532 - DOI - PubMed

Publication types

MeSH terms