. 2021 May;10(7):e12109.
doi: 10.1002/jev2.12109. Epub 2021 May 24.

Apoptotic vesicles restore liver macrophage homeostasis to counteract type 2 diabetes

Affiliations

Apoptotic vesicles restore liver macrophage homeostasis to counteract type 2 diabetes

Chenxi Zheng et al. J Extracell Vesicles. 2021 May.

Abstract

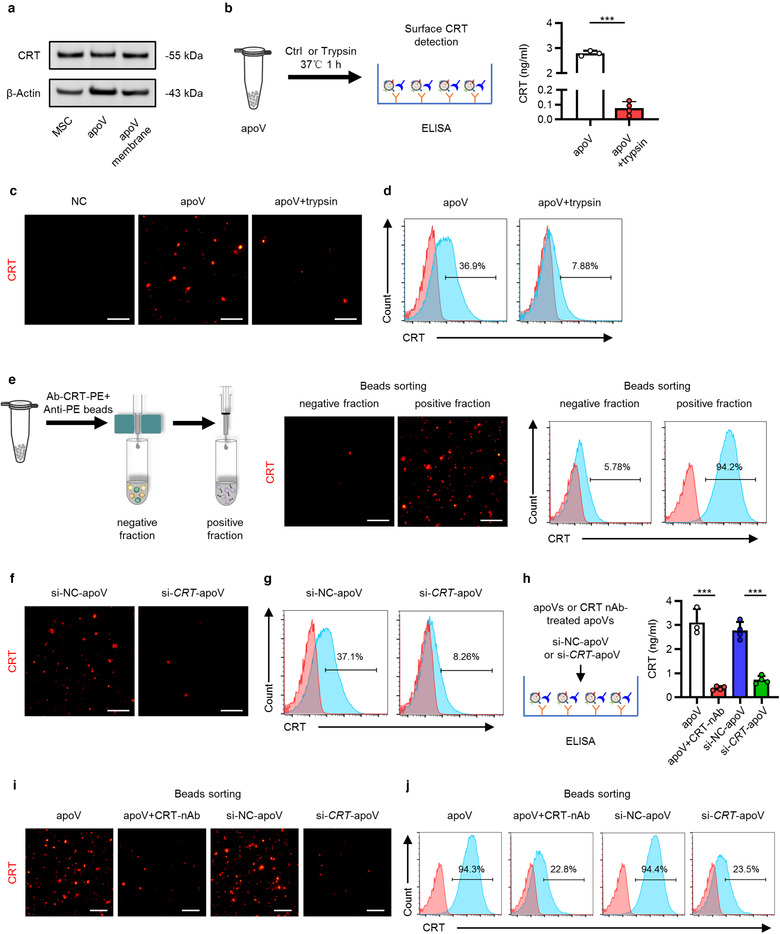
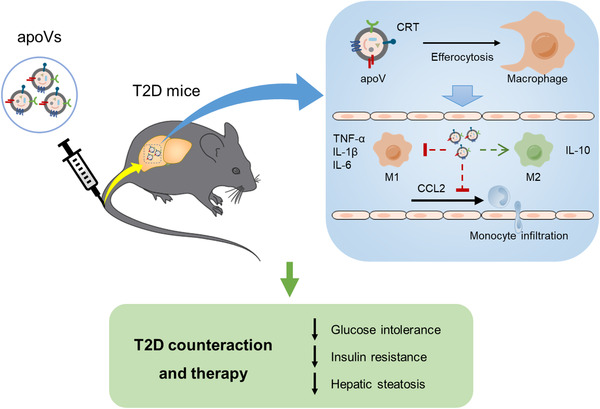
Apoptosis is a naturally occurring process generating plenty of apoptotic vesicles (apoVs), but the feature, fate and function of apoVs remain largely unknown. Notably, as an appealing source for cell therapy, mesenchymal stem cells (MSCs) undergo necessary apoptosis and release apoVs during therapeutic application. In this study, we characterized and used MSC-derived apoVs to treat type 2 diabetes (T2D) mice, and we found that apoVs were efferocytosed by macrophages and functionally modulated liver macrophage homeostasis to counteract T2D. We showed that apoVs can induce macrophage reprogramming at the transcription level in an efferocytosis-dependent manner, leading to inhibition of macrophage accumulation and transformation of macrophages towards an anti-inflammation phenotype in T2D liver. At the molecular level, we discovered that calreticulin (CRT) was exposed on the surface of apoVs to act as a critical 'eat-me' signal mediating apoV efferocytosis and macrophage regulatory effects. Importantly, we demonstrated that CRT-mediated efferocytosis of MSC-derived apoVs contributes to T2D therapy with alleviation of T2D phenotypes including glucose intolerance and insulin resistance. These findings uncover that functional efferocytosis of apoVs restores liver macrophage homeostasis and ameliorates T2D.

Keywords: apoptotic vesicles; calreticulin; efferocytosis; macrophages; mesenchymal stem cells; type 2 diabetes.


Conflict of interest statement

The authors declare no conflicts of interest.

Figures

FIGURE 1
FIGURE 1
Characterization and proteomic analysis of mesenchymal stem cell (MSC)‐derived apoptotic vesicles (apoVs). (a) Representative transmission electron microscope (TEM) image showing the morphology of apoVs. Scale bar, 125 nm. (b) Nanoparticle tracking analysis (NTA) showing the size distribution of apoVs. (c) Western blotting analysis showing the presence of Caspase‐3/Cleaved Caspase‐3 in MSCs and apoVs. (d) Representative confocal microscopy images and flow cytometric analysis of Annexin V (green) staining in apoVs. Scale bars, 10 μm. (e) Hierarchical clustering of differentially expressed proteins (DEPs) (Fold change > 1.5 and Q value < 0.05) between MSCs and apoVs, with protein abundance being Z‐score normalized. Rows represent proteins and columns represent individual replicates. (f) Volcano plot showing significantly upregulated (red dots) and downregulated (blue dots) proteins in apoVs, compared to MSCs. (g) Gene ontology (GO) analysis of significantly upregulated proteins in apoVs, categorized into ‘Cellular component’, ‘Molecular function’ and ‘Biological process’. (h) GO enrichment analysis of significantly upregulated proteins in apoVs. The top twenty enriched terms of the three categories in (g) were respectively presented as bubble charts. The Y‐axis represents GO terms and the X‐axis represents rich factor. The colour of the bubble represents enrichment significance and the size of the bubble represents number of upregulated proteins. (i) Kyoto Encyclopedia of Genes and Genomes (KEGG) pathway analysis of significantly upregulated proteins in apoVs
FIGURE 2
FIGURE 2
Efferocytosis of MSC‐derived apoVs induces transcriptional reprogramming in bone marrow‐derived macrophages (BMDMs). (a) Representative confocal orthogonal view showing uptake of PKH26‐labeded apoVs (red) by BMDMs (green), counterstained by Hoechst (blue). Scale bar, 20 μm. (b) Representative confocal microscopy images showing time‐dependent and concentration‐dependent uptake of PKH26‐labeded apoVs (red) by BMDMs (green), counterstained by Hoechst (blue). After removal of unbound PKH, the stained apoVs were resuspended in PBS and underwent centrifugation, after which the supernatant was used as the negative control (NC) and added to BMDMs. Scale bars, 25 μm. (c) Flow cytometric analysis of time‐dependent and concentration‐dependent uptake of PKH67‐labeded apoVs by macrophages. NC was prepared as stated above. (d) Hierarchical clustering of differentially expressed genes (DEGs) (Fold change > 1.5 and Q value < 0.05) between BMDMs and apoV‐treated BMDMs (BMDM+apoV), with gene abundance being Z‐score normalized. Rows represent genes and columns represent individual replicates. (e) Volcano plot showing DEGs in BMDM+apoV compared to BMDMs. The blue and red dots indicate downregulated and upregulated genes, respectively. (f) Gene ontology (GO) analysis of the DEGs in (e), categorized into ‘Cellular component’, ‘Molecular function’ and ‘Biological process’. (g) ‘Biological process’ enrichment analysis of the DEGs in (e). The top twenty enriched terms were presented as a bubble chart. The Y‐axis represents GO terms and the X‐axis represents rich factor. The colour of the bubble represents enrichment significance and the size of the bubble represents the number of DEGs. (h) Kyoto Encyclopedia of Genes and Genomes (KEGG) pathway analysis of the DEGs in (e). The number of genes annotated into different categories is shown. (i) KEGG pathway enrichment analysis of the DEGs in (e). The enriched KEGG pathways were presented as a bar chart. The Y‐axis represents KEGG pathways and the X‐axes represents number of DEGs (top) and enrichment significance (low), respectively. (j) Protein‐protein interaction (PPI) network analysis of the DEGs belonging to the enriched KEGG pathways in (i)
FIGURE 3
FIGURE 3
Efferocytosis of MSC‐derived apoVs by liver macrophages alleviates macrophage infiltration in the type 2 diabetes (T2D) liver. (a) Representative confocal microscopy images showing distribution of PKH26‐labeled apoVs (red) in the liver, counterstained by Hoechst (blue). After removal of unbound PKH, the stained apoVs were resuspended in PBS and underwent centrifugation, after which the supernatant was used as the negative control (NC) and injected. Scale bars, 50 μm. (b) Representative confocal microscopy images showing uptake of apoVs (red) by macrophages (green) in the liver, counterstained by Hoechst (blue). Scale bars, 50 μm in low magnification images and 25 μm in high magnification images. (c) Flow cytometric analysis showing the uptake of apoVs by macrophages in the liver. KCs, Kupffer cells; MoMFs, monocyte‐derived macrophages. (d) Representative immunofluorescent (IF) staining images of F4/80 (green) and CD11b (green) in the liver, counterstained by Hoechst (blue). Ctrl, control mice; DIO, mice with diet‐induced obesity; apoV, DIO mice treated by apoVs. Scale bars, 50 μm. (e) Flow cytometric analysis and the corresponding quantification of the percentages of KCs and MoMFs in hepatic CD45+ cells. N = 6 per group. (f) Representative IF staining images of chemokine (C‐C motif) ligand 2 (CCL2) (red) in the liver, counterstained by Hoechst (blue). Scale bars, 50 μm. (g) Enzyme‐linked immunosorbent assay (ELISA) analysis of CCL2 in liver lysate and serum. N = 6 per group. (h) Schematic diagram showing systemic injection of apoVs into mice which undergo blood flow cytometric analysis. (i) Flow cytometric analysis and the corresponding quantification of the percentages of monocytes in the peripheral blood CD45+ cells. N = 6 per group. (j) Schematic diagram showing injection and in vivo tracking of PKH67‐labeled bone marrow monocytes. (k) Flow cytometric analysis and the corresponding quantification of the percentages of PKH67‐labeled monocytes migrating to the liver. N = 4 per group. Data are presented as mean ± standard deviation (SD). Statistical analyses are performed by One‐way ANOVA with Tukey's post hoc test or Welch's ANOVA with Tamhane's T2 post hoc test. *, P < 0.05; ***, P < 0.001; NS, P > 0.05
FIGURE 4
FIGURE 4
Efferocytosis of MSC‐derived apoVs by liver macrophages alleviates macrophage activation in the T2D liver. (a) Representative immunofluorescent (IF) staining images of tumor necrosis factor‐alpha (TNF‐α) (red) and CD206 (green) in the liver, counterstained by Hoechst (blue), and the corresponding quantification of fold changes over the Ctrl group. Ctrl, control mice; DIO, mice with diet‐induced obesity; apoV, DIO mice treated by apoVs. Scale bars, 50 μm. N = 6 per group. (b‐e) Quantitative real time polymerase chain reaction (qRT‐PCR) analysis of the mRNA expression levels of Tnf (b), interleukin 1 beta (Il1b) (c), interleukin 6 (Il6) (d) and interleukin 10 (Il10) (e) in the liver, normalized to β‐actin (Actb), and quantification of fold changes over the Ctrl group. N = 4–5 per group. (f, g) Enzyme‐linked immunosorbent assay (ELISA) analysis of TNF‐α (f) and IL‐10 (g) in serum. N = 6 per group. (h) Schematic diagram showing that efferocytosis of apoVs inhibits macrophage accumulation and activation in the liver of DIO mice. M1, pro‐inflammatory macrophages; M2, anti‐inflammatory macrophages. Data are presented as mean ± standard deviation (SD). Statistical analyses are performed by One‐way ANOVA with Tukey's post hoc test. *, P < 0.05; **, P < 0.01; ***, P < 0.001
FIGURE 5
FIGURE 5
Surface expression of calreticulin (CRT) on apoVs. (a) Western blotting analysis showing the presence of CRT in membrane proteins of apoVs as well as in total proteins of MSCs and apoVs. (b) Schematic diagram showing detection of surface CRT via enzyme‐linked immunosorbent assay (ELISA) analysis and quantification of the concentration of CRT. apoV+trypsin, apoVs pre‐treated with trypsin at 37℃ for 1 h. N = 3–4 per group. (c) Representative immunofluorescent (IF) staining images of CRT (red) on apoVs. ApoVs incubated with only secondary antibody was used as the negative control (NC). Scale bars, 30 μm. (d) Flow cytometric analysis of CRT on the surface of apoVs. (e) Enrichment of CRT‐positive apoV subpopulations via magnetic beads sorting. Left: schematic diagram; Medium: fluorescent images of CRT (red); Right: flow cytometric analysis of CRT. Scale bars, 30 μm. (f) Representative IF staining images of CRT (red). si‐NC‐apoV, apoVs derived from MSCs treated by siRNA‐NC; si‐CRT‐apoV, apoVs derived from MSCs treated by siRNA‐CRT. Scale bars, 30 μm. (g) Flow cytometric analysis of CRT on the surface of apoVs. (h) ELISA analysis of CRT on the surface of apoVs. apoV+CRT‐nAb, apoVs pre‐treated with CRT neutralizing antibody at 37℃ for 1 h. N = 3–4 per group. (i) Representative fluorescent images of CRT (red) after magnetic beads sorting of CRT‐positive apoV subpopulations. Scale bars, 30 μm. (j) Flow cytometric analysis of CRT on the surface of apoVs after magnetic beads sorting of CRT‐positive apoV subpopulations. Data are presented as mean ± standard deviation (SD). Statistical analyses are performed by Student's t test (two‐tailed). ***, P < 0.001
FIGURE 6
FIGURE 6
CRT blockade inhibits functional efferocytosis of MSC‐derived apoVs by T2D macrophages in vitro. (a) Representative confocal microscopy images showing uptake of apoVs (red) by bone marrow‐derived macrophages (BMDMs) (green) in vitro, counterstained by Hoechst (blue), and the corresponding quantification of fold changes of relative fluorescence intensity. apoV+CRT‐nAb, apoVs pre‐treated with CRT neutralizing antibody at 37℃ for 1 h. Scale bars, 25 μm. N = 5–6 per group. (b) Flow cytometric analysis showing uptake of apoVs by BMDMs in vitro, and the corresponding quantification of fold changes of mean fluorescence intensity (MFI). N = 6 per group. (C‐E) Quantitative real time polymerase chain reaction (qRT‐PCR) analysis of mRNA expression levels of tumor necrosis factor (Tnf) (c), interleukin 1 beta (Il1b) (d) and nitric oxide synthase 2, inducible (Nos2) (e) in cultured BMDMs, normalized to β‐actin (Actb), and quantification of fold changes over the Ctrl group. Ctrl, BMDMs derived from control mice; DIO, BMDMs derived from mice with diet‐induced obesity; apoV, BMDMs derived from DIO mice and treated with apoVs; apoV+CRT‐nAb, BMDMs derived from DIO mice and treated with apoVs which were pre‐treated with CRT‐nAb. N = 3–4 per group. (f) Enzyme‐linked immunosorbent assay (ELISA) analysis of TNF‐α in media from cultured BMDMs. N = 4 per group. (g‐i) qRT‐PCR analysis of mRNA expression levels of interleukin 10 (Il10) (g), mannose receptor, C type 1 (Mrc1) (h) and resistin like alpha (Retnla) (i) in cultured BMDMs, normalized to Actb, and quantification of fold changes over the Ctrl group. N = 3–4 per group. (j) ELISA analysis of IL‐10 in media from cultured BMDMs. N = 4 per group. (k) qRT‐PCR analysis of mRNA expression levels of chemokine (C‐C motif) ligand 2 (Ccl2) in cultured BMDMs, normalized to Actb, and quantification of fold changes over the Ctrl group. N = 3–4 per group. (l) ELISA analysis of CCL2 in media from cultured BMDMs. N = 4 per group. (m) Representative confocal microscopy images showing uptake of apoVs (red) by macrophages (green) in the liver, counterstained by Hoechst (blue). Scale bars, 25 μm. Data are presented as mean ± standard deviation (SD). Statistical analyses are performed by Student's t test with Welch correction (two‐tailed) for two group comparisons and One‐way ANOVA with Tukey's post hoc test for multiple group comparisons. *, P < 0.05; **, P < 0.01; ***, P < 0.001
FIGURE 7
FIGURE 7
CRT downregulation inhibits functional efferocytosis of MSC‐derived apoVs by T2D macrophages in vitro. (a) Representative confocal microscopy images showing uptake of apoVs (red) by bone marrow‐derived macrophages (BMDMs) (green) in vitro, counterstained by Hoechst (blue), and the corresponding quantification of fold changes of relative fluorescence intensity. si‐NC‐apoV, apoVs derived from MSCs treated by siRNA‐negative control; si‐CRT‐apoV, apoVs derived from MSCs treated by siRNA‐CRT. Scale bars, 25 μm. N = 5–6 per group. (b) Flow cytometric analysis showing uptake of apoVs by BMDMs in vitro, and the corresponding quantification of fold changes of mean fluorescence intensity (MFI). N = 6 per group. (C‐E) Quantitative real time polymerase chain reaction (qRT‐PCR) analysis of the mRNA expression levels of tumor necrosis factor (Tnf) (c), interleukin 1 beta (Il1b) (d) and nitric oxide synthase 2, inducible (Nos2) (e) in cultured BMDMs, normalized to β‐actin (Actb), and quantification of fold changes over the Ctrl group. Ctrl, BMDMs derived from control mice; DIO, BMDMs derived from mice with diet‐induced obesity; si‐NC‐apoV, BMDMs derived from DIO mice and treated with si‐NC‐apoVs; si‐CRT‐apoV, BMDMs derived from DIO mice and treated with si‐CRT‐apoVs. N = 3–4 per group. (f) Enzyme‐linked immunosorbent assay (ELISA) analysis of TNF‐α in media from cultured BMDMs. N = 4 per group. (G‐I) qRT‐PCR analysis of mRNA expression levels of interleukin 10 (Il10) (g), mannose receptor, C type 1 (Mrc1) (h) and resistin like alpha (Retnla) (i) in cultured BMDMs, normalized to Actb, and quantification of fold changes over the Ctrl group. N = 3–4 per group. (j) ELISA analysis of IL‐10 in media from cultured BMDMs. N = 4 per group. (k) qRT‐PCR analysis of mRNA expression levels of chemokine (C‐C motif) ligand 2 (Ccl2) in cultured BMDMs, normalized to Actb, and quantification of fold changes over the Ctrl group. N = 3–4 per group. (l) ELISA analysis of CCL2 in media from cultured BMDMs. N = 4 per group. (m) Representative confocal microscopy images showing uptake of apoVs (red) by macrophages (green) in the liver, counterstained by Hoechst (blue). Scale bars, 25 μm. Data are presented as mean ± standard deviation (SD). Statistical analyses are performed by Student's t test (two‐tailed) or Student's t test with Welch correction (two‐tailed) for two group comparisons and One‐way ANOVA with Tukey's post hoc test for multiple group comparisons. *, P < 0.05; **, P < 0.01; ***, P < 0.001
FIGURE 8
FIGURE 8
CRT mediates efferocytosis of MSC‐derived apoVs to modulate T2D liver macrophages in vivo. (a) Representative immunofluorescent (IF) staining images of F4/80 (green) and CD11b (green) in the liver, counterstained by Hoechst (blue). DIO, mice with diet‐induced obesity; si‐NC‐apoV, DIO mice treated by apoVs derived from MSCs transfected by siRNA‐negative control; si‐CRT‐apoV, DIO mice treated by apoVs derived from MSCs transfected by siRNA‐CRT. Scale bars, 50 μm. (b) Flow cytometric analysis and the corresponding quantification of the percentages of KCs and MoMFs in hepatic CD45+ cells. KCs, Kupffer cells; MoMFs, monocyte‐derived macrophages. N = 5–6 per group. (c) Representative IF staining images of chemokine (C‐C motif) ligand 2 (CCL2) (red) in the liver, counterstained by Hoechst (blue). Scale bars, 50 μm. (d and e) ELISA analysis of CCL2 in liver lysate (d) and serum (e). N = 6 per group. (f and g) Representative IF staining images of tumor necrosis factor‐alpha (TNF‐α) (red) and CD206 (green) in the liver, counterstained by Hoechst (blue), and the corresponding quantification of fold changes over the DIO group. Scale bars, 50 μm. N = 5–6 per group. (h and i) Quantitative real time polymerase chain reaction (qRT‐PCR) analysis of mRNA expression levels of Tnf (h) and interleukin 10 (Il10) (i) in the liver, normalized to β‐actin (Actb), and quantification of fold changes over the DIO group. N = 5 per group. (j and k) Enzyme‐linked immunosorbent assay (ELISA) analysis of TNF‐α (j) and IL‐10 (k) in serum. N = 6 per group. Data are presented as mean ± standard deviation (SD). Statistical analyses are performed by One‐way ANOVA with Tukey's post hoc test or Kruskal‐Wallis H test. *, P < 0.05; **, P < 0.01; ***, P < 0.001; NS, P > 0.05
FIGURE 9
FIGURE 9
CRT‐mediated efferocytosis of MSC‐derived apoVs contributes to T2D therapy. (a) Schematic diagram indicating the study design of apoV efferocytosis‐mediated treatment for T2D in C57 mice. DIO, diet‐induced obesity; si‐NC‐apoVs, apoVs derived from MSCs treated by siRNA‐negative control; si‐CRT‐apoVs, apoVs derived from MSCs treated by siRNA‐CRT; GTT, glucose tolerance test; ITT, insulin tolerance test. (b) Blood glucose levels during GTT and quantification of area under the curve (AUC). Ctrl, control mice; DIO, mice with DIO; si‐NC‐apoV, DIO mice treated by si‐NC‐apoVs; si‐CRT‐apoV, DIO mice treated by si‐CRT‐apoVs. *, comparison between DIO and si‐NC‐apoV; #, comparison between si‐NC‐apoV and si‐CRT‐apoV. N = 6 per group. (c) Blood glucose levels during ITT and quantification of AUC. *, comparison between DIO and si‐NC‐apoV; #, comparison between si‐NC‐apoV and si‐CRT‐apoV. N = 6 per group. (d) Western blotting analysis of the expression levels of phosphorylated AKT (p‐AKT) and AKT in liver tissues. (e) Representative haematoxylin and eosin (H&E) and oil red O (ORO) staining images of liver tissues. Scale bars, 100 μm (top) and 25 μm (bottom). (f) Quantification of liver triglyceride (TG) and total cholesterol (TC) levels. N = 6 per group. (g) Quantitative real time polymerase chain reaction (qRT‐PCR) analysis of mRNA expression levels of fatty acid synthase (Fasn) and peroxisome proliferator‐activated receptor gamma (Pparg) in the liver, normalized to β‐actin (Actb), and quantification of fold changes over the Ctrl group. N = 4 per group. Data are presented as mean ± standard deviation (SD). Statistical analyses are performed by One‐way ANOVA with Tukey's post hoc test or Kruskal‐Wallis H test. *, P < 0.05; **, P < 0.01; ***, P < 0.001; ##, P < 0.01; ###, P < 0.001; NS, P > 0.05
FIGURE 10
FIGURE 10
Schematic diagram showing the synopsis of the findings. Systemic infusion of MSC‐derived apoVs modulates liver macrophage function via calreticulin (CRT)‐mediated efferocytosis, thus providing a promising therapy for T2D. M1, pro‐inflammatory macrophages; M2, anti‐inflammatory macrophages; TNF‐α, tumor necrosis factor‐alpha; IL‐1β, interleukin‐1 beta; IL‐6, interleukin‐6; IL‐10, interleukin‐10; CCL2, chemokine (C‐C motif) ligand 2

References

    1. Baeck, C. , Wehr, A. , Karlmark, K. R. , Heymann, F. , Vucur, M. , Gassler, N. , Huss, S. , Klussmann, S. , Eulberg, D. , Luedde, T. , Trautwein, C. , & Tacke, F. (2012). Pharmacological inhibition of the chemokine CCL2 (MCP‐1) diminishes liver macrophage infiltration and steatohepatitis in chronic hepatic injury. Gut, 61(3), 416–426. - PubMed
    1. Barnes, E. , Ward, S M. , Kasprowicz, V O. , Dusheiko, G. , Klenerman, P. , & Lucas, M. (2004). Ultra‐sensitive class I tetramer analysis reveals previously undetectable populations of antiviral CD8+ T cells. European Journal of Immunology, 34(6), 1570–1577. - PubMed
    1. Bianco, P. , Cao, Xu , Frenette, P. S. , Mao, J. J. , Robey, P. G. , Simmons, P. J. , & Wang, C‐Yu (2013). The meaning, the sense and the significance: translating the science of mesenchymal stem cells into medicine. Nature Medicine, 19(1), 35–42. - PMC - PubMed
    1. Boada‐Romero, E. , Martinez, J. , Heckmann, B. L. , & Green, D. R. (2020). The clearance of dead cells by efferocytosis. Nature Reviews Molecular Cell Biology, 21(7), 398–414. - PMC - PubMed
    1. Brock, C. K. , Wallin, S. T. , Ruiz, O. E. , Samms, K. M. , Mandal, A. , Sumner, E. A. , & Eisenhoffer, G. T. (2019). Stem cell proliferation is induced by apoptotic bodies from dying cells during epithelial tissue maintenance. Nature communications, 10(1), 1044. - PMC - PubMed

Publication types