. 2019 Dec 2;11(4):1140-1152.
doi: 10.1039/c9sc03754c.

Large scale relative protein ligand binding affinities using non-equilibrium alchemy

Affiliations

Large scale relative protein ligand binding affinities using non-equilibrium alchemy

Vytautas Gapsys et al. Chem Sci. .

Abstract

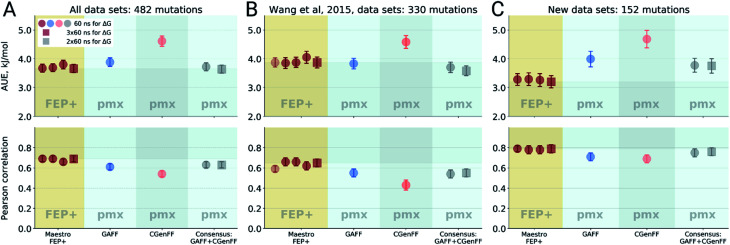
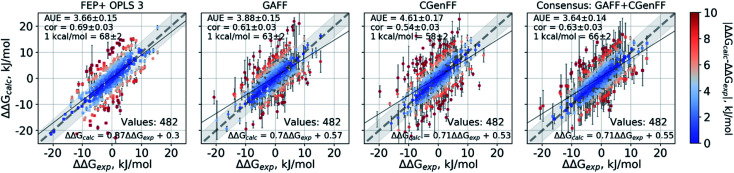
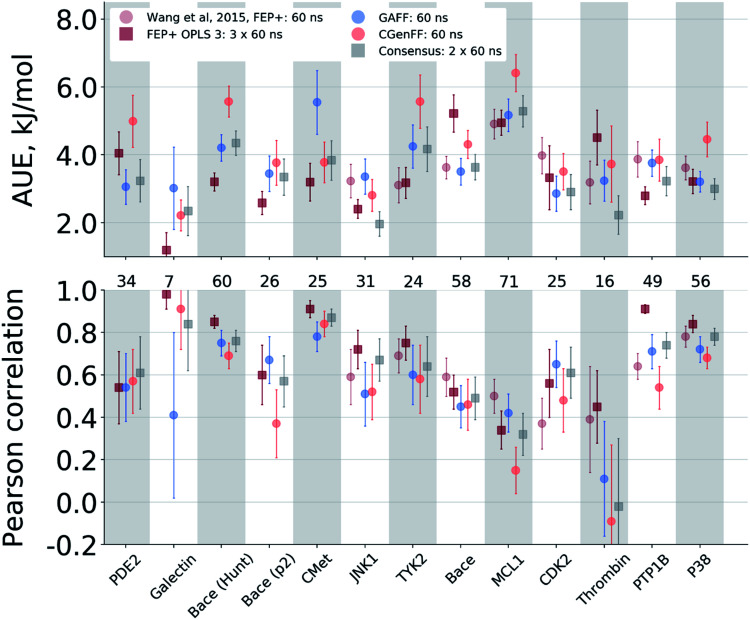
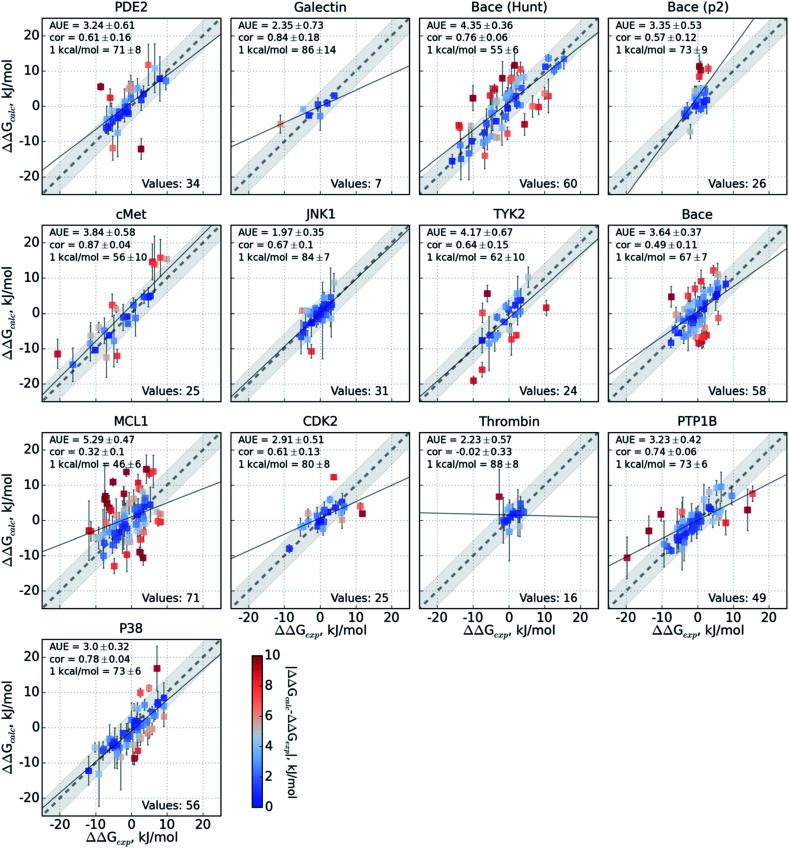
Ligand binding affinity calculations based on molecular dynamics (MD) simulations and non-physical (alchemical) thermodynamic cycles have shown great promise for structure-based drug design. However, their broad uptake and impact is held back by the notoriously complex setup of the calculations. Only a few tools other than the free energy perturbation approach by Schrödinger Inc. (referred to as FEP+) currently enable end-to-end application. Here, we present for the first time an approach based on the open-source software pmx that allows to easily set up and run alchemical calculations for diverse sets of small molecules using the GROMACS MD engine. The method relies on theoretically rigorous non-equilibrium thermodynamic integration (TI) foundations, and its flexibility allows calculations with multiple force fields. In this study, results from the Amber and Charmm force fields were combined to yield a consensus outcome performing on par with the commercial FEP+ approach. A large dataset of 482 perturbations from 13 different protein-ligand datasets led to an average unsigned error (AUE) of 3.64 ± 0.14 kJ mol-1, equivalent to Schrödinger's FEP+ AUE of 3.66 ± 0.14 kJ mol-1. For the first time, a setup is presented for overall high precision and high accuracy relative protein-ligand alchemical free energy calculations based on open-source software.


Conflict of interest statement

There are no conflicts to declare.

Figures

Fig. 1
Fig. 1. Average unsigned errors (AUE, upper plots) and correlations (lower plots) between the calculated and experimentally measured double free energy differences. In the FEP+ panels, the dark red circles represent the three separate replica calculations, and the dark red square the results when the ΔΔG values per ligand are averaged over the three replicas. For the pmx GAFF and CGenFF panels, the circle symbols denote results averaged over three replicas (60 ns per ΔG in total). In the consensus panel, the results were averaged to correspond to 60 ns (circle) and 2 × 60 ns (square) of sampling time per ΔG estimate. (A) Averaging performed over all the investigated protein–ligand complexes; 482 ligand modifications in total. (B) Subset of systems analyzed by Wang et al.; 330 ligand modifications. The light red circle in this panel corresponds to the result reported by Wang et al. (C) Subset of systems added in this work; 152 ligand modifications.
Fig. 2
Fig. 2. Calculated ΔΔG values plotted against the experimental measurements considering all 482 ligand modifications investigated in this work. The FEP+ calculations used 3 replicas of 60 ns each for every ΔG estimate. The pmx-based calculations with GAFF and CGenFF used 3 replicas of 20 ns each, i.e. summing to 60 ns per ΔG estimate. The consensus results shown here use 2 × 60 ns per ΔG estimate. Text in the panels: AUE is in kJ mol−1; “cor” is Pearson correlation; “1 kcal/mol” denotes the percentage of the estimates that fall within 1 kcal mol−1 (4.184 kJ mol−1) of the experimental measurement; “values” refers to the total number of perturbations.
Fig. 3
Fig. 3. Average unsigned error (AUE) and Pearson correlation for the ΔΔG estimates split by protein–ligand system. The numbers in between the top and bottom panels denote the number of ligand modifications considered for the corresponding system.
Fig. 4
Fig. 4. Performance of the pmx-based consensus force field calculations for each protein–ligand system studied. The ΔΔG estimates are plotted against their experimentally determined values. Text in the panels: AUE is in kJ mol−1; “cor” is Pearson correlation; “1 kcal/mol” denotes the percentage of the estimates that fall within 1 kcal mol−1 (4.184 kJ mol−1) of the experimental measurement; “values” refers to the total number of perturbations per dataset.
Fig. 5
Fig. 5. Detail of a PTP1B structure (PDB ID: 2qbs) depicting the close proximity of the thiol group of Cys215 to the carboxyl group of the co-crystallized inhibitor.
Fig. 6
Fig. 6. Details of the ΔΔG calculations for the PTP1B protein–ligand system. The top row depicts the experimental ΔΔG values plotted against the calculated results. The two bottom panels summarize these calculations in terms of AUE and Pearson correlation. From left to right: Wang et al. calculations using deprotonated Cys215; FEP+ with OPLS v3 using deprotonated Cys215; FEP+ with OPLS v3 with protonated Cys215; pmx-based consensus force field approach with deprotonated Cys215; pmx-based consensus force field approach with deprotonated, but neutral Cys215; pmx-based consensus force field approach with protonated Cys215.
Fig. 7
Fig. 7. Average unsigned errors (AUE) for perturbations in the galectin data set using GAFF force field. Values are in kJ mol−1.
Fig. 8
Fig. 8. cMet inhibitor dataset. (A) Common scaffold of the compounds. (B) Substituents for the 12 cMet inhibitors. (C) ΔΔG for the transformations. The cases where GAFF and CGenFF results point in the opposite direction from the experiment are marked with an “x”, while differences between the force field results larger than 1 kcal mol−1 (4.184 kJ mol−1) are marked with “kcal”.

References

    1. Warren G. L. Andrews C. W. Capelli A.-M. Clarke B. LaLonde J. Lambert M. H. Lindvall M. Nevins N. Semus S. F. Senger S. Tedesco G. Wall I. D. Woolven J. M. Peishoff C. E. Head M. S. J. Med. Chem. 2006;49:5912–5931. doi: 10.1021/jm050362n. - DOI - PubMed
    1. Sliwoski G. Kothiwale S. Meiler J. Lowe E. W. Pharmacol. Rev. 2014;66:334–395. doi: 10.1124/pr.112.007336. - DOI - PMC - PubMed
    1. Wang L. Wu Y. Deng Y. Kim B. Pierce L. Krilov G. Lupyan D. Robinson S. Dahlgren M. K. Greenwood J. Romero D. L. Masse C. Knight J. L. Steinbrecher T. Beuming T. Damm W. Harder E. Sherman W. Brewer M. Wester R. Murcko M. Frye L. Farid R. Lin T. Mobley D. L. Jorgensen W. L. Berne B. J. Friesner R. A. Abel R. J. Am. Chem. Soc. 2015;137:2695–2703. doi: 10.1021/ja512751q. - DOI - PubMed
    1. Plewczynski D. Łaźniewski M. Augustyniak R. Ginalski K. J. Comput. Chem. 2011;32:742–755. doi: 10.1002/jcc.21643. - DOI - PubMed
    1. Jorgensen W. L. Acc. Chem. Res. 2009;42:724–733. doi: 10.1021/ar800236t. - DOI - PMC - PubMed