. 2021 Jun:56:None.
doi: 10.1016/j.algal.2021.102293.

Droplet-based microfluidic screening and sorting of microalgal populations for strain engineering applications

Affiliations

Droplet-based microfluidic screening and sorting of microalgal populations for strain engineering applications

Ziyi Yu et al. Algal Res. 2021 Jun.

Abstract

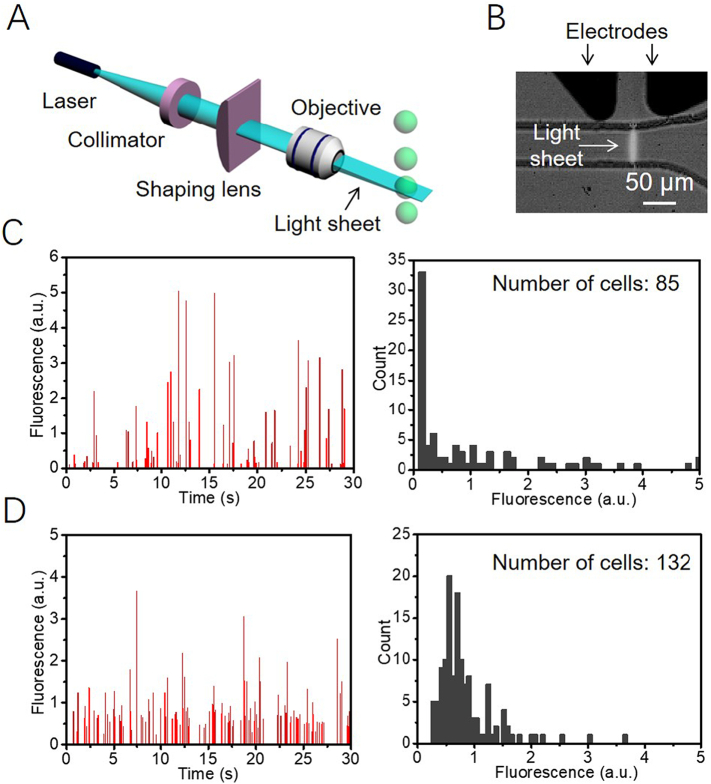
The application of microfluidic technologies to microalgal research is particularly appealing since these approaches allow the precise control of the extracellular environment and offer a high-throughput approach to studying dynamic cellular processes. To expand the portfolio of applications, here we present a droplet-based microfluidic method for analysis and screening of Phaeodactylum tricornutum and Nannochloropsis gaditana, which can be integrated into a genetic transformation workflow. Following encapsulation of single cells in picolitre-sized droplets, fluorescence signals arising from each cell can be used to assess its phenotypic state. In this work, the chlorophyll fluorescence intensity of each cell was quantified and used to identify populations of P. tricornutum cells grown in different light conditions. Further, individual P. tricornutum or N. gaditana cells engineered to express green fluorescent protein were distinguished and sorted from wild-type cells. This has been exploited as a rapid screen for transformed cells within a population, bypassing a major bottleneck in algal transformation workflows and offering an alternative strategy for the identification of genetically modified strains.

Keywords: Fluorescence detection; Microalgae; Microdroplets; Microfluidics; Screening for transformants.


Conflict of interest statement

The authors declare that they have no known competing financial interests or personal relationships that could have appeared to influence the work reported in this paper.

Figures

Fig. 1
Fig. 1
(A) Representative microscope images of the P. tricornutum and N. gaditana cells growing in microdroplets over the span of 7 days. Growth curve of (B) P. tricornutum cells and (C) N. gaditana cells in microdroplets. Starting from one cell at day zero, the number of cells per microdroplet increases over time (data reported in panels (B) and (C) as mean ± SD; n = 3).
Fig. 2
Fig. 2
(A) Schematic diagram of the setup for generation of a laser light sheet. (B) A microscope image of the laser light sheet illumination in a microfluidic sorting channel. (C, D) Histogram of the fluorescence signals (left panel) and the corresponding fluorescence intensity distribution (right panel) from microdroplets containing wild type P. tricornutum cells. (C) data from microdroplets under light spot illumination; (D) data from microdroplets under light sheet illumination. The data shown in C and D is example data for a 30 second detection when run with a constant flowrate of 1800 droplets min−1.
Fig. 3
Fig. 3
Chlorophyll fluorescence intensity histograms showing the chlorophyll fluorescence distribution for P. tricornutum cells cultured under a light/dark cycle of light intensity 30 μmol m−2 s−1 (black), and under continuous light of light intensity 75 μmol m−2 s−1 (red). Data is shown for a representative culture of each treatment and fluorescence was detected during independent runs using a constant flowrate of 1800 droplets min−1. (For interpretation of the references to colour in this figure legend, the reader is referred to the web version of this article.)
Fig. 4
Fig. 4
(A) Workflow of the droplet-based screening of microalgae using chlorophyll fluorescence. Representative microscope images of (B) P. tricornutum cells and (C) N. gaditana cells in microdroplets before and after sorting based on the chlorophyll fluorescence.
Fig. 5
Fig. 5
(A) Histogram of the fluorescence signals and (B) the corresponding fluorescence intensity distribution from microdroplets containing GFP-expressing and wild type P. tricornutum cells. The data shown in A and B is example data for a 15 s interval of detection with a flow rate of ~4500 droplets min−1. (C) Bright field (BF) microscope images and GFP channel of fluorescent microscope images of P. tricornutum cells in microdroplets before and after sorting based on GFP. Representative images are shown. (D) BF microscope images and fluorescent microscope images of N. gaditana cells in microdroplets before and after sorting based on GFP.
Fig. 6
Fig. 6
Flowchart showing the transformation workflow following the traditional route (grey arrows) or the microdroplet-assisted route (black arrows).
SI Fig. S1
SI Fig. S1
Microdroplet formation and storage. (A) Principle of microdroplet formation in microfluidic device. The diluted aqueous microalgae solution flows perpendicular to two streams of carrier oil FC 40. (B) The collected microdroplets are stored in a 1 mL syringe until further analysis.
SI Fig. S2
SI Fig. S2
Detection and screening setup. (A) Schematic of the optical setup to detect and sort microdroplets. (B) and (C) pictures of microfluidic devices during an experiment.
SI Fig. S3
SI Fig. S3
Growth curve of P. tricornutum cells grown in 20 mL f/2 bulk culture. (mean ± SD; n = 3).
SI Fig. S4
SI Fig. S4
Representative microscope images of P. tricornutum cells growing in microdroplets of different diameter over the span of 7 days. Microdroplet diameter is 37 μm (A) or 108 μm (B).
SI Fig. S5
SI Fig. S5
Comparison of different laser light illuminations. Image of microfluidic device with (A) laser point and (B) laser sheet configuration.
SI Fig. S6
SI Fig. S6
Representative microscope images of P. tricornutum cells encapsulated in microdroplets. The majority of droplets are empty with only around 15% occupied by P. tricornutum cells.
SI Fig. S7
SI Fig. S7
Detection of Nannochloropsis cells by using (A) laser spot illumination or (B) laser sheet illumination. More cells are detected when using the laser sheet configuration. The data shown in A and B is example data for a 30 second detection when run with a constant flowrate of 1800 droplets min−1.
SI Fig. S8
SI Fig. S8
Monitoring of P. tricornutum cultures under different light conditions. Cultures were grown in light/dark (LD) or constant (LL) light regimes in f/2 growth medium. Every two days growth at OD730 (A) and total chlorophyll content (B) was measured under the LD (black) and LL (red) light regim0065 (data reported as mean; n = 2).

References

    1. Hamilton M.L., Powers S., Napier J.A., Sayanova O. Heterotrophic production of omega-3 long-chain polyunsaturated fatty acids by trophically converted marine diatom phaeodactylum tricornutum. Mar. Drugs. 2016;14:53. doi: 10.3390/md14030053. - DOI - PMC - PubMed
    1. Wichmann J., Baier T., Wentnagel E., Lauersen K.J., Kruse O. Tailored carbon partitioning for phototrophic production of (E)-α-bisabolene from the green microalga Chlamydomonas reinhardtii, Metab. Eng. 2018;45:211–222. doi: 10.1016/j.ymben.2017.12.010. - DOI - PubMed
    1. Rasala B.A., Mayfield S.P. Photosynthetic biomanufacturing in green algae; production of recombinant proteins for industrial, nutritional, and medical uses, Photosynth. Res. 2015;123:227–239. doi: 10.1007/s11120-014-9994-7. - DOI - PubMed
    1. Lauersen K.J. Eukaryotic microalgae as hosts for light-driven heterologous isoprenoid production. Planta. 2019;249:155–180. doi: 10.1007/s00425-018-3048-x. - DOI - PubMed
    1. Dismukes G.C., Carrieri D., Bennette N., Ananyev G.M., Posewitz M.C. Aquatic phototrophs: efficient alternatives to land-based crops for biofuels, Curr. Opin. Biotechnol. 2008;19:235–240. doi: 10.1016/J.COPBIO.2008.05.007. - DOI - PubMed

LinkOut - more resources