

Enhanced mPGES-1 Contributes to PD-Related Peritoneal Fibrosis via Activation of the NLRP3 Inflammasome
- PMID: 34084773
- PMCID: PMC8167893
- DOI: 10.3389/fmed.2021.675363
Enhanced mPGES-1 Contributes to PD-Related Peritoneal Fibrosis via Activation of the NLRP3 Inflammasome
Abstract
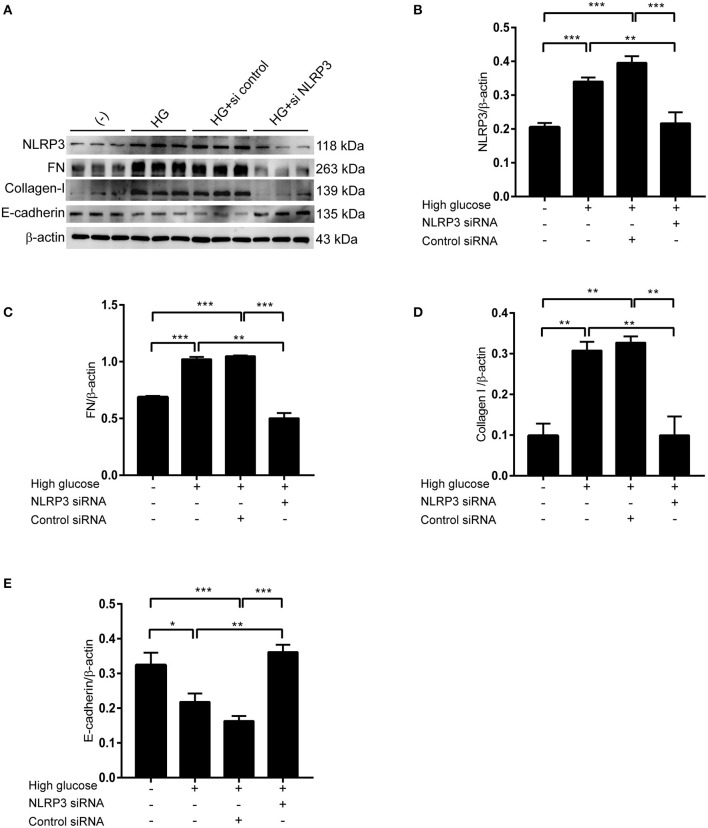
Background: Microsomal prostaglandin E synthase-1 (mPGES-1)-derived prostaglandin E2 (PGE2) is a chief mediator of inflammation. However, the role and mechanism of mPGES-1 in peritoneal dialysis (PD)-associated peritoneal fibrosis have not been investigated. Material and Methods: In PD patients, mPGES-1 expression in peritoneum tissues and the levels of PGE2, IL-1β, and IL-18 in the dialysate were examined. In rat peritoneal mesothelial cells (RPMCs), the regulation and function of mPGES-1 and NLRP3 inflammasome were investigated. The expression of extracellular matrix proteins and the components of NLRP3 inflammasome were detected by Western blotting or real-time quantitative PCR. Results: In PD patients with ultrafiltration failure (UFF), mPGES-1 was enhanced in the peritoneum, which was associated with the degree of peritoneal fibrosis. Accordingly, the intraperitoneal PGE2 levels were also positively related to the PD duration, serum C-reactive protein levels, and serum creatinine levels in incident PD patients. In RPMCs, high-glucose treatment significantly induced mPGES-1 expression and PGE2 secretion without affecting the expressions of mPGES-2 and cPGES. Inhibition of mPGES-1 via short hairpin RNA significantly ameliorated the expression of extracellular matrix proteins of RPMCs induced by high glucose. Additionally, high glucose markedly activated NLRP3 inflammasome in RPMCs that was blunted by mPGES-1 inhibition. Furthermore, silencing NLRP3 with siRNA significantly abrogated the expression of extracellular matrix proteins in RPMCs treated with high glucose. Finally, we observed increased IL-1β and IL-18 levels in the dialysate of incident PD patients, showing a positive correlation with PGE2. Conclusion: These data demonstrate that mPGES-1-derived PGE2 plays a critical role in PD-associated peritoneal fibrosis through activation of the NLRP3 inflammasome. Targeting mPGES-1 may offer a novel strategy to treat peritoneal fibrosis during PD.
Keywords: NLRP3 inflammasome; PGE2; inflammation; mPGES-1; peritoneal fibrosis.
Copyright © 2021 Luo, Hu, Zheng, Gong, Su, Ren, Ju, Jia and Dou.
Conflict of interest statement
The authors declare that the research was conducted in the absence of any commercial or financial relationships that could be construed as a potential conflict of interest.
Figures


Similar articles
-
Blockade of prostaglandin E2 receptor 4 ameliorates peritoneal dialysis-associated peritoneal fibrosis.Front Pharmacol. 2022 Nov 11;13:1004619. doi: 10.3389/fphar.2022.1004619. eCollection 2022. Front Pharmacol. 2022. PMID: 36438844 Free PMC article.
-
Activation of COX-2/mPGES-1/PGE2 Cascade via NLRP3 Inflammasome Contributes to Albumin-Induced Proximal Tubule Cell Injury.Cell Physiol Biochem. 2017;42(2):797-807. doi: 10.1159/000478070. Epub 2017 Jun 19. Cell Physiol Biochem. 2017. PMID: 28628921
-
Bavachin attenuates LPS-induced inflammatory response and inhibits the activation of NLRP3 inflammasome in macrophages.Phytomedicine. 2019 Jun;59:152785. doi: 10.1016/j.phymed.2018.12.008. Epub 2018 Dec 10. Phytomedicine. 2019. PMID: 31009850
-
[Effect of high glucose-based peritoneal dialysis fluids on NLRP3-IL-1β in human peritoneal mesothelial cells].Beijing Da Xue Xue Bao Yi Xue Ban. 2017 Dec 18;49(6):954-960. Beijing Da Xue Xue Bao Yi Xue Ban. 2017. PMID: 29263464 Chinese.
-
Update on mechanisms of ultrafiltration failure.Perit Dial Int. 2009 Feb;29 Suppl 2:S123-7. Perit Dial Int. 2009. PMID: 19270200 Review.
Cited by
-
Coupling Osmotic Efficacy with Biocompatibility in Peritoneal Dialysis: A Stiff Challenge.Int J Mol Sci. 2024 Mar 20;25(6):3532. doi: 10.3390/ijms25063532. Int J Mol Sci. 2024. PMID: 38542505 Free PMC article. Review.
-
Latest progress in the development of cyclooxygenase-2 pathway inhibitors targeting microsomal prostaglandin E2 synthase-1.Future Med Chem. 2022 Mar;14(6):385-388. doi: 10.4155/fmc-2021-0317. Epub 2022 Jan 5. Future Med Chem. 2022. PMID: 34985304 Free PMC article. No abstract available.
-
Blockade of prostaglandin E2 receptor 4 ameliorates peritoneal dialysis-associated peritoneal fibrosis.Front Pharmacol. 2022 Nov 11;13:1004619. doi: 10.3389/fphar.2022.1004619. eCollection 2022. Front Pharmacol. 2022. PMID: 36438844 Free PMC article.
-
Sterile inflammation of peritoneal membrane caused by peritoneal dialysis: focus on the communication between immune cells and peritoneal stroma.Front Immunol. 2024 May 8;15:1387292. doi: 10.3389/fimmu.2024.1387292. eCollection 2024. Front Immunol. 2024. PMID: 38779674 Free PMC article. Review.
-
Resveratrol glycoside inhibits NLRP3/IL-1β/NF-κB to alleviate peritoneal fibrosis in peritoneal dialysis.Clin Exp Nephrol. 2025 Jun 17. doi: 10.1007/s10157-025-02707-7. Online ahead of print. Clin Exp Nephrol. 2025. PMID: 40526291
References
-
- Aroeira LS, Aguilera A, Sanchez-Tomero JA, Bajo MA, del Peso G, Jimenez-Heffernan JA, et al. . Epithelial to mesenchymal transition and peritoneal membrane failure in peritoneal dialysis patients: pathologic significance and potential therapeutic interventions. J Am Soc Nephrol. (2007) 18:2004–13. 10.1681/ASN.2006111292 - DOI - PubMed
LinkOut - more resources
Full Text Sources
Research Materials
Miscellaneous