

Evaluating the Effectiveness of Personalized Medicine With Software
- PMID: 34085036
- PMCID: PMC8167073
- DOI: 10.3389/fdata.2021.572532
Evaluating the Effectiveness of Personalized Medicine With Software
Abstract
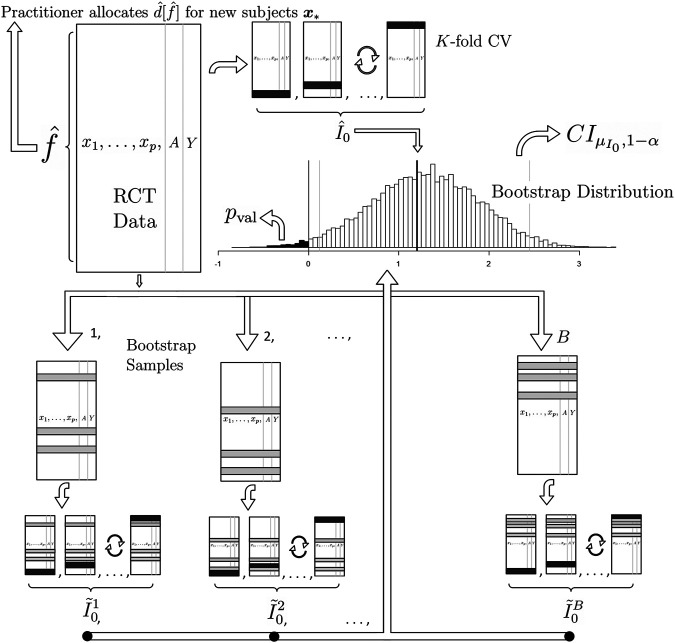
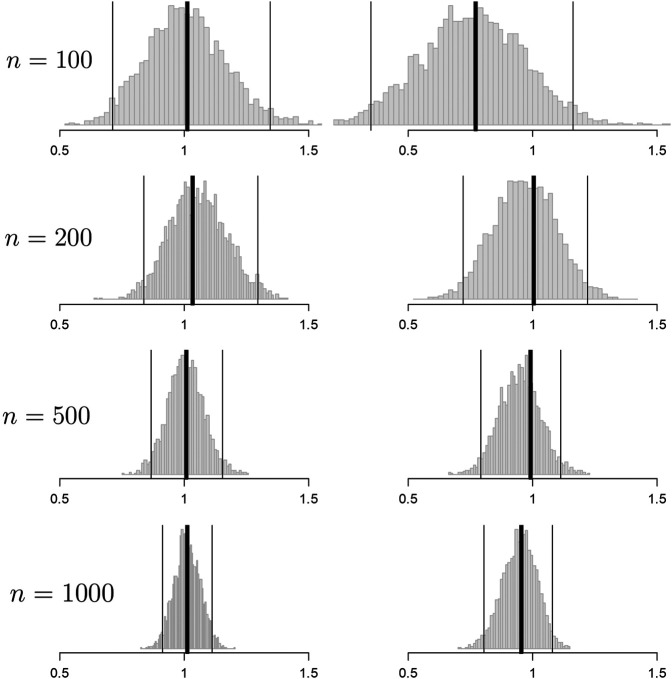
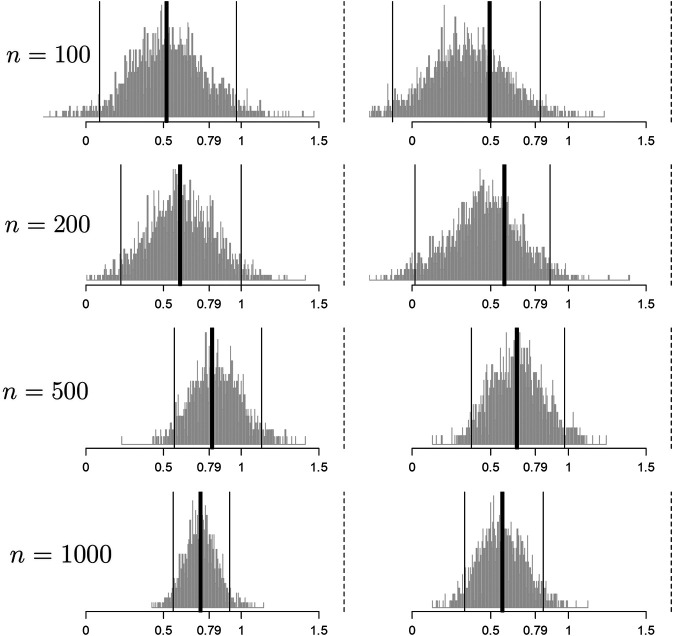
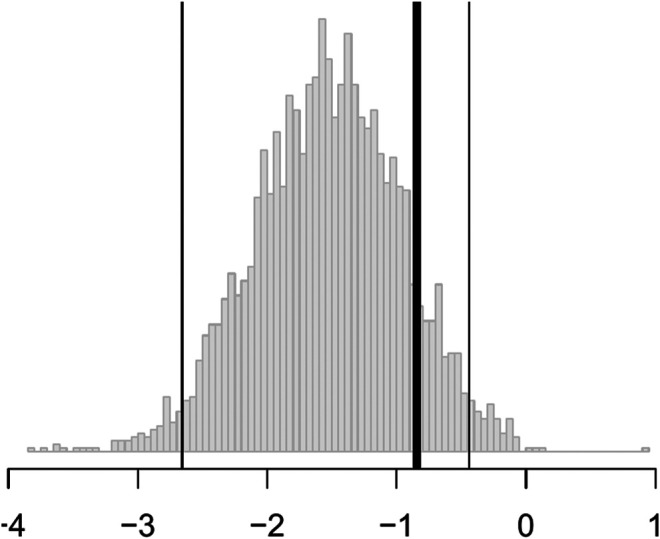
We present methodological advances in understanding the effectiveness of personalized medicine models and supply easy-to-use open-source software. Personalized medicine involves the systematic use of individual patient characteristics to determine which treatment option is most likely to result in a better average outcome for the patient. Why is personalized medicine not done more in practice? One of many reasons is because practitioners do not have any easy way to holistically evaluate whether their personalization procedure does better than the standard of care, termed improvement. Our software, "Personalized Treatment Evaluator" (the R package PTE), provides inference for improvement out-of-sample in many clinical scenarios. We also extend current methodology by allowing evaluation of improvement in the case where the endpoint is binary or survival. In the software, the practitioner inputs 1) data from a single-stage randomized trial with one continuous, incidence or survival endpoint and 2) an educated guess of a functional form of a model for the endpoint constructed from domain knowledge. The bootstrap is then employed on data unseen during model fitting to provide confidence intervals for the improvement for the average future patient (assuming future patients are similar to the patients in the trial). One may also test against a null scenario where the hypothesized personalization are not more useful than a standard of care. We demonstrate our method's promise on simulated data as well as on data from a randomized comparative trial investigating two treatments for depression.
Keywords: bootstrap; inference; personalized medicine; randomized comparative trial; statistical software; treatment regimes.
Copyright © 2021 Kapelner, Bleich, Levine, Cohen, DeRubeis and Berk.
Conflict of interest statement
The authors declare that the research was conducted in the absence of any commercial or financial relationships that could be construed as a potential conflict of interest.
Figures
Similar articles
-
The future of Cochrane Neonatal.Early Hum Dev. 2020 Nov;150:105191. doi: 10.1016/j.earlhumdev.2020.105191. Epub 2020 Sep 12. Early Hum Dev. 2020. PMID: 33036834
-
Subpopulation Treatment Effect Pattern Plot (STEPP) analysis for continuous, binary, and count outcomes.Clin Trials. 2016 Aug;13(4):382-90. doi: 10.1177/1740774516643297. Epub 2016 Apr 19. Clin Trials. 2016. PMID: 27094489 Free PMC article.
-
Ethical pitfalls in neonatal comparative effectiveness trials.Neonatology. 2014;105(4):350-1. doi: 10.1159/000360650. Epub 2014 May 30. Neonatology. 2014. PMID: 24931328
-
Systematic reviews of the effectiveness of day care for people with severe mental disorders: (1) acute day hospital versus admission; (2) vocational rehabilitation; (3) day hospital versus outpatient care.Health Technol Assess. 2001;5(21):1-75. doi: 10.3310/hta5210. Health Technol Assess. 2001. PMID: 11532238 Review.
-
Non-invasive imaging software to assess the functional significance of coronary stenoses: a systematic review and economic evaluation.Health Technol Assess. 2021 Sep;25(56):1-230. doi: 10.3310/hta25560. Health Technol Assess. 2021. PMID: 34588097
Cited by
-
Mental health care for older adults: recent advances and new directions in clinical practice and research.World Psychiatry. 2022 Oct;21(3):336-363. doi: 10.1002/wps.20996. World Psychiatry. 2022. PMID: 36073714 Free PMC article.
-
Applying methods for personalized medicine to the treatment of alcohol use disorder.J Consult Clin Psychol. 2021 Apr;89(4):288-300. doi: 10.1037/ccp0000634. J Consult Clin Psychol. 2021. PMID: 34014691 Free PMC article. Clinical Trial.
-
Mathematical modeling and mechanisms of HIV latency for personalized anti latency therapies.NPJ Syst Biol Appl. 2025 Jun 12;11(1):64. doi: 10.1038/s41540-025-00538-6. NPJ Syst Biol Appl. 2025. PMID: 40506472 Free PMC article. Review.
-
Measuring the Performance of Survival Models to Personalize Treatment Choices.Stat Med. 2025 Mar 30;44(7):e70050. doi: 10.1002/sim.70050. Stat Med. 2025. PMID: 40207416 Free PMC article.
-
Development of the treatment prediction model in the artificial intelligence in depression - medication enhancement study.Npj Ment Health Res. 2025 Jun 23;4(1):26. doi: 10.1038/s44184-025-00136-8. Npj Ment Health Res. 2025. PMID: 40550942 Free PMC article.
References
-
- Agresti A. (2018). An Introduction to Categorical Data Analysis. Hoboken, NJ: John Wiley & Sons.
-
- Bagby R. M., Quilty L. C., Segal Z. V., McBride C. C., Kennedy S. H., Costa P. T. (2008). Personality and Differential Treatment Response in Major Depression: a Randomized Controlled Trial Comparing Cognitive-Behavioural Therapy and Pharmacotherapy. Can. J. Psychiatry 53, 361–370. 10.1177/070674370805300605 - DOI - PMC - PubMed
-
- Berk R. A., Brown L., Buja A., Zhang K., Zhao L. (2013b). Valid Post-selection Inference. Ann. Stat. 41, 802–837. 10.1214/12-aos1077 - DOI
LinkOut - more resources
Full Text Sources