. 2020 Nov;1(11):1082-1096.
doi: 10.1038/s43018-020-00125-0. Epub 2020 Oct 19.

A MYC and RAS co-activation signature in localized prostate cancer drives bone metastasis and castration resistance

Affiliations

A MYC and RAS co-activation signature in localized prostate cancer drives bone metastasis and castration resistance

Juan M Arriaga et al. Nat Cancer. 2020 Nov.

Abstract

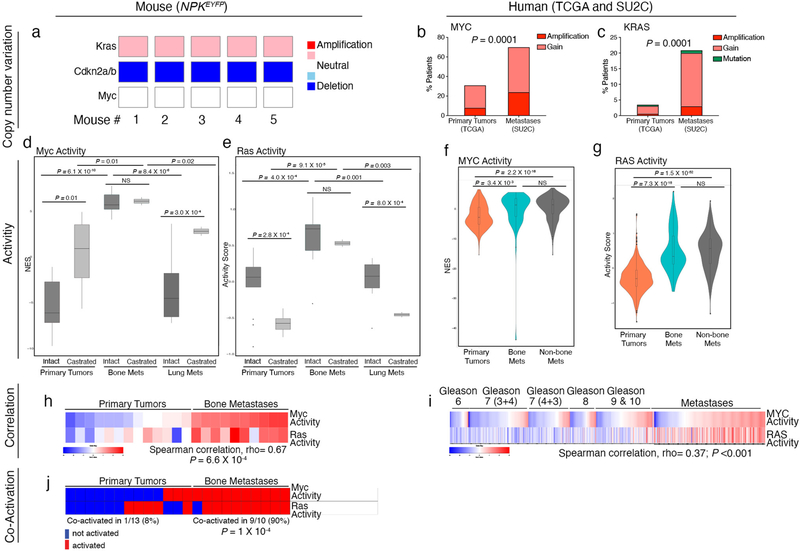
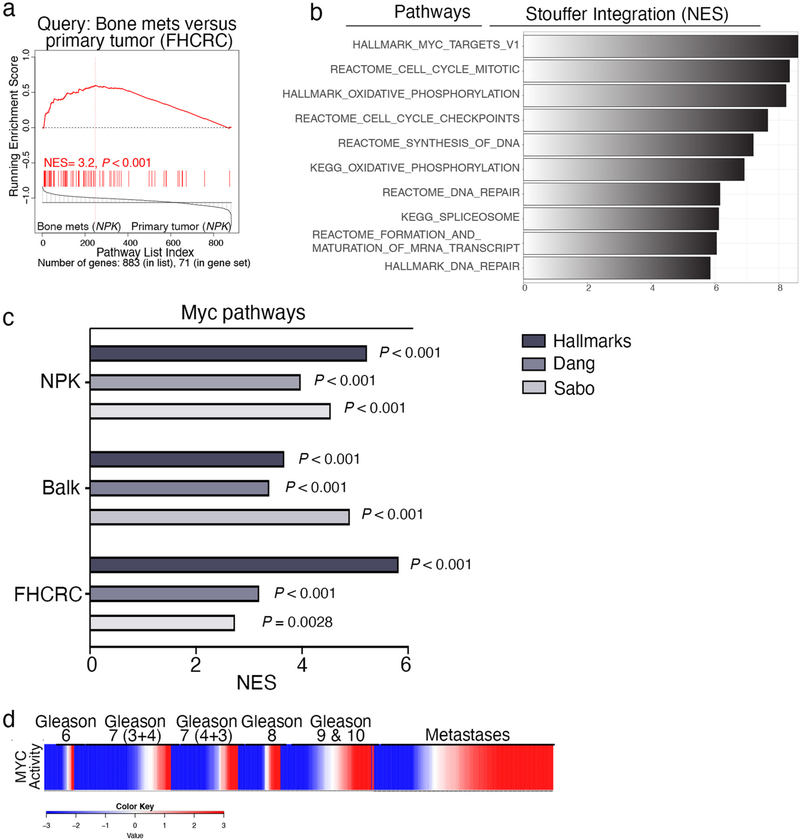
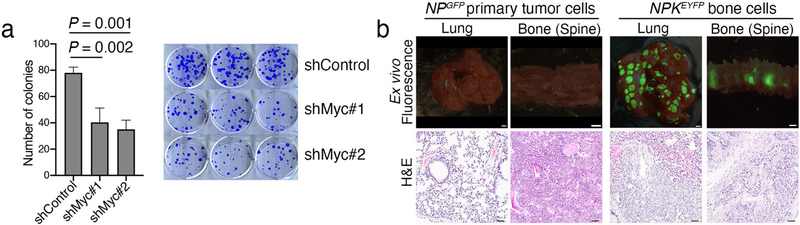
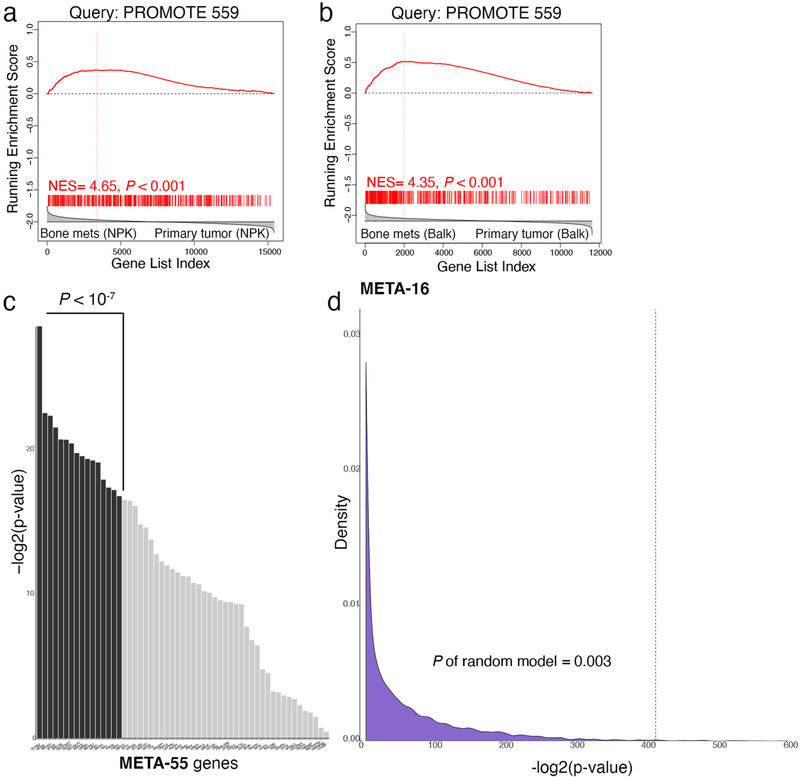
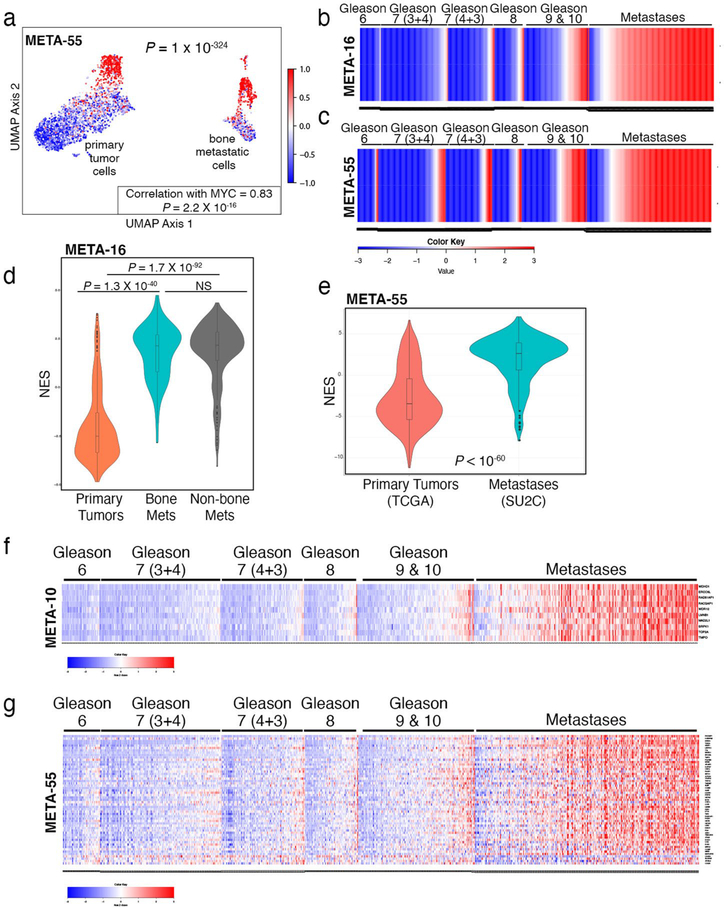
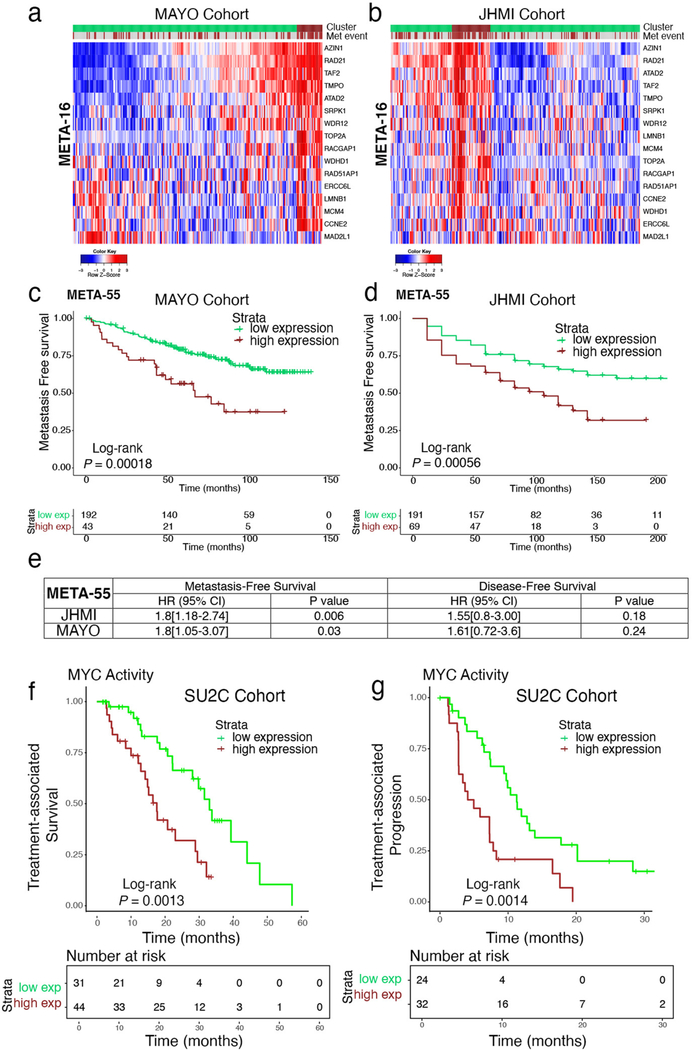
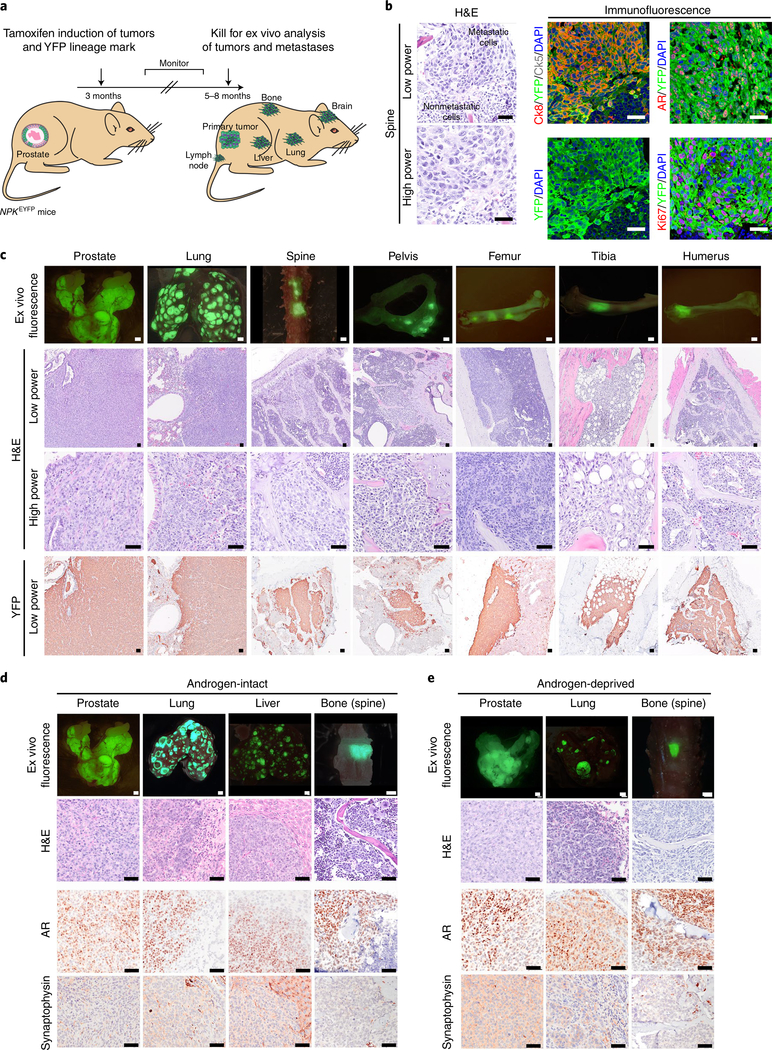
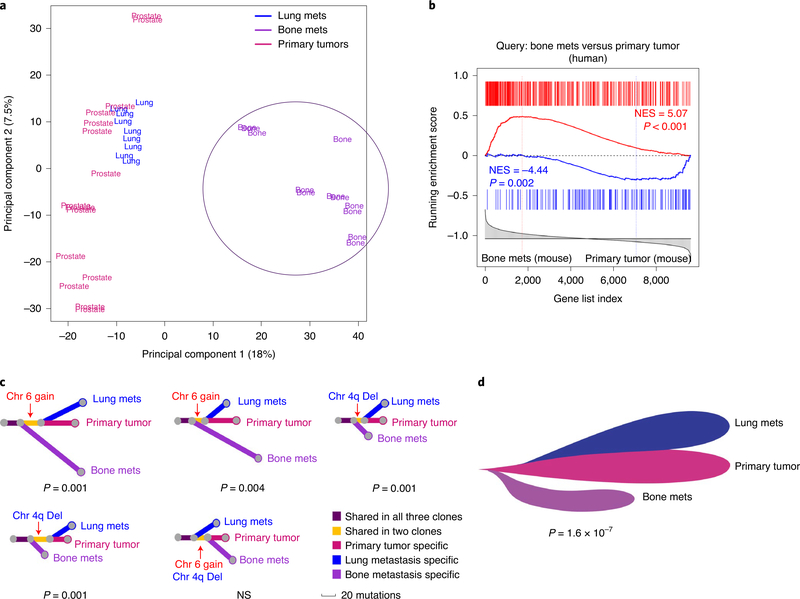
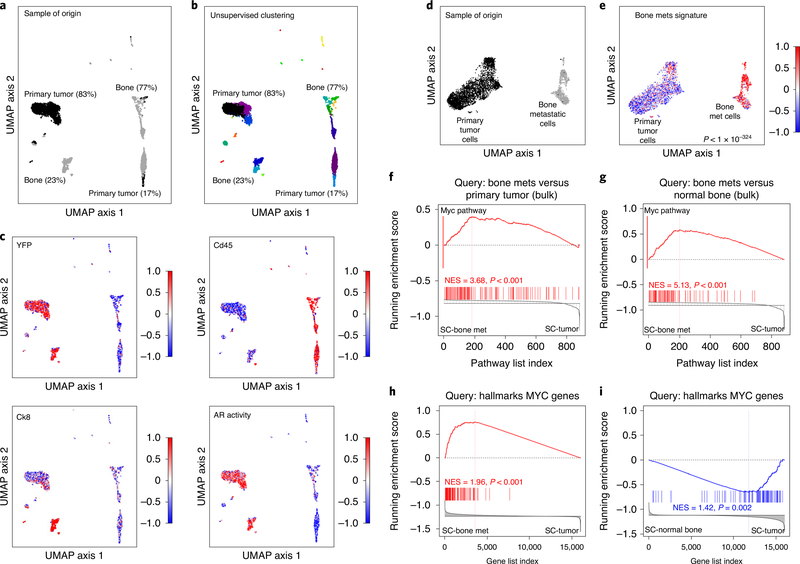
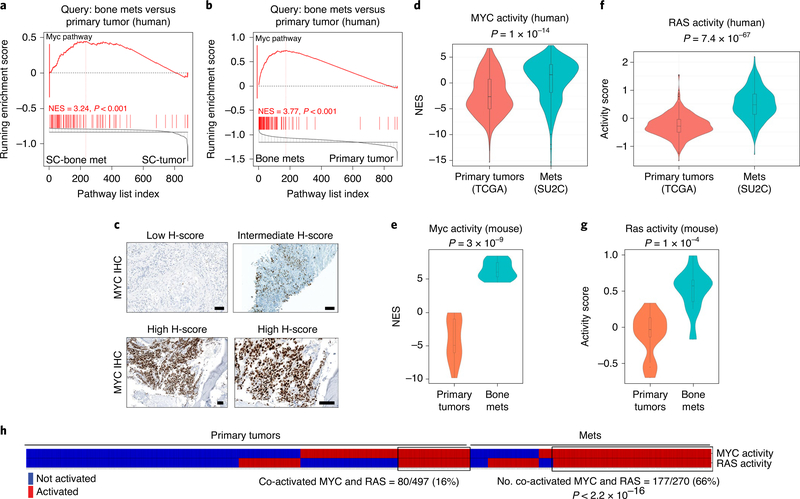
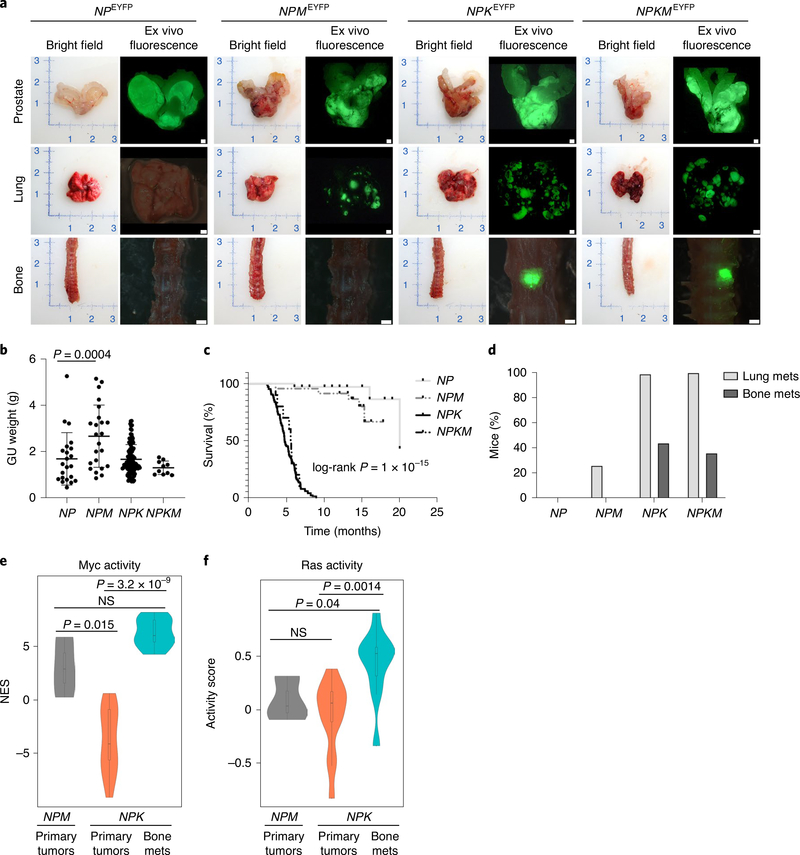
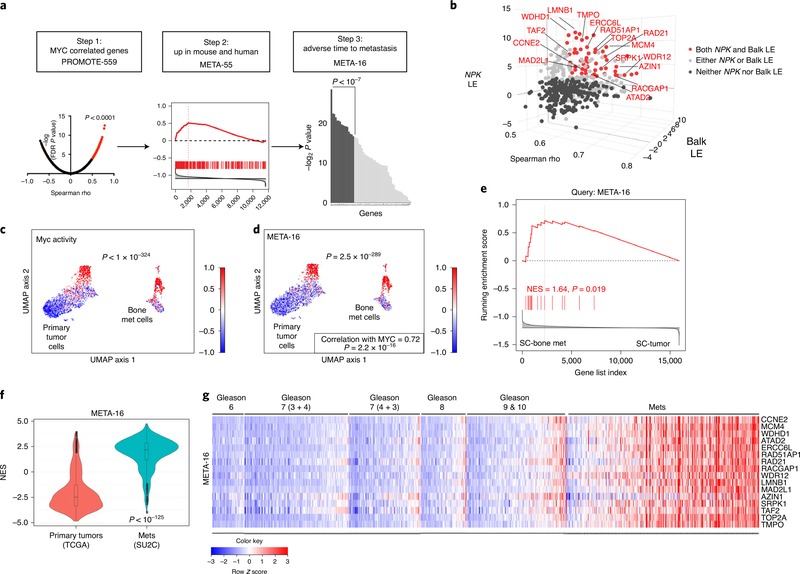
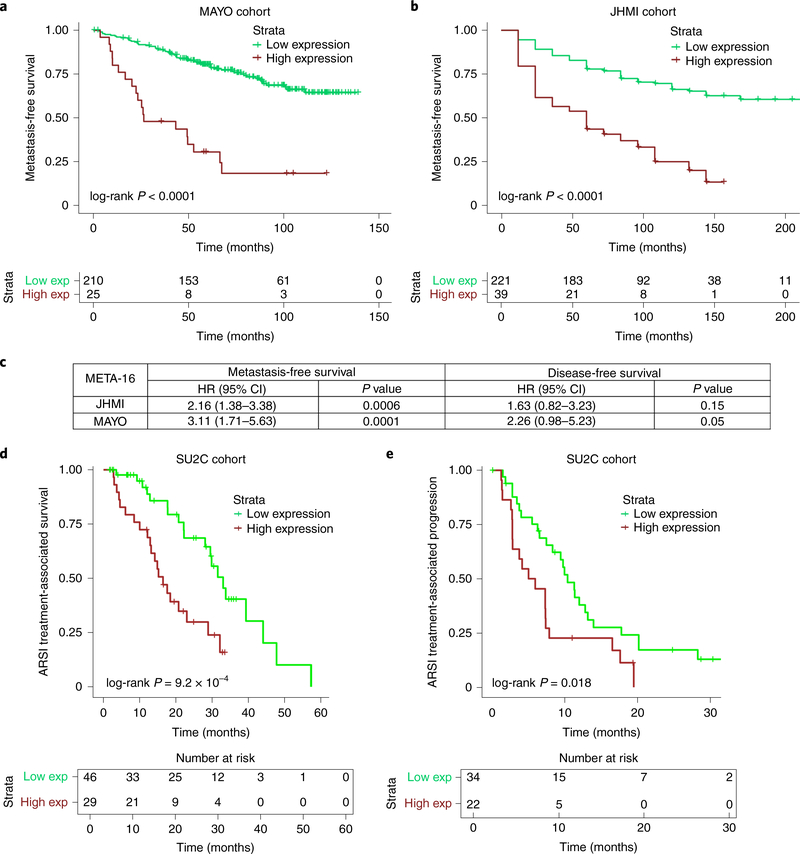
Understanding the intricacies of lethal prostate cancer poses specific challenges due to difficulties in accurate modeling of metastasis in vivo. Here we show that NPK EYFP mice (for Nkx3.1 CreERT2/+ ; Pten flox/flox ; Kras LSL-G12D/+ ; R26R-CAG-LSL-EYFP/+) develop prostate cancer with a high penetrance of metastasis to bone, thereby enabling detection and tracking of bone metastasis in vivo and ex vivo. Transcriptomic and whole-exome analyses of bone metastasis from these mice revealed distinct molecular profiles conserved between human and mouse and specific patterns of subclonal branching from the primary tumor. Integrating bulk and single-cell transcriptomic data from mouse and human datasets with functional studies in vivo unravels a unique MYC/RAS co-activation signature associated with prostate cancer metastasis. Finally, we identify a gene signature with prognostic value for time to metastasis and predictive of treatment response in human patients undergoing androgen receptor therapy across clinical cohorts, thus uncovering conserved mechanisms of metastasis with potential translational significance.


Figures

Extended Data Fig. 1 |
Extended Data Fig. 1 |. Additional phenotypic analyses of NPKEYFP prostate tumors.
a, Representative bright field and ex vivo fluorescence images of prostate, lung, and bone (spine) from NPEYFP mice (n = 35), NPKEYFP mice without bone metastases (n = 59), and NPKEYFP mice with bone metastases (n = 47). b–j, Comparison of NPKEYFP mice with (n = 47) or without (n = 59) bone metastasis. See also Supplementary Table 1. b, Overall survival; p-value calculated using a two-tailed log-rank test. c, Bladder obstruction; p-value calculated using a two-sided Fisher’s exact test. d–g, Dot-plots showing tumor weight (d) and metastatic load (number of metastases/mouse) to lungs (e), liver (f) and brain (g). p-values were calculated by two-tailed Mann-Whitney test, center-lines show the mean and error bars depict SD. h, Distribution of metastases to specific bone types in NPKEYFP mice at the time of euthanasia. Shown is the mean with standard deviation; n = 106 mice (n = 59 without bone metastases and n = 47 with bone metastases). i, j, Longitudinal analysis of micro-metastasis in non-terminal mice dissected at the ages shown (n = 26). i, Bar graphs showing the percentage of mice with micro-metastasis at 3 months (n = 7), 4 months (n = 17) and 5 months (n = 2). j, Bar graphs showing the percentage of mice with bone or lung micro-metastases (n = 26).
Extended Data Fig. 2 |
Extended Data Fig. 2 |. Analyses of androgen-intact and castrated of NPKEYFP mice.
Comparison of intact (n = 106) and castrated (n = 22) NPKEYFP mice. See also Supplementary Table 1. a, Kaplan-Meier curves showing overall survival; p-value was calculated using a two-tailed log-rank test. b, c, Dot-plots showing tumor weight (b) and number of bone metastasis (c). p-values were calculated by two-tailed Mann-Whitney test, center-lines show the mean and error bars depict SD.d, Bar graphs showing the percentage of mice with metastasis to the indicated organs. e, f, Dot-plots showing relative AR activity levels (that is, NES defined based on enrichment of AR signature (based on) in each sample) (e) and relative neuroendocrine (NE) activity (that is, NES defined based on enrichment of NEPC signature (based on) in each sample (f) comparing intact (n = 13) or castrated (n = 6) primary tumors, intact (n = 9) or castrated (n = 2) lung metastasis and intact (n = 10) or castrated (n = 2) bone metastasis from NPKEYFP mice (Supplementary Table 2). g, Gene Set Enrichment Analyses (GSEA) comparing a bone metastasis signatures from castrated mice used as a query and bone metastasis signature from non-castrated (intact) NPKEYFP mice used as a reference (Supplementary Table 2i,j). NES (normalized enrichment score) and p-values were estimated using 1,000 gene permutations. NS, non-significant (P < 0.05).
Extended Data Fig. 3 |
Extended Data Fig. 3 |. Comparison of MYC and RAS in mouse and human prostate cancer.
ac, Copy number variant (CNV) analyses of KRAS and MYC in mouse and human prostate cancer. a, Kras, Cdkn2a/b and Myc loci, inferred from whole-exome sequencing of NPKEYFP prostate tumors. Color coding reflects amplifications or deletions in five individual mice (Supplementary Table 4b). b, c, Summary of gains in MYC (b) and KRAS (c) in human prostate cancer comparing primary tumors from TCGA (n = 489) and metastases from SU2C (n = 429) using cBioportal. P values were calculated using a Fisher’s exact test comparing samples with all gains versus no gains. d, e, Box plots depicting Myc pathway and Ras pathway activation in primary tumors and metastases from intact or castrated NPKEYFP mice (primary tumors: n = 13 intact and n = 6 castrated; lung metastases: n = 9 intact and n = 2 castrated; bone metastases: n = 10 intact and n = 2 castrated). The distribution of the activity scores (y-axis) for Myc activity is based on single-sample GSEA in panel d, and Ras activity levels is based on the absolute-valued average of RAS-related genes as in, in panel e. P-values were estimated using two-sample one-tailed Welch t-test, boxes show the 25th–75th percentile with the median, and whiskers show the minimum–maximum values. f, g, Violin plots depicting the distribution of MYC and RAS pathway activation in primary tumors and metastases comparing human primary tumors (TCGA, n = 497) versus metastases (SU2C, n = 270). In panel f, the distribution of the NESs (y-axis) represent MYC activity levels based on single-sample GSEA (see Extended data Fig. 4d) In panel g, the activity scores (y-axis) represent RAS pathway activity levels based on the absolute-valued average of RAS-related genes (as in,). P-values were estimated using two-sample one-tailed Welch t-test. In the violin plots with embedded box plots, boxes show the 25th–75th percentile, center-lines show the median, and whiskers show the minimum–maximum values. h, i, Heatmap representation showing the correlation of MYC and RAS pathway activity in mouse (h) and human (i) prostate cancer. Panel h shows Myc and Ras pathway activity in mouse NPKEYFP primary tumors and bone metastases. Panel i shows MYC and RAS pathway activity in human primary tumors (TCGA, n = 497) and metastases (SU2C, n = 270). Gleason scores are shown for the primary tumors; metastases include all metastases in the SU2C cohort. In panels h, i, Spearman correlation rho- and p-values are shown. j, Mouse NPKEYFP primary tumors and bone metastases classified as MYC- or RAS-activated are depicted in a heatmap in red, whereas those without MYC- or RAS-activation are represented in blue. Samples were considered Myc-activated if Myc activity scores were greater than the average across the cohorts. Samples were considered Ras-activated if Ras activity scores were greater than the average across the cohorts. The percentage of cases in which Myc and Ras are co-activated are shown; two-tailed p-value was calculated using Fisher’s exact test.
Extended Data Fig. 4 |
Extended Data Fig. 4 |. Additional analyses of MYC activity in prostate tumors and metastases.
a, Cross-species pathway analysis. Pathway-based GSEA comparing pathways enriched in the FHCRC human bone metastasis signature (Supplementary Table 6d) with those enriched in the mouse bulk RNA bone metastasis signature (Supplementary Table 6a). NES and p-values were estimated using 1,000 pathway permutations. b, Stouffer integration of the leading-edge pathways from the GSEA comparing the mouse (Supplementary Table 6a) and the two human bone metastases signatures (Supplementary Tables 6c,d) from panel a and Fig. 4b. The x-axis shows the Stouffer integrated NES. c, Bar graphs summarizing NES scores from GSEA of bone metastasis signatures from NPKEYFP mice (Supplementary Table 2c), and the Balk and FHCRC human cohorts (Supplementary Tables 3c,d) showing enrichment of three independent MYC signatures: “Hallmarks” (human), “Dang” (human) and “Sabo” (mouse). NES and p-values were estimated using 1,000 gene permutations. d, Heatmap representation of single-sample GSEA enrichment of MYC activity based on enrichment of the Hallmarks MYC pathway in primary tumors from TCGA (n = 497) and metastases from SU2C (n = 270) (Supplementary Table 3). Gleason scores are shown for the primary tumors; metastases include all metastases in the SU2C cohort. Colors correspond to NES.
Extended Data Fig. 5 |
Extended Data Fig. 5 |. Additional analysis of Myc function in an allograft model of bone metastasis.
a, Bar graphs and crystal violet staining of colony formation assays of NPK bone cells two weeks after treatment with shControl or shRNAs targeting Myc (shMyc#1 and shMyc#2). b, Comparison of lung and bone from Nude mouse hosts implanted via intracardiac injection with green fluorescent protein (GFP)-tagged cells derived from primary tumors of non-metastatic NP mice (NPGFP cells, reported in; n = 2) or the NPKEYFP bone cells (n = 10). Shown are representative ex vivo fluorescence or H&E images. Scale bars represent 0.1 cm for the ex vivo fluorescence images and 50 μm for all other images.
Extended Data Fig. 6 |
Extended Data Fig. 6 |. Analyses of MYC silencing in a human tumor growth in bone.
a, Strategy. PC3 cells engineered to express luciferase and GFP (PC3-Luciferase-GFP cells). Cells were infected with a control shRNA (shControl) or shRNA to silence MYC (shMYC#1 or shMYC#2) and implanted into the tibia of NOD-SCID mouse hosts. b, Western blot image of total protein extracts. Shown are the approximate molecular weight markers (kDa); Actin is a control for protein loading. Shown is a representative blot from two independent experiments. The uncropped Western image is shown in Source data Extended Fig. 6. c. Immunostaining for MYC in tumors from mice that had been injected with cells expressing the indicated shRNAs. Scale bars represent 50 μm. d, Bar graphs and crystal violet staining of colony formation assays of PC3-Luciferase-GFP cells two weeks after treatment with the shRNAs as indicated. e, Growth curves comparing PC3-Luciferase-GFP cells infected with shRNA (n = 10/group). P-value shown for day 52 was estimated by two-way ANOVA with Sidak’s multiple comparisons against shControl. f. Representative IVIS bioluminescence imaging used for panel e. g. Representative images from the time of sacrifice of tibiae implanted with the PC3-Luciferase-GFP cells infected with shRNA (n = 10/group). Shown are ex vivo imaging of GFP fluorescence, to visualize the tumor, and corresponding micro-computed tomography (CT) images, to show areas of osteolysis as is typical of PC3 tumors in bone. Also shown are representative H&E and immunostaining for GFP. In a and f, bars show mean and error bars the SD, (n = 3) and p-value is shown for One-way ANOVA with Dunnett’s multiple comparison test, compared to shControl. Scale bars represent 0.1 cm for the ex vivo fluorescence images and 50 μm for all other images.
Extended Data Fig. 7 |
Extended Data Fig. 7 |. Additional analyses of discovery of a MYC-correlated signature in prostate cancer metastasis.
a,b, GSEA using the PROMOTE-559 gene signature (Supplementary Table 8) to query the bone metastasis gene signature from the NPKEYFP mice (Supplementary Table 2c) (in a) and the human bone metastasis gene signature (Supplementary Table 3c) (in b); NESs and p-values were estimated using 1,000 gene permutations. c, Association with adverse outcome for metastasis. Each of the MEtA-55 genes was evaluated by univariable Cox proportional hazards analysis for time-to-metastasis outcome in the TCGA dataset (n = 336 with available time to follow-up, Supplementary Table 3) and ranked by the strength of the association (that is, Wald test p-value), with a cutoff at p-value<10–7 from Wald test used to identify the 16 top-genes constituting the MEtA-16 gene signature (Supplementary Table 8). d, Random model. To evaluate the probability that not any random group of 16 genes would be upregulated in the SU2C (n = 270) versus the TCGA (n = 497) cohorts, we constructed a null model using 10,000 iterations, with the x-axis showing -log2 p-value (from the two-sample one-tailed Welch t-test) between TCGA and SU2C comparisons and y-axis showing its probability density. The p-value of this random model thus represents an estimate of the number of times two-sample one-tailed Welch t-test p-values for a random 16 genes reached or outperformed two-sample one-tailed Welch t-test p-values for the MEtA-16 genes. The p-value for the analogous random model for MEtA-55 was P = 0.036.
Extended Data Fig. 8 |
Extended Data Fig. 8 |. Additional analyses of MEtA-55 and MEtA-16 in prostate cancer metastasis.
a, Scaled expression (DESeq2 normalized values) of MEtA-55 in single-cell UMAP projections of primary tumors and bone metastases (see Fig. 7c, d). Shown is the correlation between MEtA-55 expression at the single-cell level with MYC pathway activity (Spearman’s rank correlation rho and p-values). b, c, Heatmap representation of single-sample GSEA enrichment of the MEtA-16 (b) and MEtA-55 (c) gene signatures in primary tumors from TCGA (n = 497) and metastases from SU2C (n = 270) (Supplementary Table 3). Colors correspond to NES. d, e, Violin plots depicting the distribution of the NESs (y-axis) which reflect activity levels of MEtA-16 (d) and MEtA-55 (e) in primary tumors from TCGA (n = 497) compared with metastases from SU2C (n = 270). The p-value was estimated using two-sample one-tailed Welch t-test. In inset box-plots, boxes show the 25th–75th percentile, center-lines show the median, and whiskers show the minimum–maximum values. f, g, Heatmap representation of expression levels of MEtA genes (as indicated) in each of the individual samples from the TCGA (n = 497) and SU2C (n = 270) cohorts. Gleason scores are shown for the primary tumors; metastases include all metastases in the SU2C cohort. Shown are row-scaled expression values (color). Panel f shows the 10 genes from the MEtA-16 signature that do not co-reside with MYC on chromosome 8q, indicated as MEtA-10. Panel g shows the MEtA-55 genes.
Extended Data Fig. 9 |
Extended Data Fig. 9 |. Additional validation of the MEtA-16 gene signature.
a, Quantitative reverse transcriptase PCR (qRT-PCR) of MEtA-16 in the CUIMC cohort of bone metastases (n = 5) compared with high-Gleason grade primary prostate tumors (n = 10). Indicated p-values were estimated using a two-tailed Mann-Whitney test compared to the average of all primary tumors. In box plots, boxes show the 25th–75th percentile, center-lines show the median, and whiskers show the minimum–maximum values. b, c, Heatmaps showing expression levels of MEtA-16 genes determined by qRT-PCR following MYC silencing in human and mouse prostate cancer cells. b, qRT-PCR using RNA obtained from subcutaneous PC3-Luc-GFP tumors expressing shRNA against MYC (shMYC#1) or control shRNA (shControl). c, qRT-PCR using RNA obtained from NPKEYFP bone cells grown in vitro and infected with the indicated shRNAs. Scaled values represent ratios of expression compared to shControl for each gene. In b, c, p-values were estimated using z-score sums of all genes using two-tailed, unpaired t-test (b) or one-way ANOVA with Dunnett’s multiple comparisons against shControl (c).
Extended Data Fig. 10 |
Extended Data Fig. 10 |. Additional validation of the MEtA-55/MEtA-16 gene signatures and survival analyses.
a, b, Heatmaps of hierarchical consensus clustering analysis used to define tumors with high (brown cluster) and low (green cluster) expression of MEtA-16 in MAYO (n = 235) and JHMI (n = 260) cohorts, as indicated (Supplementary Table 3). Brown vertical bars on the second from top row represent patients that developed distant metastasis. Colors represent row-scaled expression values. c, d, Kaplan-Meier survival analyses comparing patients with low and high overall expression of MEtA-55. The p-values were estimated using a log-rank test. e, Multivariable survival analysis of the MEtA-55 gene signature in the JHMI and MAYO cohorts showing significant association with metastasis-free survival but not with prostate-cancer specific mortality (HR = hazard ratio, CI = confidence interval, p-values estimated from Coxproportional hazards model), adjusted for age, pathological Gleason score/grade at diagnosis, pre-PSA, seminal vesicle invasion (SVI), lymph node invasion (LNI), and extra-prostatic extension (EPE). f, g, Kaplan-Meier survival analyses comparing patients from SU2C cohort with the low and high MYC activity with respect to treatment-associated survival (that is, time from the start of treatment with androgen receptor signaling inhibitor (ARSi) therapy, to death or last follow-up, n = 75 patients) or treatment-associated disease progression (that is, time on treatment with ARSIs, n = 56) as defined in. The p-values were estimated using a log-rank test.
Fig. 1 |
Fig. 1 |. A mouse model of highly penetrant bone metastasis.
a, Strategy. Tamoxifen delivery to NPKEYFP mice (for Nkx3.1CreERT2/+; Ptenflox/flox; KrasLSL-G12D/+; R26R-CAG-LSL-EYFP/+) at 3 months induces tumor formation and lineage marking. Tumor-induced mice are monitored for 5–8 months for development of metastases to bone as well as lymph node, lung, liver and brain. be, Histopathological analyses. Representative hematoxylin and eosin (H&E) (left) or confocal (right) images of bone metastases (spine) (b). DAPI, 4,6-diamidino-2-phenylindole. Coexpression of YFP with luminal cytokeratin (Ck8), basal cytokeratin (Ck5), the AR and Ki67. Representative images of prostate tumors and metastases from lung and bone (spine, pelvis, femur, tibia and humerus) showing ex vivo fluorescence, histology (H&E) and immunostaining for YFP (c). Representative images of prostate tumor and metastases from androgen-intact (d) or castrated (androgen-deprived) (e) NPKEYFP mice showing ex vivo fluorescence, histology (H&E) and immunostaining for AR or the NEPC marker, synaptophysin. Representative images from five independent mice are shown (be). Scale bars, 0.1 cm for ex vivo fluorescence images and 50 μm for all other images.
Fig. 2 |
Fig. 2 |. Molecular analysis of bone metastasis from NPKEYFP mice.
a,b, Transcriptomic analyses. PCA of bulk RNA-seq of primary tumors (n = 15), lung metastases (n = 9) and bone metastases (n = 12) from androgen-intact NPKEYFP mice (Supplementary Table 2) (a). mets, metastases. The circle indicates separation of bone metastases from primary tumors and lung metastases. Conservation with human prostate cancer (b). GSEA using human bone metastasis signature based on Balk (Supplementary Table 3c) to query the reference mouse bone metastasis gene signature from NPKEYFP mice (Supplementary Table 2c). NES (normalized enrichment score) and P values were estimated using 1,000 gene permutations. c,d, Phylogenetic analysis of WES data. Evolutionary trees for matched trios of primary tumor, bone and lung metastases from five independent mice (represented by each of the trees) were constructed by WES analyses of somatic mutations (substitutions and indels) (Supplementary Table 4a) (c). The length of lines indicates the number of mutations in each branch and colors indicate the mutations unique to or shared between clones; bootstrap-derived P values for each case using 1,000 permutations are shown. Informative CNVs (gains in chromosome 6, ‘Chr 6 gain’ and deletions in chromosome 4q ‘Chr 4q Del’; Supplementary Table 4b) are shown by red arrows. Composite phylogeny tree based on consistent evolutionary patterns across all trees in c (d). The meta-analysis P value was calculated using Fisher’s method by combining bootstrap-derived P values from individual trees in c. NS, not significant.
Fig. 3 |
Fig. 3 |. Single-cell sequencing reveals Myc pathway activation as a cell-intrinsic feature of bone metastasis.
ac, Single-cell RNA-seq of primary tumor and bone metastasis. UMAP visualization of matched primary tumor and bone samples from NPKEYFP mice (Supplementary Table 5a). Sample of origin; black corresponds to the primary tumor sample and dark gray to the bone sample (a). Unsupervised clustering; colors indicate distinct clusters of cells with the relative percentages of the primary tumor and bone samples indicated (b). Scaled expression (DESeq2 normalized values) of YFP, Cd45 and Ck8 expression levels and AR activity levels (based on previous work) (c). d,e, Analysis of isolated primary tumor and bone metastatic cell clusters. Sample of origin (d). Black corresponds to the primary tumor cells and dark gray to the bone metastatic cells. Enrichment of the bone metastasis signature from bulk RNA-seq (Supplementary Table 2c) in bone metastatic versus primary tumor cells (e). P value was calculated by a two-sample two-tailed Welch t-test. f,g, Pathway-based GSEA. GSEA comparing pathways enriched in mouse bone metastasis signature (from bulk RNA-seq, Supplementary Table 6a) with those enriched in the single-cell bone metastasis signature (Supplementary Table 5c) (f). The red bar shows the location of the hallmarks MYC pathway, which is the top-most enriched pathway across the two signatures. GSEA comparing pathways enriched in a signature from the bulk RNA-seq comparing bone metastases and normal bone (Supplementary Table 6b) with those enriched in the single-cell bone metastasis signature (Supplementary Table 5c) (g). GSEA using genes from the MYC hallmarks pathway to query the single-cell bone metastasis signature (Supplementary Table 5a) h,i Gene-based GSEA. (h). GSEA using genes from MYC hallmarks pathway to query a signature based on single-cell resident nontumor bone cells versus primary tumor cells (Supplementary Table 5b) (i). NES and P values were estimated using 1,000 gene or pathway permutations, as appropriate (fi). SC, single cell.
Fig. 4 |
Fig. 4 |. Co-activation of MYC and RAS pathways in prostate cancer metastasis.
a,b, Cross-species pathway analysis. GSEA comparing pathways enriched in the Balk human bone metastasis signature (Supplementary Table 6c) with those in the mouse single-cell bone metastasis signature (a) (Supplementary Table 5c) or those enriched in the mouse bulk RNA bone metastasis signature (b) (Supplementary Table 6a). NES and P values were estimated using 1,000 pathway permutations. The red bar shows the hallmarks MYC pathway, which is the top-most enriched conserved pathways in both signatures. c, Representative immunohistochemical analyses of MYC expression in bone metastases, based on analysis of 34 mCRPC patient samples, including 12 with bone metastases (Supplementary Table 7). dg, Violin plots depicting distribution of MYC and RAS pathway activation in primary tumors and metastases in human cancer and in the NPKEYFP mice. Comparison of human primary tumors (TCGA, n = 497) versus metastases (SU2C, n = 270) (Supplementary Table 3) (d,f). Comparison of primary tumors (n = 13) and bone metastases (n = 10) from the NPKEYFP mice (e,g). The distribution of the NESs (y axis) represent MYC activity levels based on single-sample GSEA (see Extended Data Fig. 4d) (d,e). The activity scores (y axis) represent RAS pathway activity levels (based on the absolute-valued average of RAS-related genes as in previous works,) (f,g). P values for all violin plots were estimated using two-sample one-tailed Welch t-test. In the violin plots with embedded box plots, boxes show the 25th–75th percentile, center lines show the median and whiskers show the minimum–maximum values. h, MYC and RAS co-activation in human primary tumors and metastases. Primary tumors and metastases classified as MYC- or RAS-activated are depicted in a heat map in red, whereas those without MYC- or RAS activation are represented in blue. Samples were considered MYC-activated if NES scores from single-sample GSEA using MYC hallmarks pathway were greater than the average of overall MYC activity across the cohorts. Samples were considered RAS-activated if the absolute-valued average of RAS-related genes, was greater than the average of overall RAS activity across the cohorts. A black rectangle shows the samples in which MYC and RAS were co-activated. A two-tailed P value was calculated using Fisher’s exact test.
Fig. 5 |
Fig. 5 |. Analysis of Myc function in an allograft model of bone metastasis.
a, Strategy. Cells from a bone metastasis (femur) of NPKEYFP mice were established using a procedure described previously. The original cells were passaged in nude mouse hosts via intracardiac injection. Cells isolated from an ensuing bone metastasis, termed NPKEYFP bone cells, were used herein. b, Western blot image showing total protein extracts from NPKEYFP bone cells infected with shRNAs to silence Myc (shMyc-1, 70% inhibition; shMyc-2, 90% inhibition) or with shControl. The approximate molecular weights of markers (kDa) are indicated; actin is a control for protein loading. A representative blot is shown from two independent experiments. The uncropped western blot image is shown in Source Data Fig. 5. c, Quantification of the number of metastases in bone or lung from NPK bone cells infected with shMyc-1 or shMyc-2 or shControl and introduced into nude mouse hosts via intracardiac injection to evaluate metastasis in vivo. P values were estimated by one-way analysis of variance (ANOVA) with Dunnett’s multiple comparisons against shControl; (P < 0.05). In box plots, boxes show the 25th–75th percentile with the median and whiskers show the minimum–maximum (n = 10 mice from two independent experiments). d, Representative ex vivo imaging of n = 10 mice showing YFP fluorescence from the heart (injection site), lung and the indicated bones from nude mouse hosts following via intracardiac injection of NPKEYFP bone cells that had been infected with shControl, shMyc-1 or shMyc-2. e, Representative images (n = 3) of vertebrae showing ex vivo fluorescence, H&E or immunostaining for YFP or Myc, as indicated. Scale bars, 0.1 cm for ex vivo fluorescence images and 50 μm for all other images.
Fig. 6 |
Fig. 6 |. Analysis of MYC function in a new GEMM.
ad, Comparative analyses of the tumor and metastatic phenotypes of NPEYFP (n = 35), NPMEYFP (n = 23), NPKEYFP (n = 106) and NPKMEYFP (n = 10) mice. Representative bright-field and ex vivo fluorescence images of prostate, lung and bone (spine) (a). Scale bars, 0.1 cm. Dot-plots showing tumor weights (b). GU, genitourinary. Center lines show the mean, error bars depict s.d.; P value is shown for one-way ANOVA with Dunnett’s multiple comparison test of NPMEYFP and NPEYFP mice. Kaplan–Meier curves showing overall survival (c); P value calculated using a two-tailed log-rank test. Bar graphs showing the percentage of mice with metastasis to lung and bone (d). e,f, Violin plots depicting the distribution of Myc (e) and Ras (f) pathway activity levels in primary tumors of NPMEYFP (n = 3) and NPKEYFP (n = 13) mice and bone metastases of NPKEYFP mice (n = 10). Myc activity is based on single-sample GSEA and Ras pathway activity is based on the absolute-valued average of RAS-related genes as in previous works,. P values were estimated using a two-sample one-tailed Welch t-test. In the violin plots with embedded box plots, boxes show the 25th–75th percentile, center lines show the median and whiskers show the minimum–maximum values.
Fig. 7 |
Fig. 7 |. MEtA-16 is correlated with MYC and RAS pathway activation and enriched in prostate cancer metastasis.
a,b, Discovery of the META-16 gene signature. Step 1, genome-wide Spearman correlation to MYC expression in PROMOTE cohort (which includes 55 bone metastases), identified 559 (PROMOTE-559) positively correlated genes (FDR P value < 0.0001, Spearman rank correlation coefficient rho plotted in the x axis in b) (a). Step 2, GSEA using PROMOTE-559 to query the mouse (NPKEYFP) and human (Balk) bone metastasis signatures (Extended Data Fig. 7a,b) (b). The leading-edge (LE) genes from mice are projected on the y axis and from humans, on the z axis (b). These analyses identified 55 genes (META-55, highlighted in red in b). Step 3, ranking of META-55 according to metastasis-free survival identified 16 genes (META-16, shown by name in b). c,d, UMAP projection of single-cell RNA-seq showing the primary tumor and bone metastatic cells (Fig. 3d). Enrichment of MYC pathway (c) and expression of META-16 (d). Scaled DESeq2 normalized values are depicted. The correlation between META-16 expression and MYC pathway activity was estimated using Spearman’s rank correlation. e, GSEA using META-16 to query single-cell bone metastasis signature (Supplementary Table 5a); NES and P values were estimated using 1,000 gene permutations. f, Violin plot depicting distribution of the NESs (y axis), which reflect activity levels of META-16 (Extended Data Fig. 8b) in primary tumors from TCGA (n = 497) compared with metastases from SU2C (n = 270) (Supplementary Table 3). P value was estimated using a two-sample one-tailed Welch t-test. In the violin plots with embedded box plots, boxes show the 25th–75th percentile, center lines show the median and whiskers show the minimum–maximum values. g, Heat map representation of individual expression levels of META-16 genes in patient samples from TCGA and SU2C cohorts. Gleason scores are shown for the primary tumors; metastases include all metastases in the SU2C cohort. Row-scaled expression values are shown (indicated by color).
Fig. 8 |
Fig. 8 |. The MEtA-16 signature is associated with metastasis-free and treatment-associated survival.
a–c, Association of META-16 with time to metastasis. Kaplan–Meier survival analyses comparing patients with low and high combined expression of META-16 in the MAYO (n = 235) and JHMI (n = 260) cohorts (Extended Data Fig. 10a,b) (a,b). P values were estimated using a log-rank test. Multivariable survival analysis of META-16 with the JHMI and MAYO cohorts (c). CI, confidence interval; HR, hazard ratio. P values were estimated from a Cox proportional hazards model. d,e, Kaplan–Meier survival analyses comparing patients from the SU2C cohort with low and high combined expression of META-16, showing treatment-associated survival (time from the start of treatment with ARSI therapy, to death or last follow-up; n = 75 patients) or treatment-associated disease progression (time on treatment with ARSIs; n = 56) as defined previously. P values were estimated using a log-rank test.

References

    1. Sartor O & de Bono JS Metastatic prostate cancer. N. Engl. J. Med 378, 645–657 (2018). - PubMed
    1. Scher HI & Sawyers CL Biology of progressive, castration-resistant prostate cancer: directed therapies targeting the androgen-receptor signaling axis. J. Clin. Oncol 23, 8253–8261 (2005). - PubMed
    1. Watson PA, Arora VK & Sawyers CL Emerging mechanisms of resistance to androgen receptor inhibitors in prostate cancer. Nat. Rev. Cancer 15, 701–711 (2015). - PMC - PubMed
    1. Rickman DS, Beltran H, Demichelis F & Rubin MA Biology and evolution of poorly differentiated neuroendocrine tumors. Nat. Med 23, 1–10 (2017). - PubMed
    1. Halabi S et al. Meta-analysis evaluating the impact of site of metastasis on overall survival in men with castration-resistant prostate cancer. J. Clin. Oncol 34, 1652–1659 (2016). - PMC - PubMed

Publication types

Substances