. 2021 Feb;2(2):189-200.
doi: 10.1038/s43018-020-00160-x. Epub 2021 Jan 11.

Targeting glutamine dependence through GLS1 inhibition suppresses ARID1A-inactivated clear cell ovarian carcinoma

Affiliations

Targeting glutamine dependence through GLS1 inhibition suppresses ARID1A-inactivated clear cell ovarian carcinoma

Shuai Wu et al. Nat Cancer. 2021 Feb.

Abstract

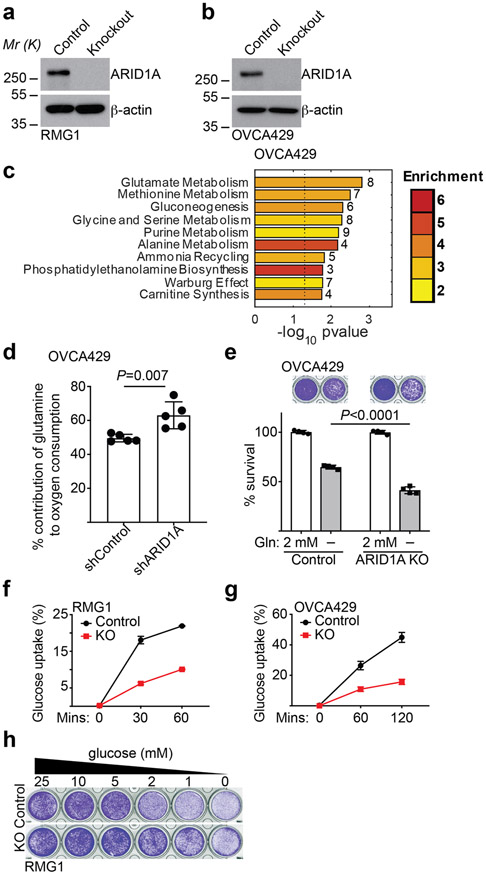
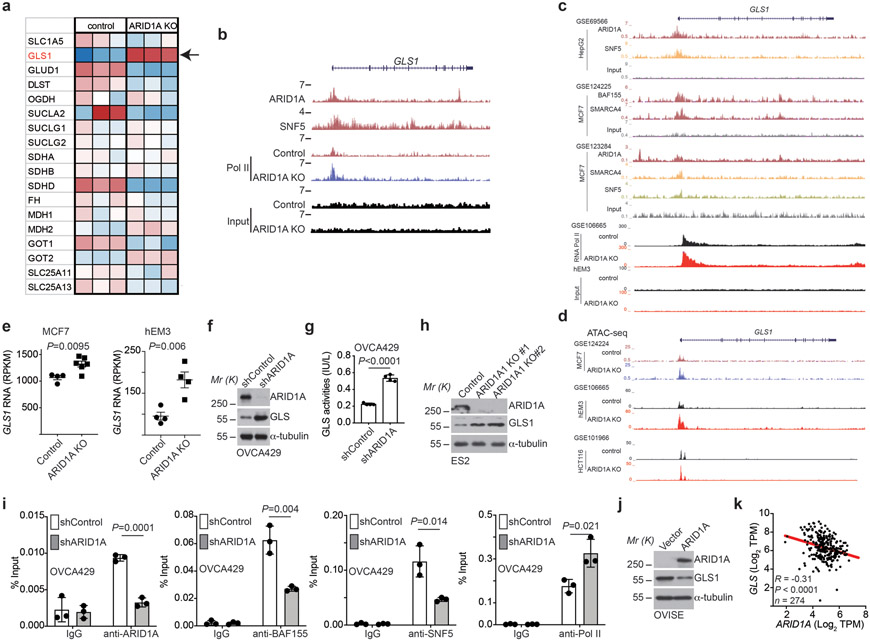
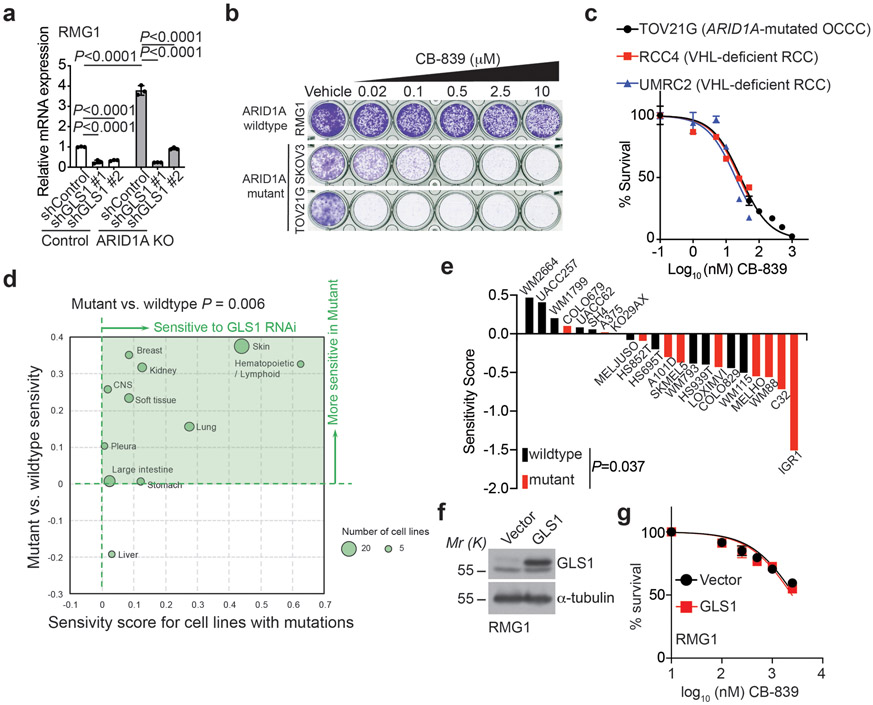
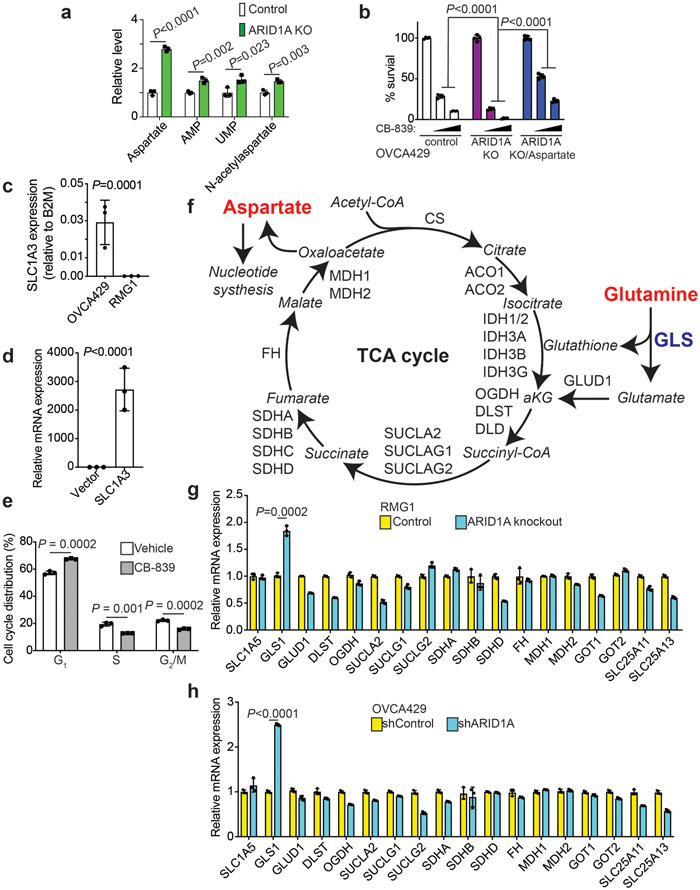
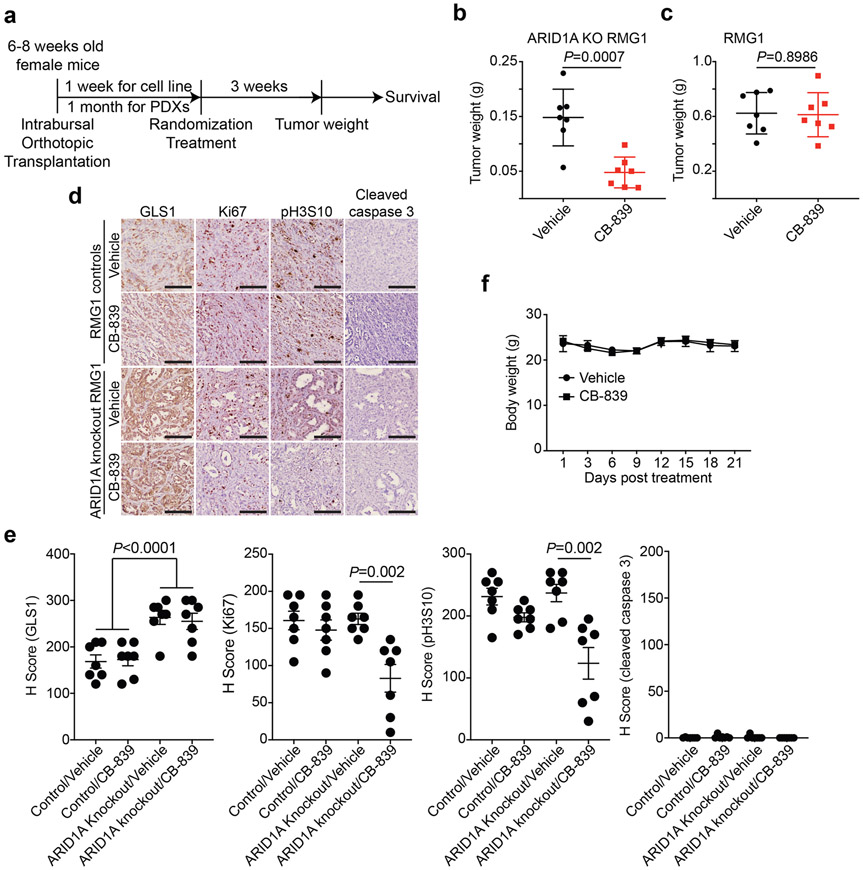
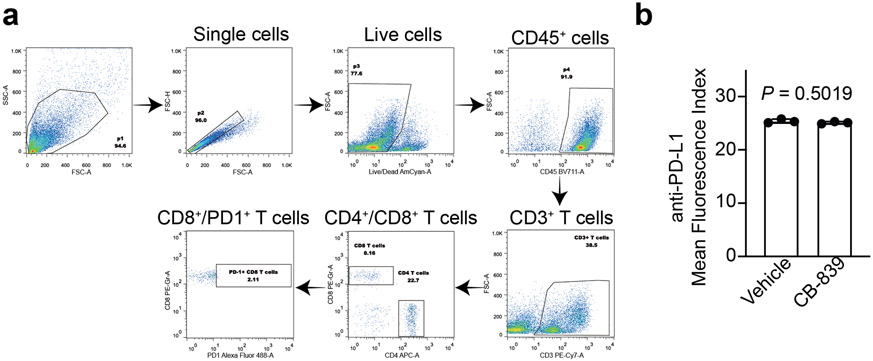
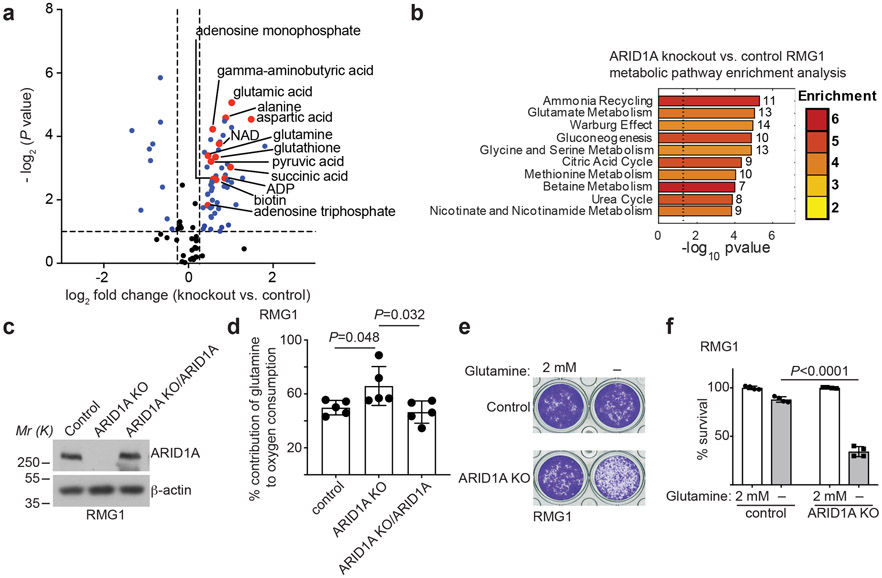
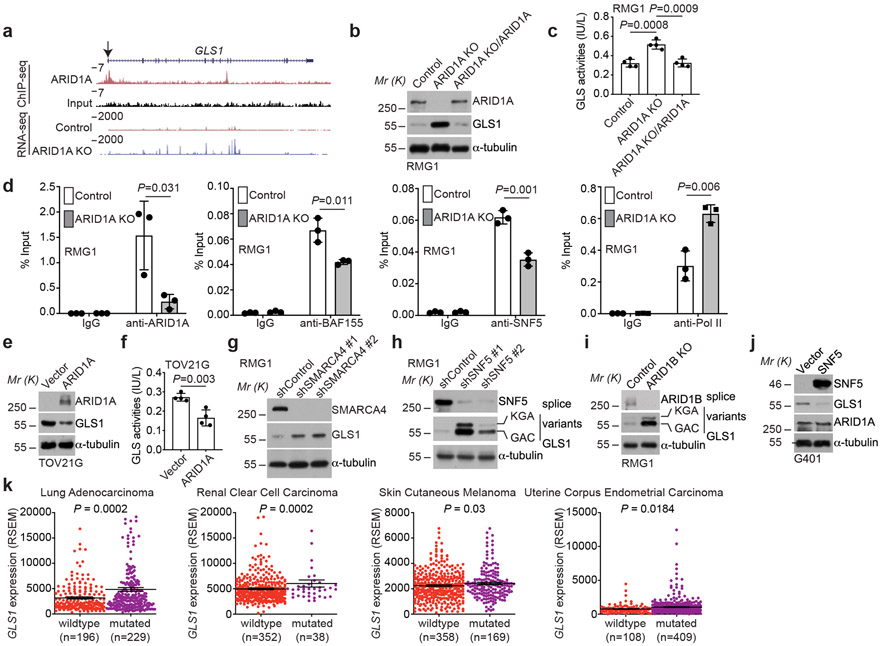
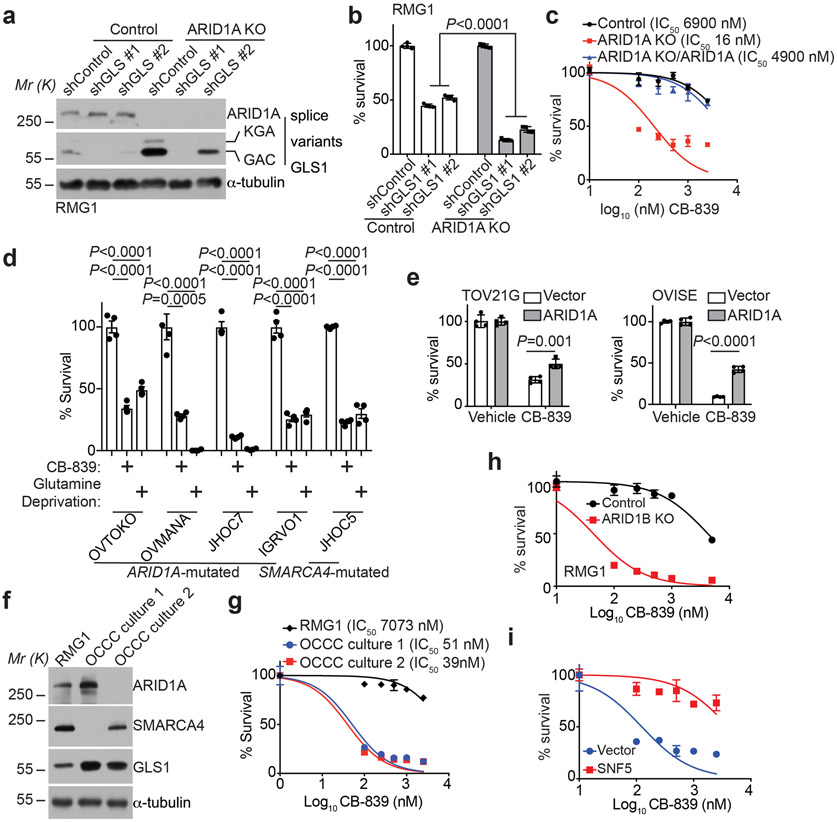
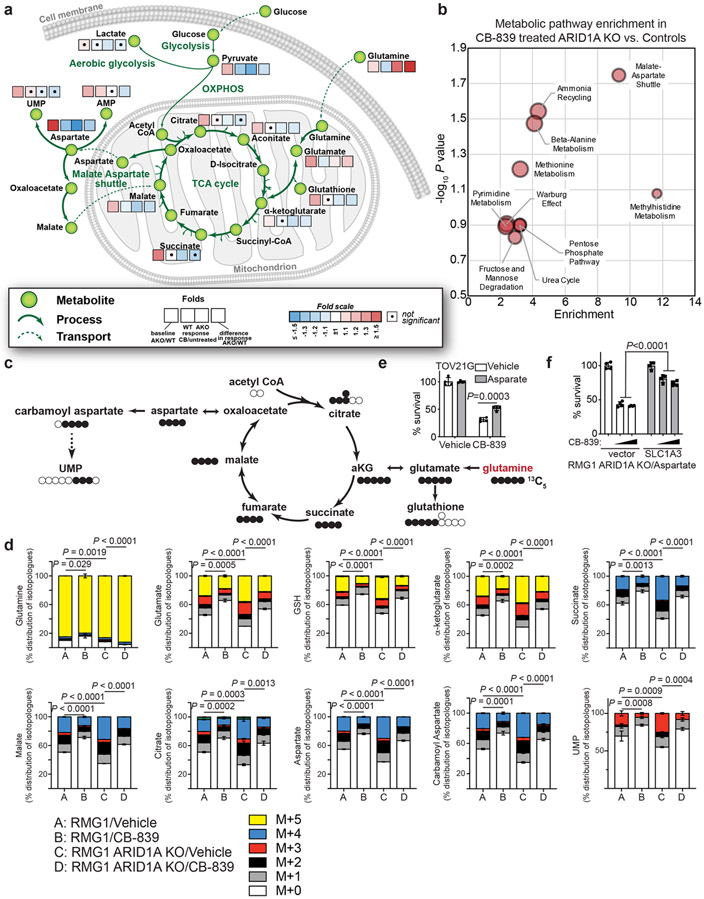
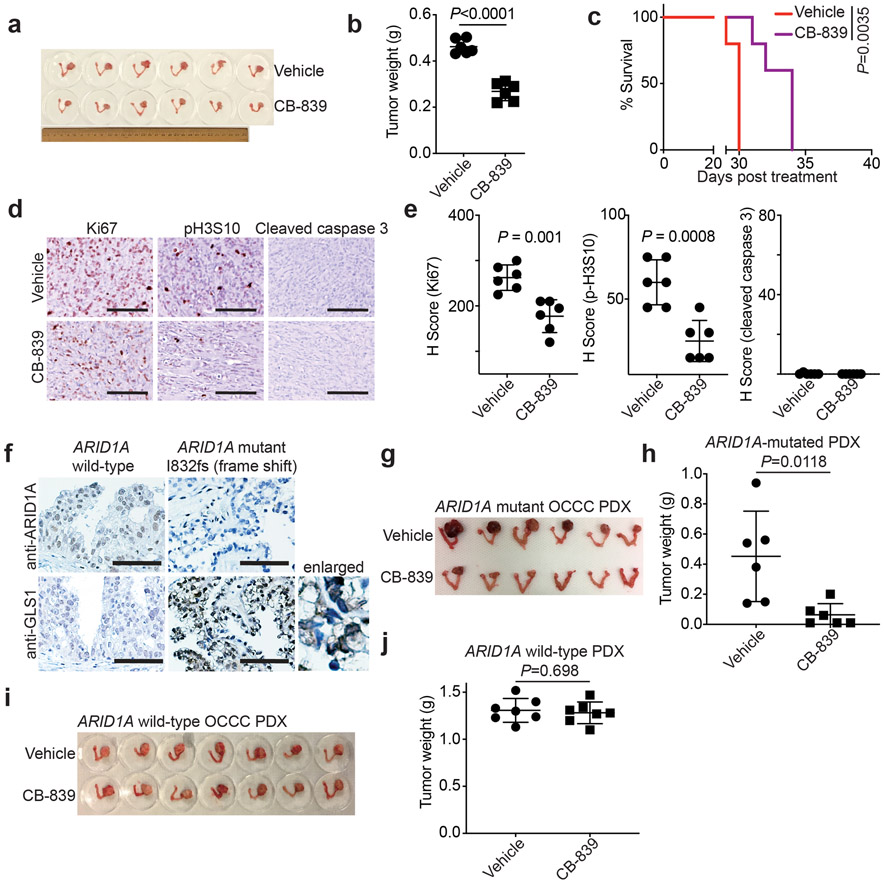
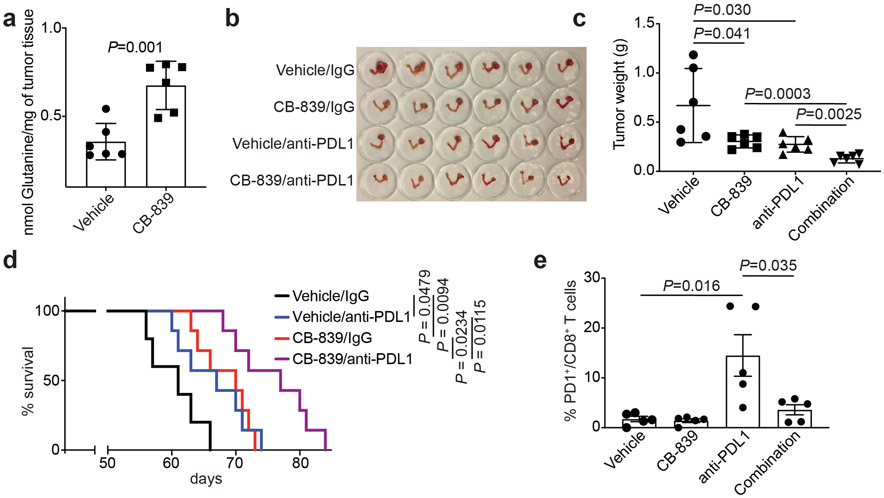
Alterations in components of the SWI/SNF chromatin-remodeling complex occur in ~20% of all human cancers. For example, ARID1A is mutated in up to 62% of clear cell ovarian carcinoma (OCCC), a disease currently lacking effective therapies. Here we show that ARID1A mutation creates a dependence on glutamine metabolism. SWI/SNF represses glutaminase (GLS1) and ARID1A inactivation upregulates GLS1. ARID1A inactivation increases glutamine utilization and metabolism through the tricarboxylic acid cycle to support aspartate synthesis. Indeed, glutaminase inhibitor CB-839 suppresses the growth of ARID1A mutant, but not wildtype, OCCCs in both orthotopic and patient-derived xenografts. In addition, glutaminase inhibitor CB-839 synergizes with immune checkpoint blockade anti-PDL1 antibody in a genetic OCCC mouse model driven by conditional Arid1a inactivation. Our data indicate that pharmacological inhibition of glutaminase alone or in combination with immune checkpoint blockade represents an effective therapeutic strategy for cancers involving alterations in the SWI/SNF complex such as ARID1A mutations.


Figures

Extended Data Fig. 1
Extended Data Fig. 1. ARID1A inactivation creates a dependence on glutamine
a-b, Validation of ARID1A knockout in parental and ARID1A knockout RMG1 (a) and OVCA429 (b) cells. Immunoblots are representative of three independent experiments with similar results. c, Top 10 metabolic pathways enriched by ARID1A knockout in OVCA429 cells determined by metabolites set enrichment analysis (MSEA). d, Contribution of glutamine to oxygen consumption in the indicated OVCA429 cells expressing shARID1A or control analyzed by Seahorse. n= 5 independent experiments. e, Colony formation and quantification of parental and ARID1A knockout OVCA429 cells with or without glutamine deprivation for 12 days. n= 4 independent experiments. f-g, A fluorescence glucose analog 2-NBDG-based glucose uptake assayed by flow cytometry analysis for the indicated parental and ARID1A knockout RMG1 (f) or OVCA429 (g) cells. n= 4 independent experiments. h, Colony formation of parental and ARID1A knockout RMG1 cells cultured in the medium with indicated concentration of glucose for 12 days. Shown are representative images of four independent experiments. Error bars represent mean with s.d. in d, e, f and g. P values were calculated using two-tailed Student t-test in d, e and Fisher’s least significant difference test in c.
Extended Data Fig. 2
Extended Data Fig. 2. GLS1 is a direct target of the SWI/SNF complex
a, Expression of glutamine metabolism related genes in control and ARID1A knockout RMG1 cells determined by RNA-seq analysis. Note that GLS1 shows the highest upregulation in response to ARID1A knockout. n=3 independent experiments. b, The indicated ChIP-seq and input tracks in the GLS1 gene locus in parental and ARID1A knockout RMG1 cells in previously published datasets (GSE120060). c, The indicated ChIP-seq and input tracks in the GLS1 gene locus in the indicated cancer cells based on the public database mining (GSE69566, GSE124225, GSE123284 and GSE106665). d, ATAC-seq tracks in the GLS1 gene locus in parental and ARID1A knockout cells based on the indicated datasets (GSE124224, GSE106665 and GSE101966). e, Expression of GLS1 mRNA in the indicated cancer cells based on based on mining public databases (GSE124227 and GSE106665). f-g, Control and ARID1A knockdown OVCA429 cells were examined for expression of ARID1A and GLS1 by immunoblot (f) or measured for glutaminase activity (g). n= 4 independent experiments. h, Control and ARID1A knockout ES2 cells were examined for expression of ARID1A and GLS1 by immunoblot. i, The association of ARID1A, BAF155, SNF5 and RNA Pol II with the GLS1 gene promoter in parental and ARID1A knockdown OVCA429 cells was examined by ChIP-qPCR analysis. An isotype matched IgG was used as a control. n = 3 independent experiments. j, Control and wildtype ARID1A ectopically expressing OVISE cells were examined for expression of ARID1A and GLS1 by immunoblot. k, Inverse correlation between GLS1 and ARID1A expression in 274 TP53 wildtype cancer cell lines across cancer types in the Cancer Cell Line Encyclopedia RNAseq database. Immunoblots are representative of three independent experiments with similar results in f, h and j. Error bars represent mean with s.d. in e, g and i. P value was calculated using two-tailed Student t-test in e, g, i and Spearman correlation analysis in k.
Extended Data Fig. 3
Extended Data Fig. 3. Inactivation of SWI/SNF complex sensitizes cells to glutaminase inhibition
a, Validation of GLS1 knockdown by qRT-PCR in parental and ARID1A knockout RMG1 cells expressing the indicated shGLS1s or control. n= 3 independent experiments. b, Colony formation by the indicated cells treated with the indicated doses of CB-839. Shown are representative images of 4 independent experiments with similar results. c, Dose response curves to glutaminase inhibitor CB-839 determined by colony formation assay in the indicated ARID1A-mutated OCCC and VHL-deficient renal clear cell carcinoma (RCC) cell lines. n=4 independent experiments. d, Differential sensitivity of TP53 wildtype cell lines for the indicated cancer types with SWI/SNF wildtype or mutation to GLS1 knockdown in the Project Achilles dataset. Specifically, GLS1 shRNA sensitivity score for 384 cell lines along with mutation status of member of SWI/SNF complex (ARID1A, ARID1B, SMARCA2, PHF10, SMARCA4, SMARCB1, SMARCC1, SMARCC2, SMARCD3, DPF2, ACTL6A) and TP53 were downloaded from Broad Cancer Cell Line Encyclopedia database. Only 118 cells lines with wildtype TP53 were taken for analysis. Cell lines were grouped by source tissue site and categorized into mutant (at least one mutation in any members of SWI/SNF complex) and wildtype SWI/SNF complex groups. Average sensitivity scores to GLS1 RNAi for each tissue and SWI/SNF complex groups were calculated. Average mutant SNI/SNF scores were plotted versus difference between mutant and wildtype SWI/SNF complex on a bubble plot to illustrate cancer types with association between GLS1 RNAi and SWI/SNF mutation. Size of the data circles were proportional to the number of cells lines in the tissue group. Note that the criteria for including in the analysis is with minimal 5 cell lines in the database. e, Sensitivity score of SWI/SNF wildtype or mutated skin cancer cell lines with wildtype TP53 to GLS1 knockdown in the Project Achilles dataset. f-g, Expression of GLS1 in control and GLS1 ectopically expressed ARID1A wildtype RMG1 cells determined by immunoblot (f). And the indicated cells were subjected to dose response curves to glutaminase inhibitor CB-839 determined by colony formation assay (g). n=4 independent experiments. Immunoblots are representative of two independent experiments with similar results in f. Error bars represent mean with s.d. in a, c, e and g. P values were calculated using two-tailed Student t-test in a, e and one-tailed Student t-test in d.
Extended Data Fig. 4
Extended Data Fig. 4. ARID1A inactivation increases glutamine-dependent aspartate biosynthesis
a, Quantification the indicated metabolites determined by glutamine tracing in control and ARID1A knockout RMG1 cells. n= 3 independent experiments. b, Quantification of colony formation by parental or ARID1A knockout OVCAR429 cells cultured in medium supplemented with or without 5 mM aspartate treated with or without CB-839 (0.1 μM or 0.25 μM). n= 4 independent experiments. c, Expression of SLC1A3 in RMG1 and OVCA429 cells determined by qRT-PCR analysis. n= 3 independent experiments. d, Expression of SLC1A3 in ARID1A knockout RMG1 cells with or without ectopic SLC1A3 expression determined by qRT-PCR analysis. n= 3 independent experiments. e, Cell cycle distribution in RMG1 ARID1A KO cells treated with or without 1 μM CB-839 for 72 hrs determined by flow cytometry analysis. n= 3 independent experiments. f, Schematic of glutamine-dependent aspartate biogenesis through the TCA cycle. g-h, Relative expression of genes encoding for enzymes that contribute to aspartate biogenesis from glutamine through the TCA cycle determined by qRT-PCR analysis in parental control and ARID1A knockout RMG1 cells (g) or OVCA429 cells with or without ARID1A knockdown (h) cells. Validation of 3 independent experiments as shown in Extended Data Fig. 2a. Error bars represent mean with s.d. in a, b, c, d, e, g and h. P values were calculated using two-tailed Student t-test in a, b, c, d, e, g and h.
Extended Data Fig. 5
Extended Data Fig. 5. Glutaminase inhibitor CB-839 suppresses the growth of ARID1A-inactivated OCCCs in vivo
a, Schematic of experimental design and reference time of the mouse experiment. Cells were orthotopically transplanted into non-obese diabetic/severe combined immunodeficiency gamma (NSG) mice and allowed to establish for one week. After the tumors presented palpable masses, the mice were randomized into various treatment groups and treated for an additional three weeks. At the end of treatment of three weeks, mice from various treatment groups were euthanized for measuring tumor weight as a surrogate for tumor burden or followed for survival experiment. b-c, Orthotopic xenografts formed by ARID1A knockout (b) or control RMG1 cells (c) were treated with vehicle or CB-839 for 3 weeks (n=7 mice/group). At the end of the treatment, tumor weight was measured as surrogate for tumor burden. d-e, Tumors dissected from b-c, were subjected to immunological staining for GLS1, cell proliferation marker Ki67, mitotic marker serine 10 phosphorylated histone H3 (pH3S10) or apoptosis marker cleaved caspase 3 on serial sections (d) and the histological score (H-score) of the indicated markers was quantified from three separate fields from seven tumors from seven individual mice in each of the indicated treatment groups (e). Scale bar = 100 μm. f, Orthotopic xenografts formed by ARID1A-mutated TOV21G cells were treated with vehicle or CB-839 for three weeks (n=6 mice/group). Body weight of tumor bearing mice was measured at the indicated time point. Error bars represent mean with s.d. in b, c, e and f. P values were calculated using two-tailed Student t-test in b, c and e.
Extended Data Fig. 6
Extended Data Fig. 6. CB-839 does not affect PDL1 expression
a, The gating strategy used for determining the percentage of PD1+/CD8+ T cell populations. b, ARID1A-mutated TOV21G cells were treated with vehicle or CB-839 (100 nM) for 48 hours and expression of PDL1 was examined by flow cytometry analysis. n = 3 independent experiments. Error bars represent mean with s.d. in b. P values were calculated using two-tailed Student t-test in b.
Fig. 1:
Fig. 1:. ARID1A inactivation creates a dependence on glutamine.
a, Volcano plot showing changes for metabolites between control and ARID1A knockout RMG1 cells. Blue indicates changes used for enrichment analysis and red labels metabolites in glutamine metabolism. Plot shows average of 3 independent experiments (included separately as source data). b, Top 10 metabolic pathways enriched by ARID1A knockout in RMG1 cells determined by metabolites set enrichment analysis (MSEA). c, ARID1A expression in parental, ARID1A knockout RMG1 cells with or without wildtype ARID1A restoration determined by immunoblot. Shown are representative of three independent experiments with similar results. d, Contribution of glutamine to oxygen consumption in the indicated cells analyzed by Seahorse. n= 5 independent experiments. e-f, Colony formation (e) and quantification (f) of parental and ARID1A knockout RMG1 cells cultured in medium with or without glutamine deprivation for 12 days. Shown are representative of four independent experiments with similar results in e. n= 4 independent experiments in f. Error bars represent mean with s.d. in d and f. P values were calculated using two-tailed Student t-test in a, d, f and Fisher’s least significant difference test in b.
Fig. 2:
Fig. 2:. GLS1 is a direct target of the SWI/SNF complex.
a, ARID1A ChIP-seq and input tracks and RNA-seq tracks in the GLS1 gene locus in parental and ARID1A knockout RMG1 cells. Shown are representative of three independent experiments with similar results. b-c, Parental and ARID1A knockout RMG1 cells with or without wildtype ARID1A restoration were examined for expression of ARID1A and GLS1 by immunoblot (b) or measured for glutaminase activity (c). n= 4 independent experiments. d, The association of ARID1A, BAF155, SNF5 and RNA Pol II with the GLS1 gene promoter in the indicated cells was examined by ChIP-qPCR analysis. An isotype matched IgG was used as a negative control. n= 3 independent experiments. e-f, ARID1A-mutated TOV21G cells with or without wildtype ARID1A restoration were examined for ARID1A and GLS1 expression by immunoblot (e) or measured for glutaminase activity (f). n= 4 independent experiments. g-i, RMG1 cells with SMARCA4 knockdown (g), SNF5 knockdown (h) or ARID1B knockout (i) were examined for GLS1 expression by immunoblot. j, SNF5 mutant G401 cells with or without wildtype SNF5 restoration were examined for SNF5, GLS1 and ARID1A expression by immunoblot. k, GLS1 is expressed at a significantly higher levels in cancers with mutations in subunits of the SWI/SNF complex in the indicated cancer types in the TCGA dataset. Immunoblots are representative of two independent experiments with similar results in b, e, g, h, i and j. Error bars represent mean with s.d. in c, d, f and k. P values were calculated using two-tailed Student t-test in c, d, f and k.
Fig. 3:
Fig. 3:. Inactivation of the SWI/SNF complex sensitizes cells to glutaminase inhibition.
a-b, Parental and ARID1A knockout RMG1 cells expressing the indicated shGLS1s or control were examined for ARID1A and GLS1 expression by immunoblot (a) or subjected to colony formation and the colonies formed by the indicated cells were quantified (b). n=4 independent experiments. c, Dose response curves of the indicated parental and ARID1A knockout RMG1 cells with or without wildtype ARID1A restoration to glutaminase inhibitor CB-839 determined by colony formation assay. n=4 independent experiments. d, Growth inhibition of the indicated ARID1A or SMARCA4-mutated ovarian clear cell cancer cell lines treated with 0.5 μM CB-839 or glutamine deprivation based on a 12-day colony formation assay. n=4 independent experiments. e, Quantification of growth of TOV21G and OVISE cells with or without wildtype ARID1A restoration treated with or without 0.05 μM or 10 μM CB-839 for 12 days based on colony formation assay. n=4 independent experiments. f, Expression of ARID1A and GLS1 in the indicated ARID1A or SMARCA4-inactivated primary OCCC cultures. g, Dose response curves of the indicated ARID1A or SMARCA4-inactivated primary OCCC cultures to glutaminase inhibitor CB-839 determined by colony formation assay. RMG1 cells were used as a control. n=4 independent experiments. h, Dose response curves of the indicated parental and ARID1B knockout RMG1 cells to glutaminase inhibitor CB-839 determined by colony formation assay. n=4 independent experiments. i, Dose response curves of the indicated parental and wildtype SNF5 restored G401 cells to glutaminase inhibitor CB-839 determined by colony formation assay. n=4 independent experiments. Immunoblots are representative of two independent experiments with similar results in a and f. Error bars represent mean with s.d. in b, c, d, e, g, h and i. P values were calculated using Student two-tailed t-test in b, d and e.
Fig. 4:
Fig. 4:. ARID1A inactivation increases glutamine-dependent aspartate biosynthesis.
a, Control and ARDI1A knockout RMG1 cells treated with or without glutaminase inhibitor CB-839 were subjected to LC-MS/MS analysis. Heat map indicates fold changes in comparison to parental control without CB-839 treatment. n= 3 independent experiments. b, Analysis of metabolic pathways enriched in CB-839 treated ARID1A knockout RMG1 cells compared with CB-839 treated parental RMG1 cells. c, Schematic of glutamine tracing of aspartate biogenesis. d, The indicated cells were incubated for 16 hours in the presence of 13C5-glutamine and intracellular metabolites were extracted for analysis by LC-MC to evaluate glutamine-dependent metabolism. Mass isotopologues (M+X) analysis of the indicated metabolites are shown as percentage of indicated number of carbons labeled with heavy isotype. n= 3 independent experiments. e, Quantification of colony formation of TOV21G cells treated with or without 0.05 μM CB-839 cultured in the medium supplemented with or without 5 mM aspartate. n= 4 independent experiments. f, Quantification of colony formation by ARID1A knockout RMG1 cells with or without ectopic aspartate transport SLC1A3 expression cultured in medium supplemented with 5 mM aspartate treated with or without the indicated concentration of CB-839. n= 4 independent experiments. Error bars represent mean with s.d. in d, e and f. P values were calculated using two-tailed Student t-test in a, d, e, f and Fisher’s least significant difference test in b.
Fig. 5:
Fig. 5:. Glutaminase inhibition suppresses the growth of ARID1A-inactivated OCCCs in vivo.
a-e, Orthotopic xenografts formed by ARID1A-mutated TOV21G cells were treated with vehicle or CB-839. Shown are images of reproductive tracks with tumors from the indicated groups at the end of treatment (a). Tumor weight was measured as surrogate for tumor burden (n=6 mice/group) (b). After stopping the treatment, the mice from the indicated treatment groups were followed for survival by Kaplan-Meier method (n=5 mice/group) (c). Dissected tumors from the indicated treatment groups were subjected to immunohistochemical staining for cell proliferation marker Ki67, mitotic marker p-H3S10 or apoptosis marker cleaved caspase 3 on serial sections (d) and the histological score (H-score) of the indicated markers was quantified from three separate fields from six tumors from six individual mice in each of the indicated treatment groups (e). Scale bar = 100 μm. f, Expression of ARID1A and GLS1 in the indicated ARID1A wildtype or mutated OCCC PDXs determined by immunohistochemical staining. Shown are representative images of three independent technical replicates from the same pair of ARID1A wildtype and mutant PDXs. Bars = 100 μm. g-h, Mice bearing ARID1A-mutated OCCC PDXs were treated with vehicle or CB-839 (n=6 mice/group). Shown are images of reproductive tracks with tumors from the indicated groups at the end of treatment (g). Tumor weight was measured as surrogate for tumor burden (h). i-j, Same as g-h, but for ARID1A wildtype OCCC PDXs (n=7 mice/group). Error bars represent mean with s.d. in b, e, h and j. P values were calculated using two-tailed Student t-test in b, e, h, j and log-rank test in c.
Fig. 6:
Fig. 6:. Glutaminase inhibition in combination with immune checkpoint blockade suppresses the growth of Arid1a/Pik3ca OCCC.
a, Glutamine levels in the OCCCs developed from the Arid1a/Pik3ca genetic mouse model treated with vehicle control or CB-839 (n=6 mice/group). b-c, Mice bearing Arid1a/Pik3ca OCCCs were randomized into four indicated treatment groups. Shown are images of reproductive tracts with tumors from the indicated groups at the end of treatment (b). Tumor weight was measured as surrogate for tumor burden (c) (n=6 mice/group). d, After completing treatment, the mice were followed for survival, and the Kaplan-Meier survival curves for each of the indicated groups are shown (n=7 mice/group). e, At end of treatment, percentage of PD1 positive CD8 T cells was assessed by flow cytometry in the peritoneal wash in which tumors have disseminated. Error bars represent mean with s.d. in a and c, and with s.e.m. in e. P values were calculated using two-tailed Student t-test in a, c, e and log-rank test in d.

References

    1. Kadoch C & Crabtree GR Mammalian SWI/SNF chromatin remodeling complexes and cancer: Mechanistic insights gained from human genomics. Sci Adv 1, e1500447 (2015). - PMC - PubMed
    1. Wilson BG & Roberts CW SWI/SNF nucleosome remodellers and cancer. Nature reviews. Cancer 11, 481–492 (2011). - PubMed
    1. Fukumoto T, Magno E & Zhang R SWI/SNF Complexes in Ovarian Cancer: Mechanistic Insights and Therapeutic Implications. Mol Cancer Res 16, 1819–1825 (2018). - PMC - PubMed
    1. Bailey MH et al. Comprehensive Characterization of Cancer Driver Genes and Mutations. Cell 173, 371–385 e318 (2018). - PMC - PubMed
    1. Lawrence MS et al. Discovery and saturation analysis of cancer genes across 21 tumour types. Nature 505, 495–501 (2014). - PMC - PubMed

Methods-only References

    1. Wu S et al. SWI/SNF catalytic subunits' switch drives resistance to EZH2 inhibitors in ARID1A-mutated cells. Nat Commun 9, 4116 (2018). - PMC - PubMed
    1. Skene PJ, Henikoff JG & Henikoff S Targeted in situ genome-wide profiling with high efficiency for low cell numbers. Nat Protoc 13, 1006–1019 (2018). - PubMed
    1. Zhao B et al. ARID1A promotes genomic stability through protecting telomere cohesion. Nat Commun 10, 4067 (2019). - PMC - PubMed
    1. Wu S et al. ARID1A spatially partitions interphase chromosomes. Sci Adv 5, eaaw5294 (2019). - PMC - PubMed
    1. Raab JR, Resnick S & Magnuson T Genome-Wide Transcriptional Regulation Mediated by Biochemically Distinct SWI/SNF Complexes. PLoS Genet 11, e1005748 (2015). - PMC - PubMed

Publication types