. 2021 Aug;71(1):e12747.
doi: 10.1111/jpi.12747. Epub 2021 Jun 14.

Melatonin reshapes the mitochondrial network and promotes intercellular mitochondrial transfer via tunneling nanotubes after ischemic-like injury in hippocampal HT22 cells

Affiliations

Melatonin reshapes the mitochondrial network and promotes intercellular mitochondrial transfer via tunneling nanotubes after ischemic-like injury in hippocampal HT22 cells

Maria Gemma Nasoni et al. J Pineal Res. 2021 Aug.

Abstract

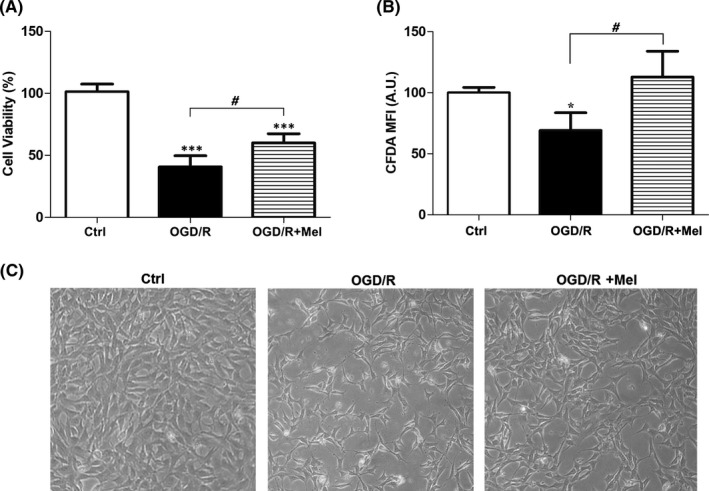
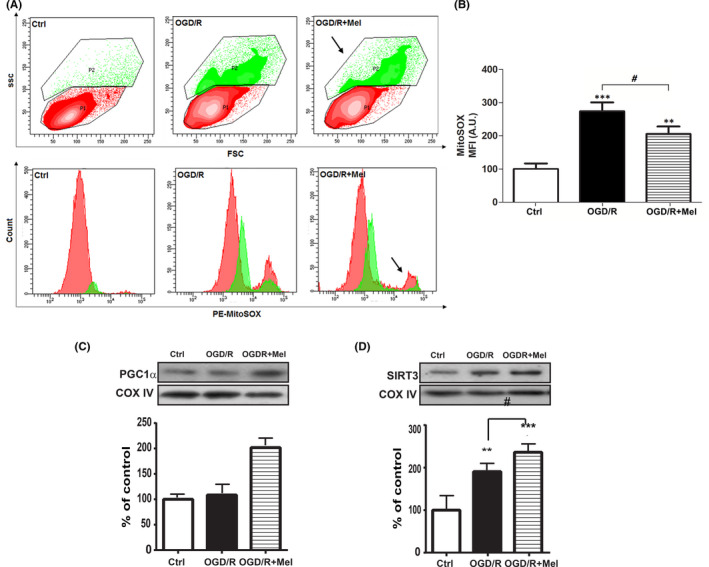
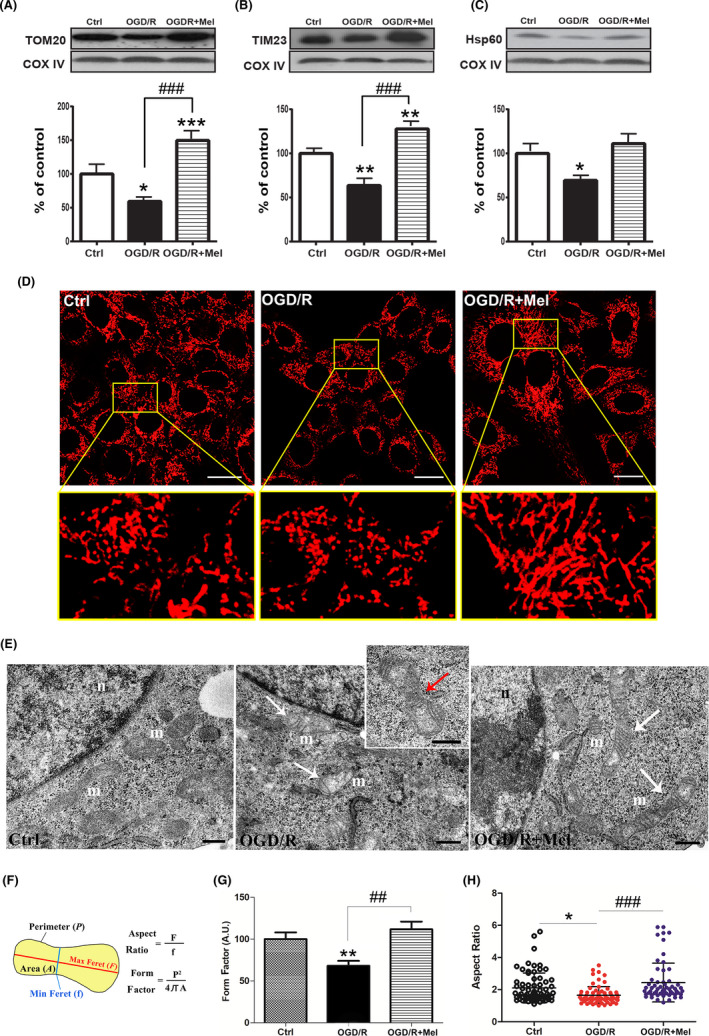
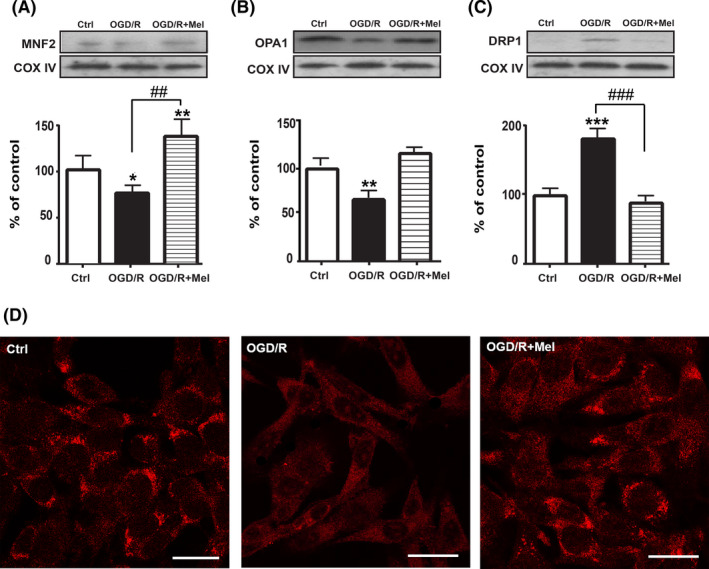
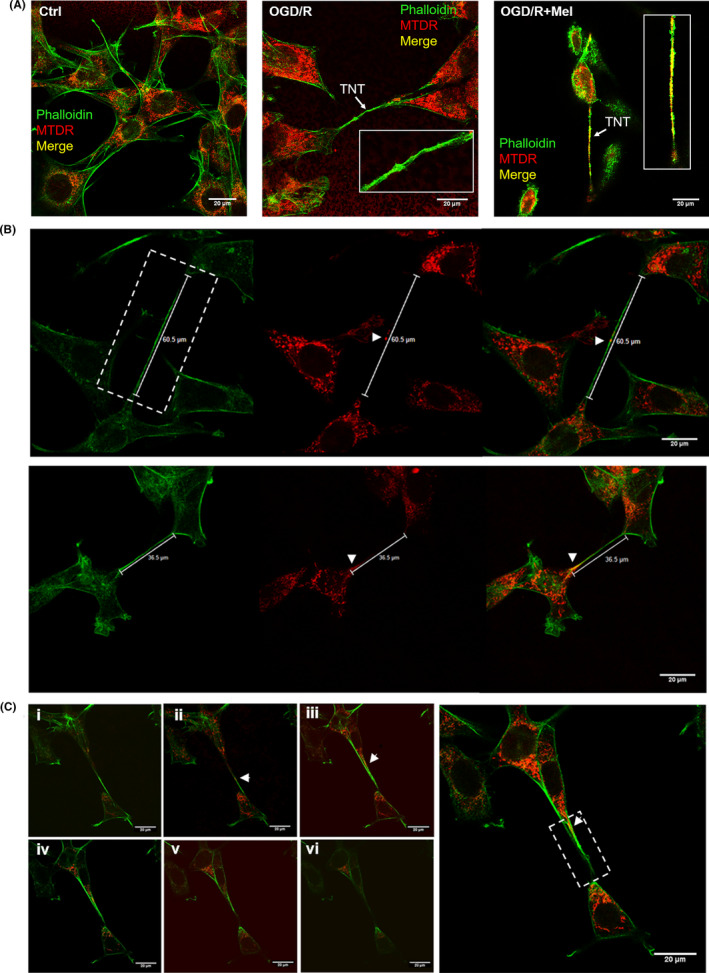
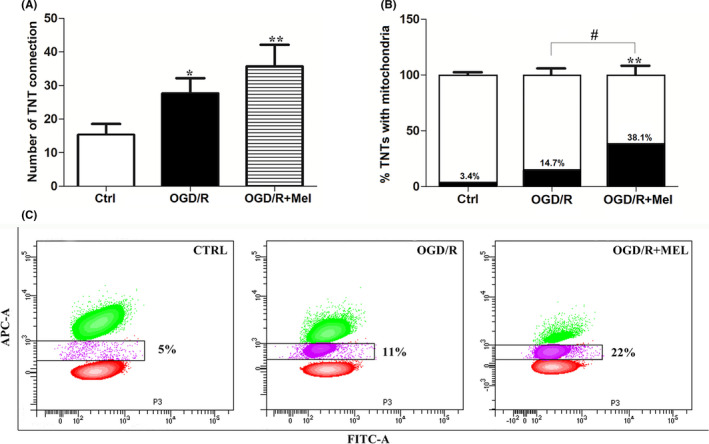
Mitochondrial dysfunction is considered one of the hallmarks of ischemia/reperfusion injury. Mitochondria are plastic organelles that undergo continuous biogenesis, fusion, and fission. They can be transferred between cells through tunneling nanotubes (TNTs), dynamic structures that allow the exchange of proteins, soluble molecules, and organelles. Maintaining mitochondrial dynamics is crucial to cell function and survival. The present study aimed to assess the effects of melatonin on mitochondrial dynamics, TNT formation, and mitochondria transfer in HT22 cells exposed to oxygen/glucose deprivation followed by reoxygenation (OGD/R). The results showed that melatonin treatment during the reoxygenation phase reduced mitochondrial reactive oxygen species (ROS) production, improved cell viability, and increased the expression of PGC1α and SIRT3. Melatonin also preserved the expression of the membrane translocase proteins TOM20 and TIM23, and of the matrix protein HSP60, which are involved in mitochondrial biogenesis. Moreover, it promoted mitochondrial fusion and enhanced the expression of MFN2 and OPA1. Remarkably, melatonin also fostered mitochondrial transfer between injured HT22 cells through TNT connections. These results provide new insights into the effect of melatonin on mitochondrial network reshaping and cell survival. Fostering TNTs formation represents a novel mechanism mediating the protective effect of melatonin in ischemia/reperfusion injury.

Keywords: HT22; melatonin; mitochondrial network; oxygen-glucose deprivation; tunneling nanotubes.


Conflict of interest statement

The authors of this paper declare that they do not have any conflict of interest.

Figures

FIGURE 1
FIGURE 1
Effect of melatonin on HT22 cell viability after OGD/R treatment. A, the percentage of viable cells analyzed by the Trypan Blue exclusion test in untreated cells (Ctrl), 8 h OGD‐exposed cells followed by 18 h reoxygenation (OGD/R) and 8 h OGD‐exposed cells followed by 18 h reoxygenation in the presence of 50 µmol/L melatonin (OGD/R+Mel). B, 5‐CFDA mean fluorescence intensity (MFI) in Ctrl, OGD/R, and OGD/R+Mel cells. Mean values were converted to arbitrary units (AU) setting control as 100. C, morphological changes in Ctrl, OGD/R, and OGD/R+Mel cells acquired by an optical microscope with 10× objective. Each value is expressed as percentage ±SD (N = 3 independent experiments performed in triplicate); *P < .05, ***P < .001 vs Ctrl; # P < .05 vs OGD/R+Mel
FIGURE 2
FIGURE 2
Effect of melatonin on mitochondrial ROS production and PGC1α and SIRT3 expression in OGD/R‐injured HT22 cells. A, representative flow cytometric contour plots (upper panels) and histograms (lower panels) of MitoSox Red labeling in untreated cells (Ctrl), 8 h OGD‐exposed cells followed by 18 h reoxygenation (OGD/R), and 8 h OGD‐exposed cells followed by 18 h 50 µmol/L melatonin reoxygenation (OGD/R+Mel). P1 (red area) and P2 (green area) indicate cells with low and high MitoSOX MFI, respectively. Arrows indicate the MFI decrease of the P2 population. B, flow cytometry analysis of MitoSOX Red labeling in Ctrl, OGD‐R, and OGD/R+Mel. Results are expressed as mean fluorescence intensity (MFI) converted to arbitrary units (AU) setting control as 100. Each value is expressed as a relative mean ± SD (N = 3 independent experiments performed in triplicate); **P < .05, ***P < .001 vs Ctrl; # P <.05 vs OGD/R+Mel. Representative Western blots and quantitative evaluation of PGC1α (C) and SIRT3 (D) expression in Ctrl, OGD/R, and OGD/R+Mel cells. Data normalized to the loading control COX IV are expressed as % of control and are the mean ±SD (N = 3 independent experiments); **P < .01; ***P < .001 vs Ctrl, #P < .05, ###P < .001 vs OGD/R+Mel
FIGURE 3
FIGURE 3
Effect of melatonin on mitochondrial mass in OGD/R‐injured HT22 cells. Representative Western blots and quantitative evaluation of TOM20 (A), TIM23 (B), and Hsp60 (C) expression in untreated HT22 cells (Ctrl), 8 h OGD‐exposed cells followed by 18 h reoxygenation (OGD/R), and 8 h OGD‐exposed cells followed by 18 h 50 µmol/L melatonin reoxygenation (OGD/R+Mel). Data normalized to the loading control COX IV are expressed as % of control and are the mean ± SD (N = 3 independent experiments); *P < .05, **P < .01, ***P <.001 vs Ctrl; ###P < .001 vs OGD+Mel. D, representative confocal images of mitochondrial morphology in Ctrl, OGD/R, and OGD/R+Mel cells. Cells were stained with 100 nmol/L MitoTracker Deep Red (MTDR). The region bounded by box is shown as an enlarged region for each experimental condition. Scale bars: 20 μm. E, TEM analysis of mitochondrial structure in Ctrl, OGD/R, and OGD/R+Mel cells. Mitochondria (m) appear rounded with irregular and disorganized cristae in OGD/R cells (white arrows). The insert shows mitochondria with the morphologic constriction point (red arrow). On the contrary, tubular elongated mitochondria with straight and parallel cristae are visible in OGD/R+Mel cells (white arrows). n, Nucleus; Scale bar: 0.5 μm. F, graphical representation of morphological meaning of the Form Factor (FF) and the Aspect Ratio (AR) parameters. G, FF quantification in Ctrl, OGD/R, and OGD/R+Mel cells. FF values were converted to arbitrary units (AU) and expressed as % of Ctrl (10 images were assessed for each experimental condition); H, AR quantification in Ctrl, OGD/R, and OGD/R+Mel cells. Scatter plot represents the AR values distribution. Numbered data points represent individual mitochondria manually traced. 20 images were analyzed and at least n = 50 mitochondria were quantified for each experimental group. Values were expressed as mean ± SD (N = 3 independent experiments performed in triplicate); *P < .05, **P < .01 vs Ctrl, ##P < .01, ###P < .001
FIGURE 4
FIGURE 4
Effect of melatonin on the mitochondrial fusion/fission proteins. Representative Western blots and quantitative evaluation of MFN2 (A), OPA1 (B), and DRP1 (C) expression in untreated cells (Ctrl), 8 h OGD‐exposed cells followed by 18 h reoxygenation (OGD/R), and 8 h OGD‐exposed cells followed by 18 h 50 µmol/L melatonin reoxygenation (OGD/R+Mel). Data normalized to the loading control COX IV are expressed as % of control and are the mean ± SD (N = 3 independent experiments performed in triplicate); *P < .05; **P < .01; ***P < .001 vs Ctrl; ##P < .01, ###P < .001 vs OGD+Mel. D, confocal images of intracellular localization of MFN2 by immunofluorescence in Ctrl, OGD/R, and OGD/R+Mel cells. Scale bars: 25 µm
FIGURE 5
FIGURE 5
Effect of melatonin on OGD/R‐induced TNTs formation and mitochondrial transfer in HT22 cells. A, confocal images of co‐staining with phalloidin (green) and MitoTracker Deep Red (MTDR, red) of untreated cells (Ctrl), 8 h OGD‐exposed cells followed by 18 h reoxygenation (OGD/R) and 8 h OGD‐exposed cells followed by 18 h 50 µmol/L melatonin reoxygenation (OGD/R+Mel). Arrows indicate tunneling nanotubes (TNTs). The overlay (right panel) shows the co‐localization (yellow) of phalloidin (green) and MTDR (red) indicating the presence of mitochondria within TNTs in OGD/R+Mel cells. B, Characterization of TNTs size in OGD/R+Mel co‐labeled with MTDR (red) and phalloidin (green) indicating the mitochondrial transfer (yellow, white arrows). C, z‐stack images (i‐vi) show mitochondria inside TNT structures (yellow, arrows). Z‐stack acquisitions (x, y, z) were performed through confocal microscopy (TCS SP5 X, Leica Microsystems). Scale bars: 20 µm
FIGURE 6
FIGURE 6
TNTs quantification and mitochondrial transfer in OGD/R+Mel HT22 cells. A, counting of TNTs in untreated cells (Ctrl), 8 h OGD‐exposed cells followed by 18 h reoxygenation (OGD/R) and 8 h OGD‐exposed cells followed by 18 h 50 µmol/L melatonin reoxygenation (OGD/R+Mel). Cell counting was performed as described in Material and Methods. Data are expressed as the mean ± SD (N = 3 independent experiments performed in triplicate); *P < .05, **P < .01 vs Ctrl. B, quantification of TNTs with mitochondria in Ctrl, OGD/R, and OGD/R+Mel cells. The percentage was calculated analyzing at least 20 images and n = 25 TNTs were assessed for each experimental group. The number of TNTs was set up to 100 and relative % of TNT with mitochondria is expressed as the mean ± SD (N = 3 independent experiments performed in triplicate); **P < .01 vs Ctrl; #P < .05 vs OGD+Mel. C, representative flow cytometric contour plots of mitochondrial transfer in Ctrl, OGD/R, and OGD/R+Mel cells. HT22 Mitotracker Deep Red‐stained cells (red population) co‐cultured with unstained cells (green population) in a ratio of 1:1. The percentage of mitochondrial transfer has been quantified as the number of unstained cells that took up the Mitotracker Deep Red‐red fluorescence (violet population). The experiment was repeated twice with similar results

References

    1. Pan J, Konstas AA, Bateman B, Ortolano GA, Pile‐Spellman J. Reperfusion injury following cerebral ischemia: pathophysiology, MR imaging, and potential therapies. Neuroradiology. 2007;49(2):93‐102. - PMC - PubMed
    1. Kalogeris T, Bao Y, Korthuis RJ. Mitochondrial reactive oxygen species: a double edged sword in ischemia/reperfusion vs preconditioning. Redox Biol. 2014;2:702‐714. - PMC - PubMed
    1. Kim MJ, Cho JH, Cho JH, et al. Impact of hyperthermia before and during ischemia‐reperfusion on neuronal damage and gliosis in the gerbil hippocampus induced by transient cerebral ischemia. J Neurol Sci. 2015;348(1–2):101‐110. - PubMed
    1. Ham PB 3rd, Raju R. Mitochondrial function in hypoxic ischemic injury and influence of aging. Prog Neurogibol. 2017;157:92‐116. - PMC - PubMed
    1. Ni HM, Williams JA, Ding WX. Mitochondrial dynamics and mitochondrial quality control. Redox Biol. 2015;4:6‐13. - PMC - PubMed