

A novel ferroptosis phenotype-related clinical-molecular prognostic signature for hepatocellular carcinoma
- PMID: 34085405
- PMCID: PMC8278110
- DOI: 10.1111/jcmm.16666
A novel ferroptosis phenotype-related clinical-molecular prognostic signature for hepatocellular carcinoma
Abstract
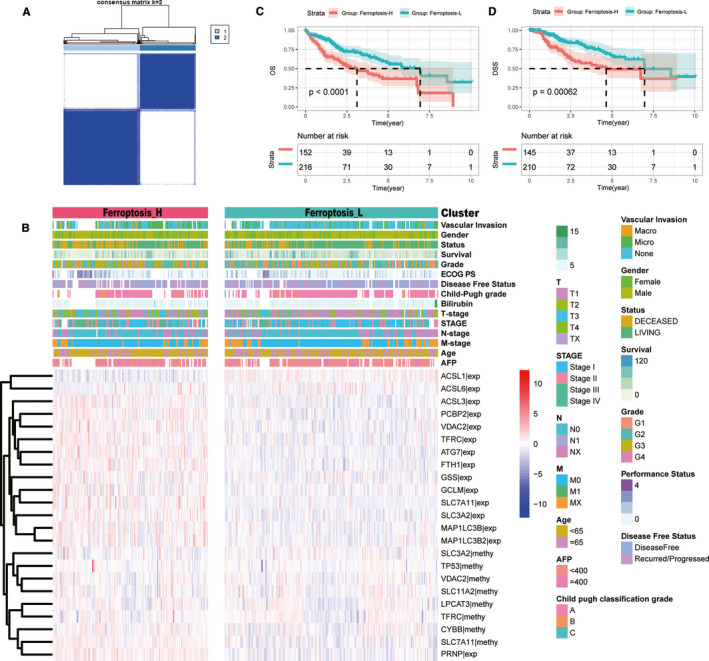
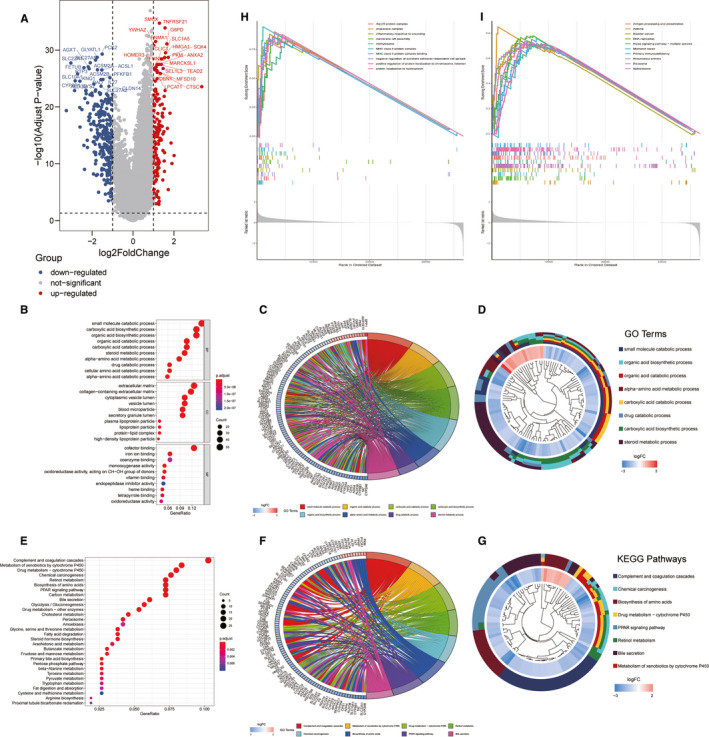
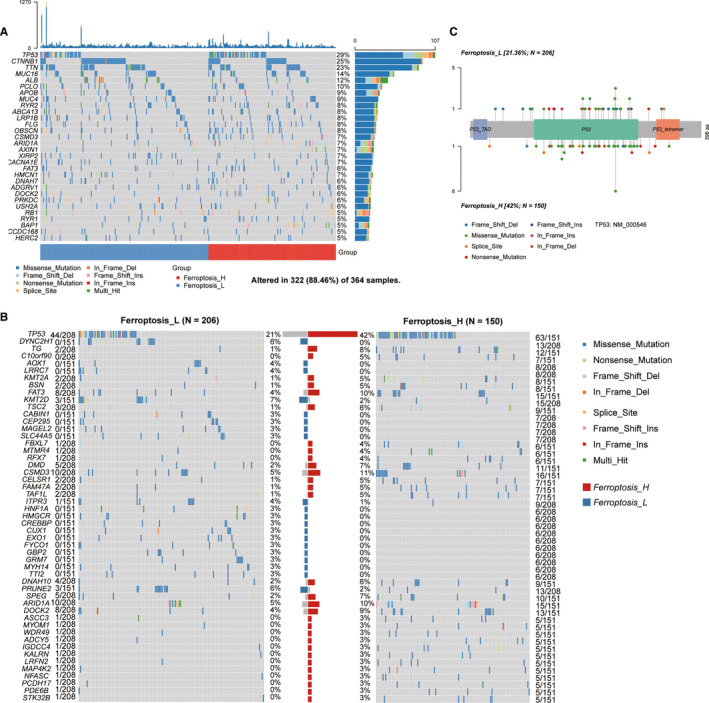
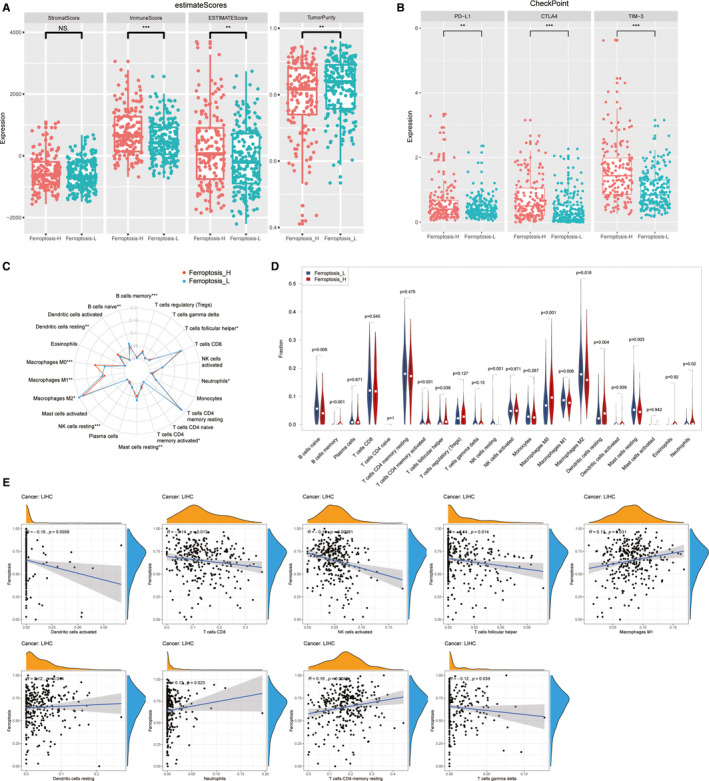
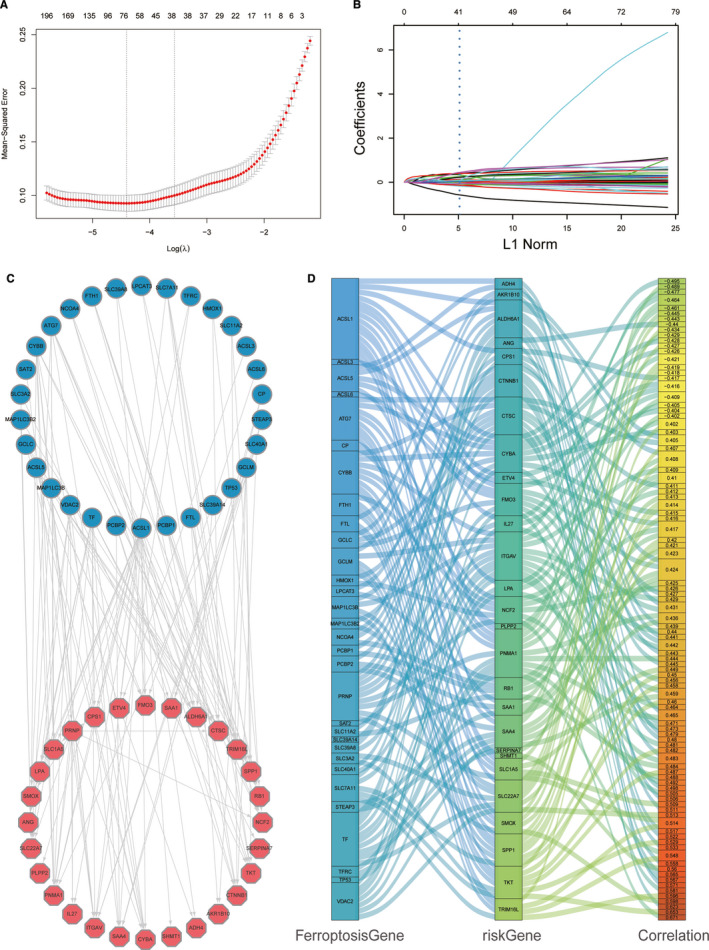
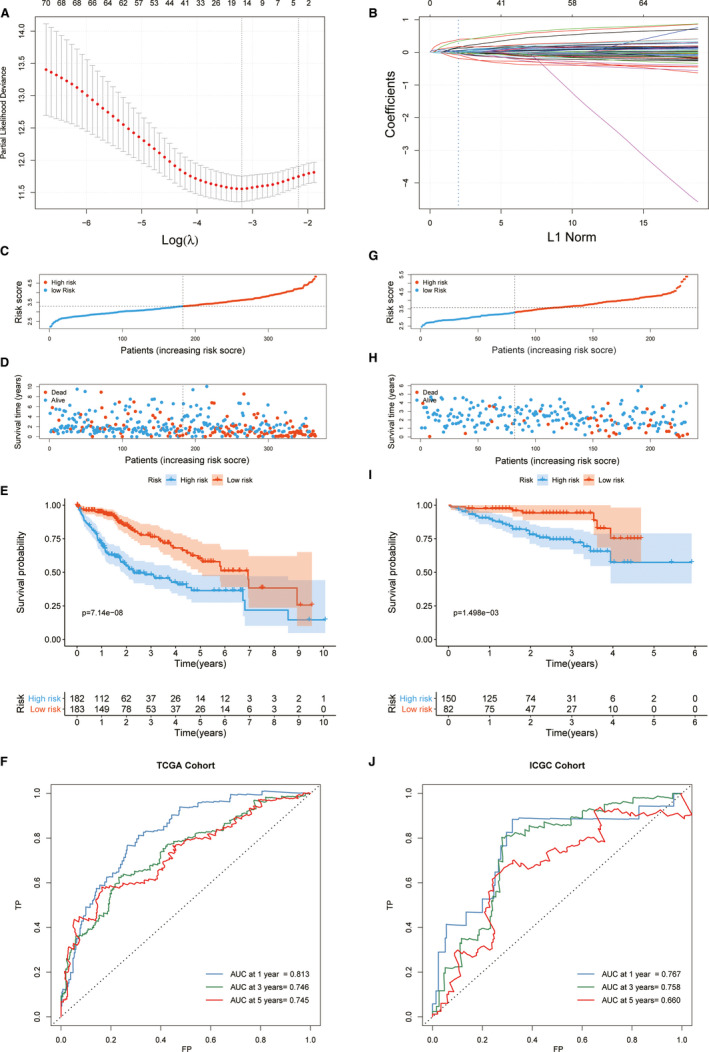
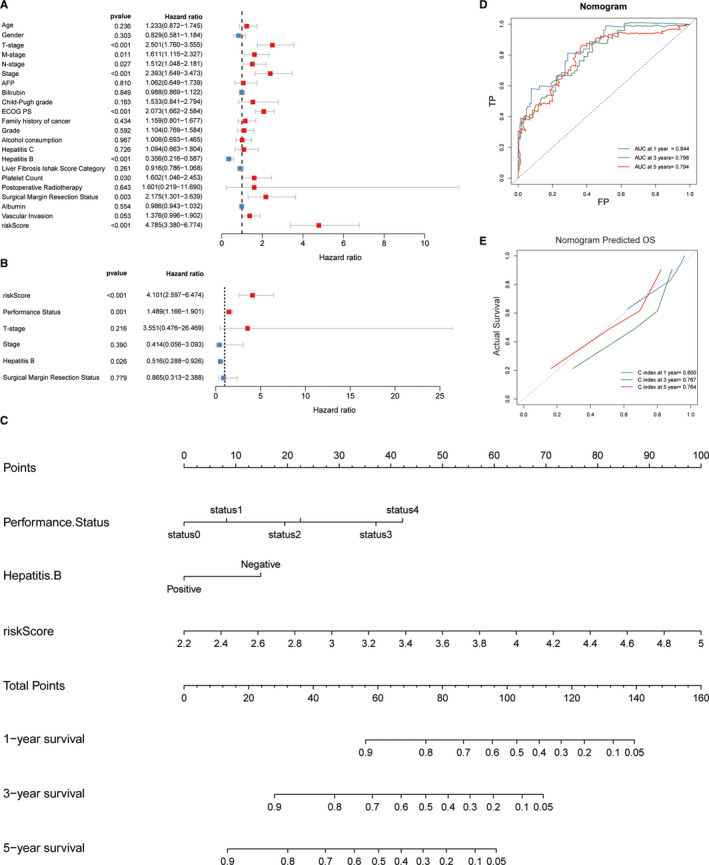
Ferroptosis is a newly identified cell death mechanism and potential biomarker for hepatocellular carcinoma (HCC) therapy; however, its clinical relevance and underlying mechanism remain unclear. In this study, transcriptome and methylome data from 374 HCC cases were investigated for 41 ferroptosis-related genes to identify ferroptosis activity-associated subtypes. These subtypes were further investigated for associations with clinical and pathological variables, gene mutation landscapes, deregulated pathways and tumour microenvironmental immunity. A gene expression signature and predictive model were developed and validated using an additional 232 HCC cases from another independent cohort. Two distinct ferroptosis phenotypes (Ferroptosis-H and Ferroptosis-L) were identified according to ferroptosis gene expression and methylation in the patients with HCC. Patients with the Ferroptosis-H had worse overall and disease-specific survival, and the molecular subtypes were significantly associated with different clinical characteristics, mRNA expression patterns, tumour mutation profiles and microenvironmental immune status. Furthermore, a 15-gene ferroptosis-related prognostic model (FPM) for HCC was developed and validated which demonstrated accurate risk stratification ability. A nomogram included the FPM risk score, ECOG PS and hepatitis B status was developed for eventual clinical translation. Our results suggest that HCC subtypes defined by ferroptosis gene expression and methylation may be used to stratify patients for clinical decision-making.
Keywords: co-expression network; ferroptosis; hepatocellular carcinoma; prognostic signature; risk-stratification.
© 2021 The Authors. Journal of Cellular and Molecular Medicine published by Foundation for Cellular and Molecular Medicine and John Wiley & Sons Ltd.
Conflict of interest statement
The authors declare that there is no conflict of interest.
Figures
Similar articles
-
The ferroptosis and iron-metabolism signature robustly predicts clinical diagnosis, prognosis and immune microenvironment for hepatocellular carcinoma.Cell Commun Signal. 2020 Oct 28;18(1):174. doi: 10.1186/s12964-020-00663-1. Cell Commun Signal. 2020. PMID: 33115468 Free PMC article.
-
Six-long non-coding RNA signature predicts recurrence-free survival in hepatocellular carcinoma.World J Gastroenterol. 2019 Jan 14;25(2):220-232. doi: 10.3748/wjg.v25.i2.220. World J Gastroenterol. 2019. PMID: 30670911 Free PMC article.
-
A Novel Ferroptosis-Related Long Non-Coding RNA Prognostic Signature Correlates With Genomic Heterogeneity, Immunosuppressive Phenotype, and Drug Sensitivity in Hepatocellular Carcinoma.Front Immunol. 2022 Jul 8;13:929089. doi: 10.3389/fimmu.2022.929089. eCollection 2022. Front Immunol. 2022. PMID: 35874689 Free PMC article.
-
Targeting ferroptosis: the role of non-coding RNAs in hepatocellular carcinoma progression and therapy.Naunyn Schmiedebergs Arch Pharmacol. 2025 Jun;398(6):6335-6348. doi: 10.1007/s00210-025-03791-y. Epub 2025 Jan 16. Naunyn Schmiedebergs Arch Pharmacol. 2025. PMID: 39820644 Review.
-
The changing landscape of hepatocellular carcinoma: etiology, genetics, and therapy.Am J Pathol. 2014 Mar;184(3):574-83. doi: 10.1016/j.ajpath.2013.10.028. Epub 2013 Dec 31. Am J Pathol. 2014. PMID: 24388934 Free PMC article. Review.
Cited by
-
Machine learning-based transcriptome analysis of lipid metabolism biomarkers for the survival prediction in hepatocellular carcinoma.Front Genet. 2022 Sep 28;13:1005271. doi: 10.3389/fgene.2022.1005271. eCollection 2022. Front Genet. 2022. PMID: 36246607 Free PMC article.
-
Oocyte transcriptomes and follicular fluid proteomics of ovine atretic follicles reveal the underlying mechanisms of oocyte degeneration.BMC Genomics. 2025 Feb 1;26(1):97. doi: 10.1186/s12864-025-11291-9. BMC Genomics. 2025. PMID: 39893388 Free PMC article.
-
Identification of a Ferroptosis-Related Signature Model Including mRNAs and lncRNAs for Predicting Prognosis and Immune Activity in Hepatocellular Carcinoma.Front Oncol. 2021 Sep 9;11:738477. doi: 10.3389/fonc.2021.738477. eCollection 2021. Front Oncol. 2021. PMID: 34568075 Free PMC article.
-
Identification and verification of novel immune-related ferroptosis signature with excellent prognostic predictive and clinical guidance value in hepatocellular carcinoma.Front Genet. 2023 Aug 21;14:1112744. doi: 10.3389/fgene.2023.1112744. eCollection 2023. Front Genet. 2023. PMID: 37671041 Free PMC article.
-
Identification and validation of a tyrosine metabolism-related prognostic prediction model and characterization of the tumor microenvironment infiltration in hepatocellular carcinoma.Front Immunol. 2022 Oct 20;13:994259. doi: 10.3389/fimmu.2022.994259. eCollection 2022. Front Immunol. 2022. PMID: 36341373 Free PMC article.
References
-
- Bray F, Ferlay J, Soerjomataram I, Siegel RL, Torre LA, Jemal A. Global cancer statistics 2018: GLOBOCAN estimates of incidence and mortality worldwide for 36 cancers in 185 countries. CA Cancer J Clin. 2018;68(6):394‐424. - PubMed
-
- Llovet JM, Ricci S, Mazzaferro V, et al. Sorafenib in advanced hepatocellular carcinoma. N Engl J Med. 2008;359(4):378‐390. - PubMed
-
- Heimbach JK, Kulik LM, Finn RS, et al. AASLD guidelines for the treatment of hepatocellular carcinoma. Hepatology. 2018;67(1):358‐380. - PubMed
Publication types
MeSH terms
Substances
LinkOut - more resources
Full Text Sources
Medical
