. 2021 Nov;17(11):3794-3812.
doi: 10.1080/15548627.2021.1938913. Epub 2021 Aug 7.

Mitochondrial autophagy and cell survival is regulated by the circadian Clock gene in cardiac myocytes during ischemic stress

Affiliations

Mitochondrial autophagy and cell survival is regulated by the circadian Clock gene in cardiac myocytes during ischemic stress

Inna Rabinovich-Nikitin et al. Autophagy. 2021 Nov.

Abstract

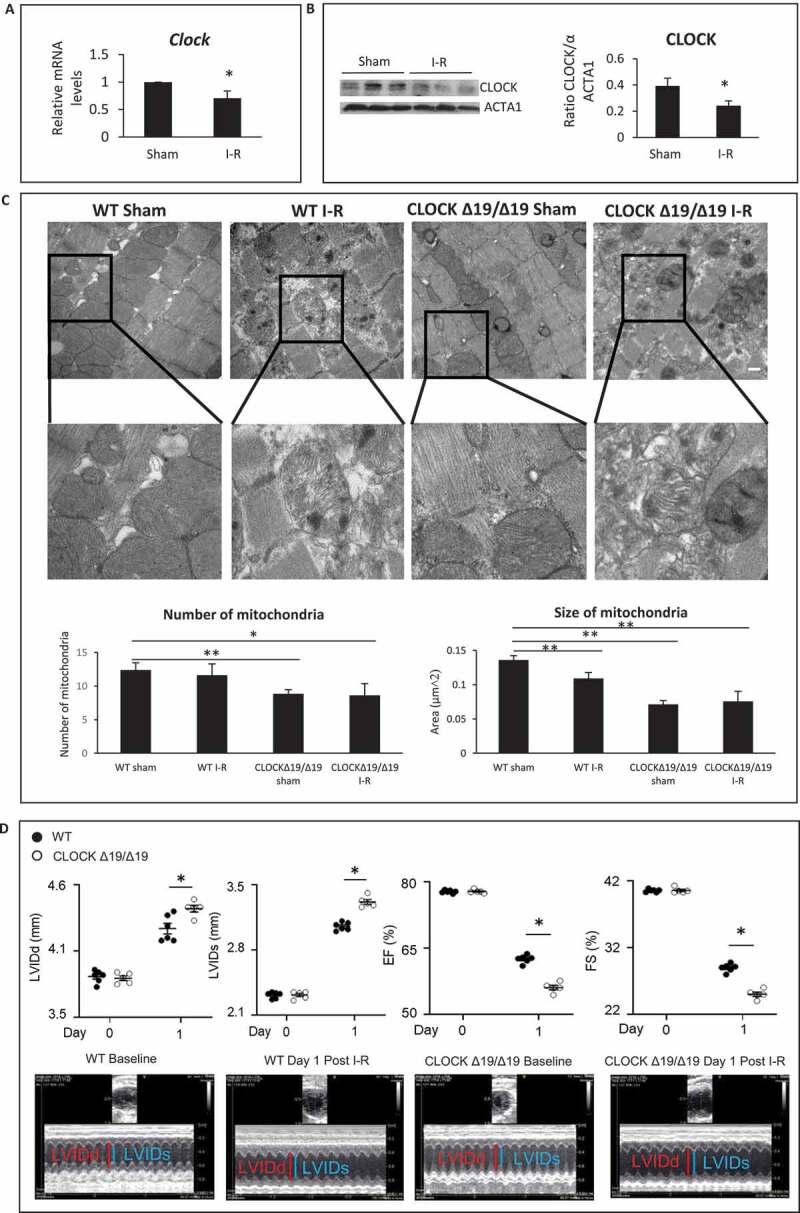
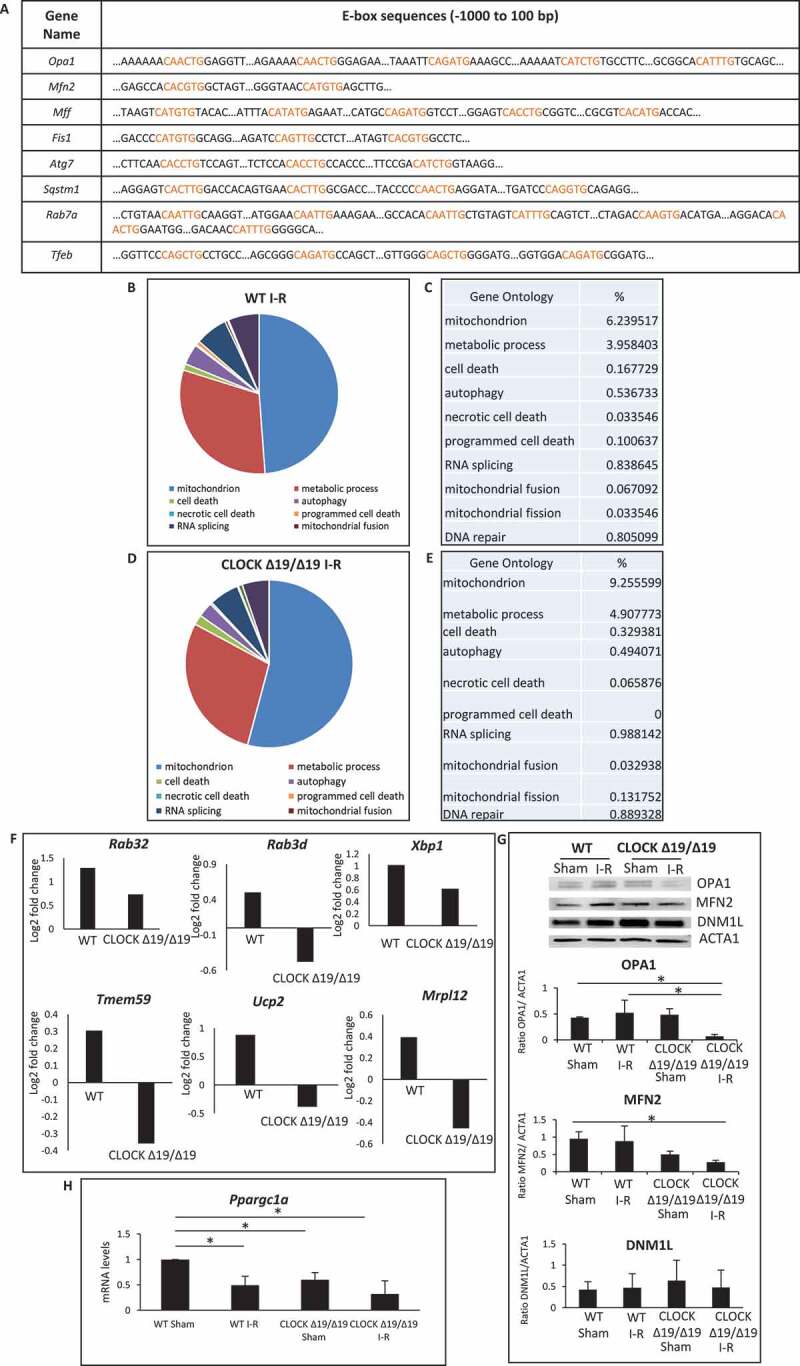
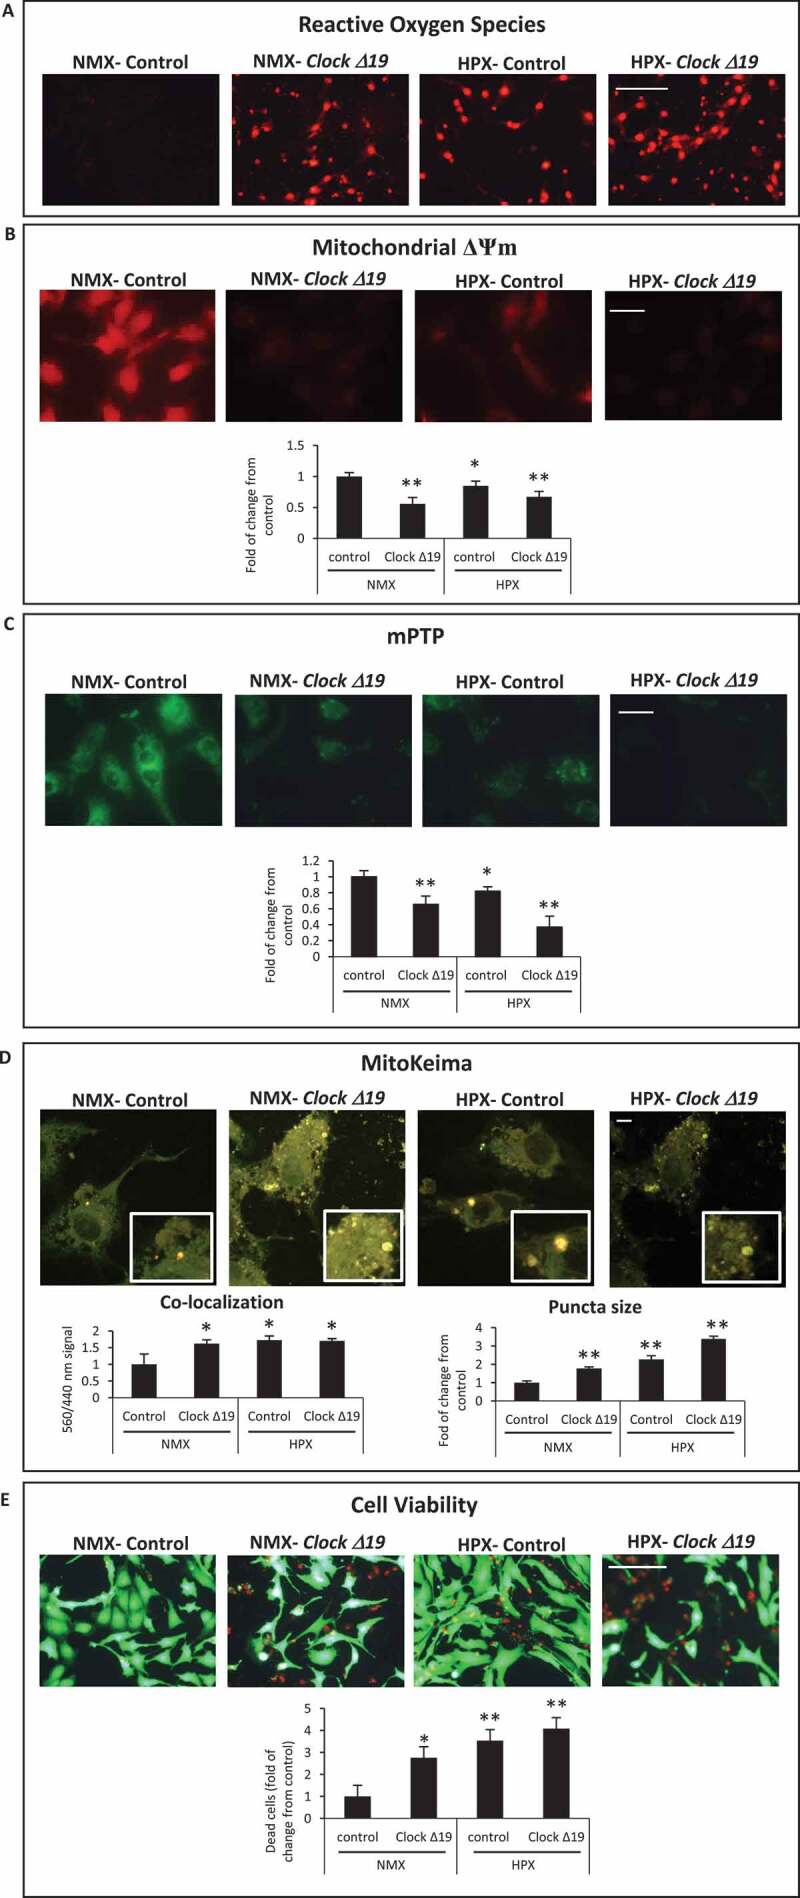
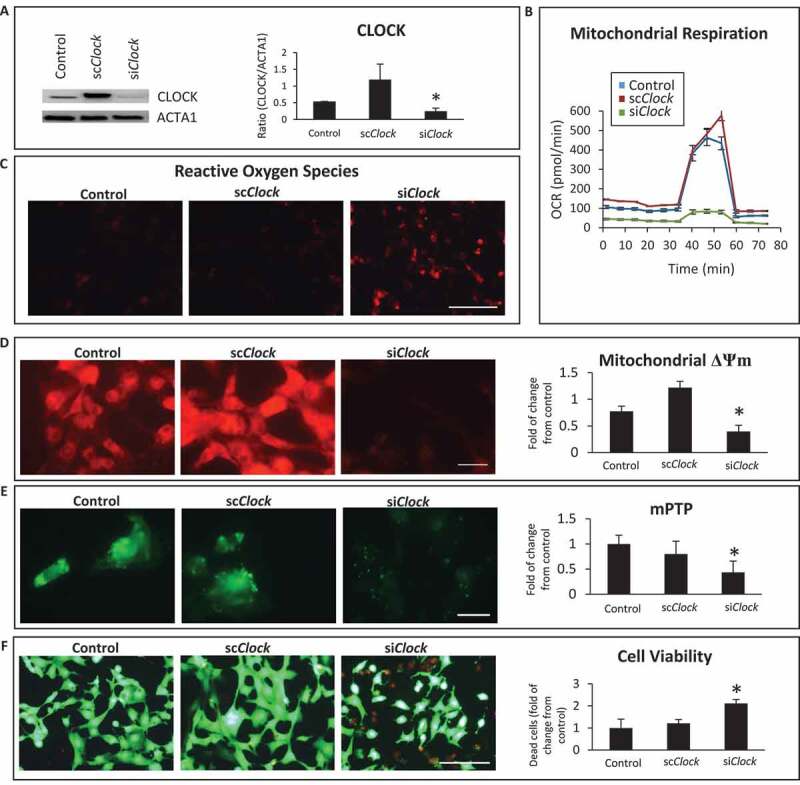
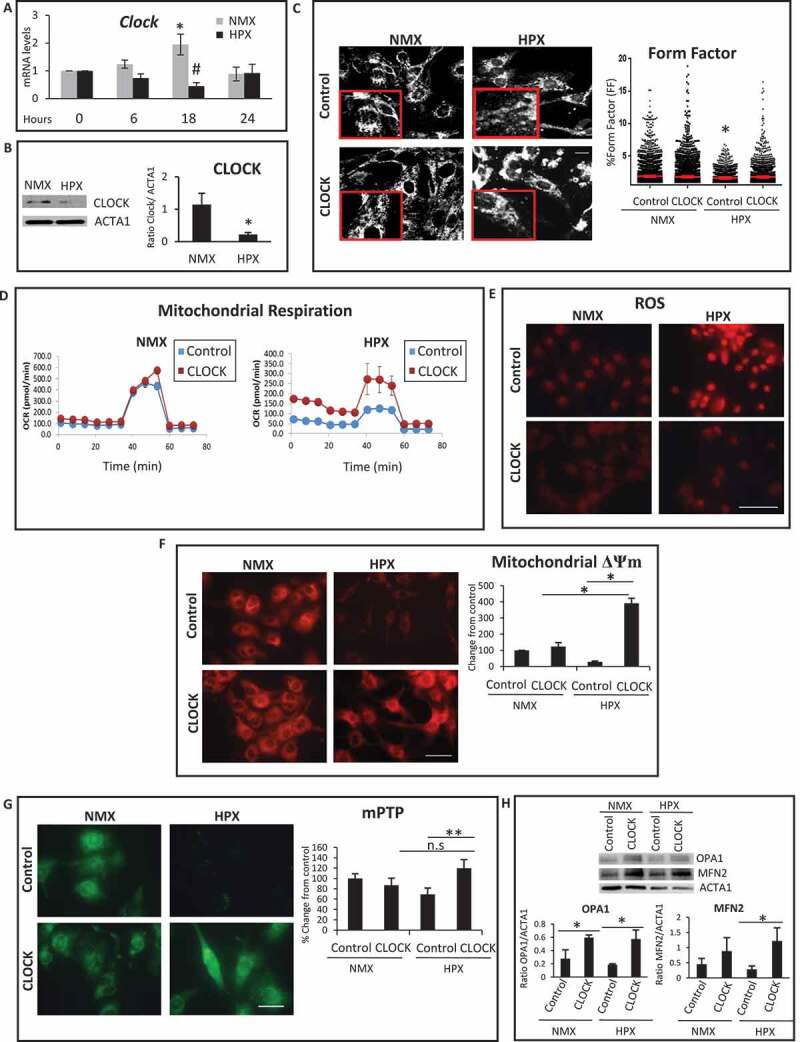
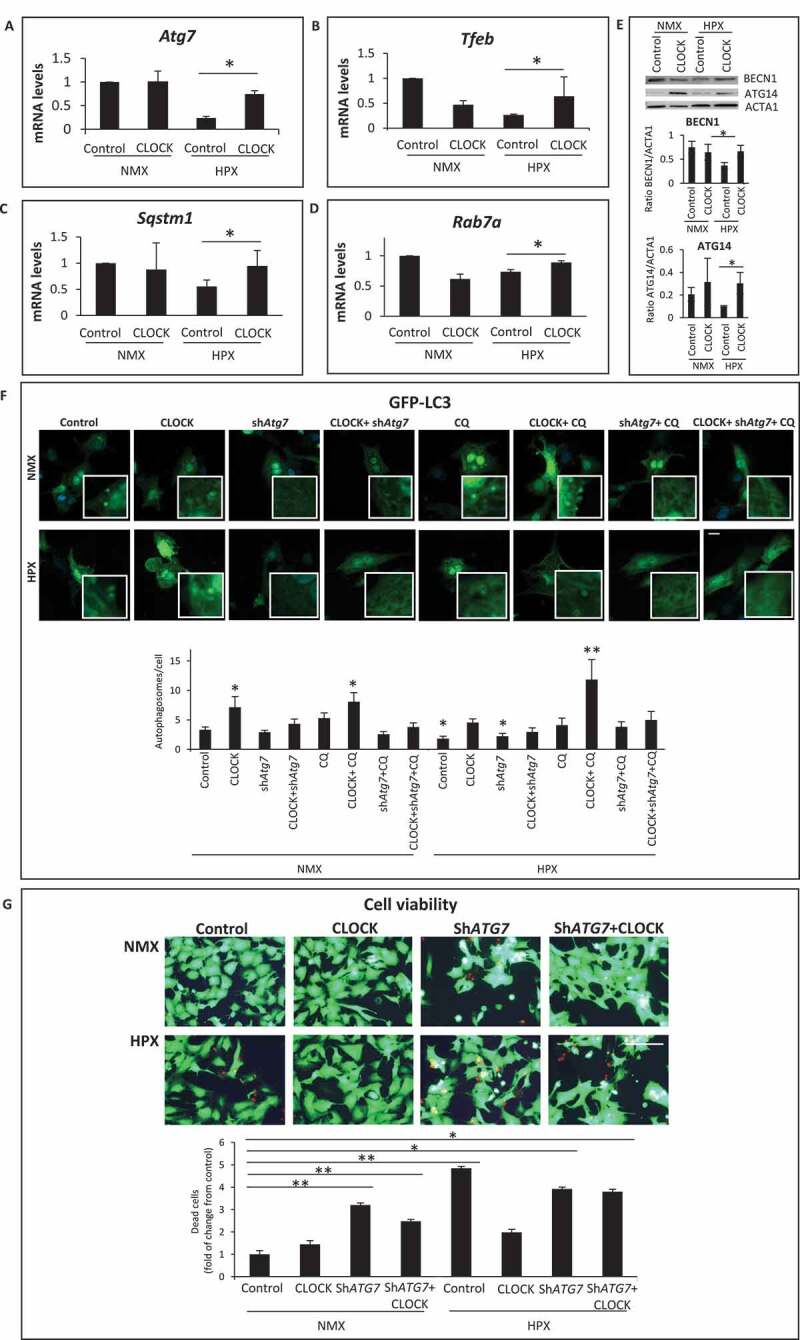
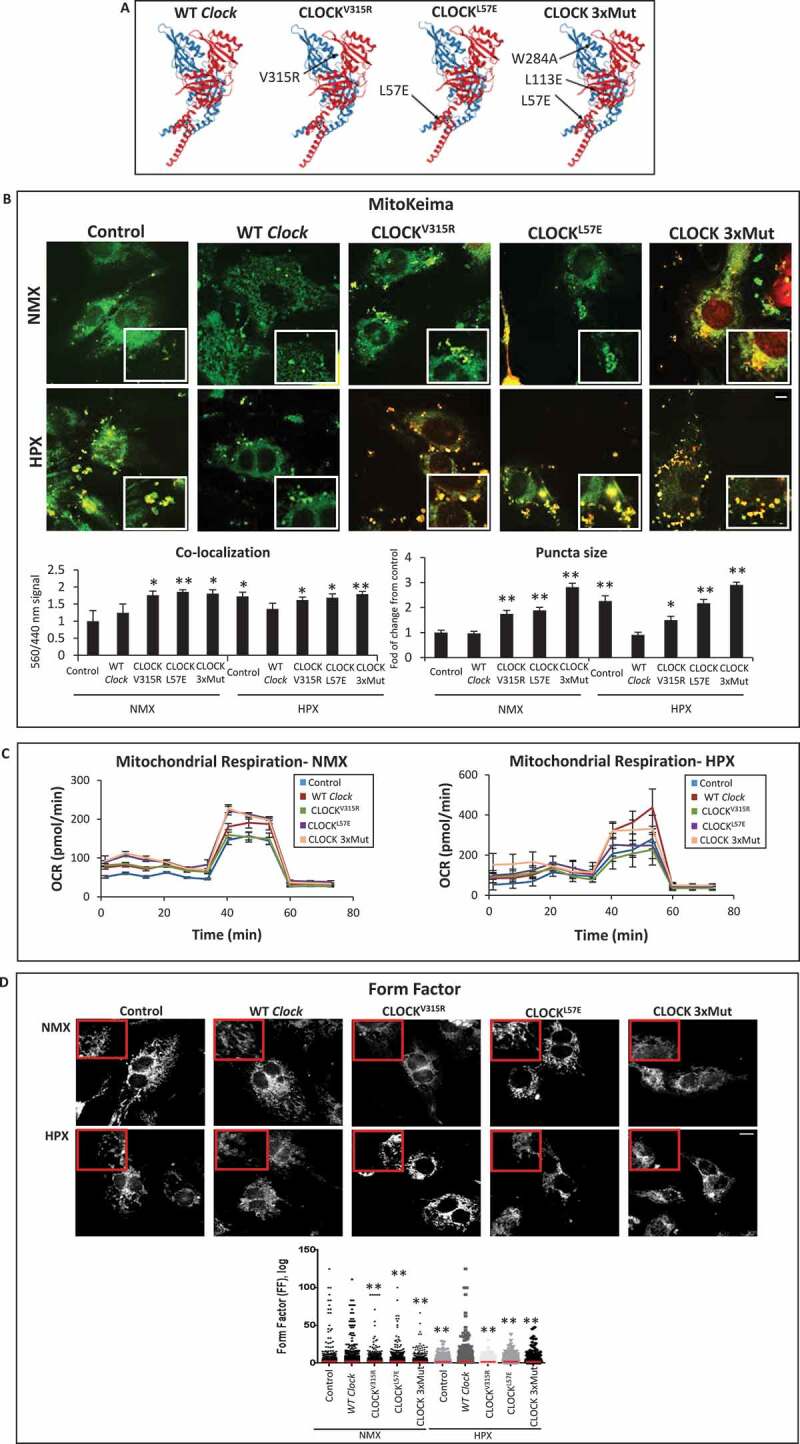
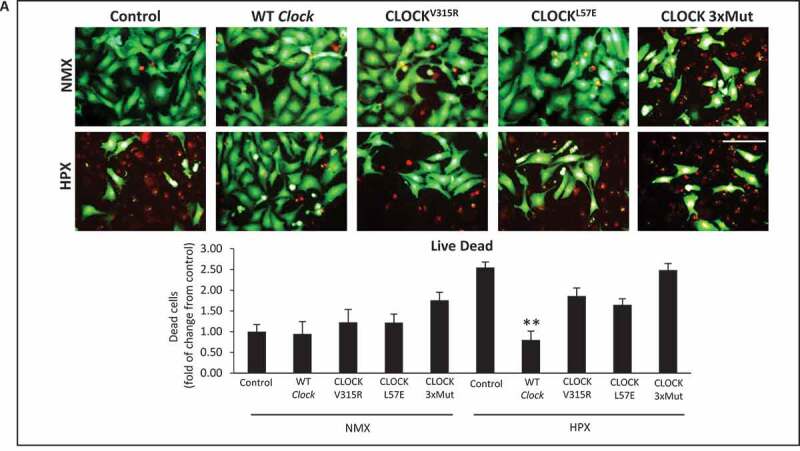
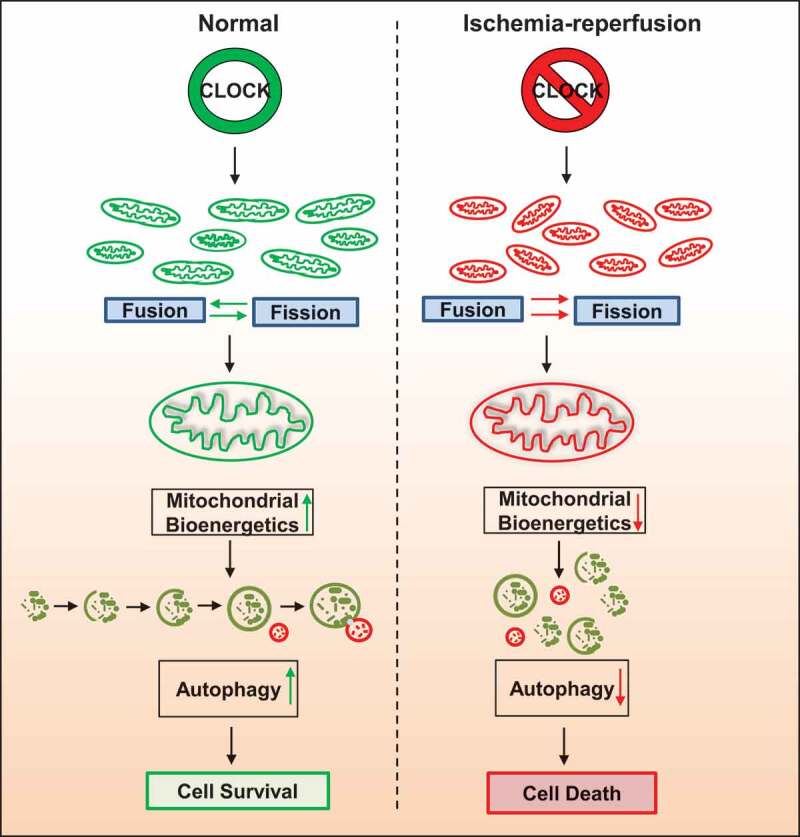
Cardiac function is highly reliant on mitochondrial oxidative metabolism and quality control. The circadian Clock gene is critically linked to vital physiological processes including mitochondrial fission, fusion and bioenergetics; however, little is known of how the Clock gene regulates these vital processes in the heart. Herein, we identified a putative circadian CLOCK-mitochondrial interactome that gates an adaptive survival response during myocardial ischemia. We show by transcriptome and gene ontology mapping in CLOCK Δ19/Δ19 mouse that Clock transcriptionally coordinates the efficient removal of damaged mitochondria during myocardial ischemia by directly controlling transcription of genes required for mitochondrial fission, fusion and macroautophagy/autophagy. Loss of Clock gene activity impaired mitochondrial turnover resulting in the accumulation of damaged reactive oxygen species (ROS)-producing mitochondria from impaired mitophagy. This coincided with ultrastructural defects to mitochondria and impaired cardiac function. Interestingly, wild type CLOCK but not mutations of CLOCK defective for E-Box binding or interaction with its cognate partner ARNTL/BMAL-1 suppressed mitochondrial damage and cell death during acute hypoxia. Interestingly, the autophagy defect and accumulation of damaged mitochondria in CLOCK-deficient cardiac myocytes were abrogated by restoring autophagy/mitophagy. Inhibition of autophagy by ATG7 knockdown abrogated the cytoprotective effects of CLOCK. Collectively, our results demonstrate that CLOCK regulates an adaptive stress response critical for cell survival by transcriptionally coordinating mitochondrial quality control mechanisms in cardiac myocytes. Interdictions that restore CLOCK activity may prove beneficial in reducing cardiac injury in individuals with disrupted circadian CLOCK.Abbreviations: ARNTL/BMAL1: aryl hydrocarbon receptor nuclear translocator-like; ATG14: autophagy related 14; ATG7: autophagy related 7; ATP: adenosine triphosphate; BCA: bovine serum albumin; BECN1: beclin 1, autophagy related; bHLH: basic helix- loop-helix; CLOCK: circadian locomotor output cycles kaput; CMV: cytomegalovirus; COQ5: coenzyme Q5 methyltransferase; CQ: chloroquine; CRY1: cryptochrome 1 (photolyase-like); DNM1L/DRP1: dynamin 1-like; EF: ejection fraction; EM: electron microscopy; FS: fractional shortening; GFP: green fluorescent protein; HPX: hypoxia; i.p.: intraperitoneal; I-R: ischemia-reperfusion; LAD: left anterior descending; LVIDd: left ventricular internal diameter diastolic; LVIDs: left ventricular internal diameter systolic; MAP1LC3/LC3: microtubule-associated protein 1 light chain 3; MFN2: mitofusin 2; MI: myocardial infarction; mPTP: mitochondrial permeability transition pore; NDUFA4: Ndufa4, mitochondrial complex associated; NDUFA8: NADH: ubiquinone oxidoreductase subunit A8; NMX: normoxia; OCR: oxygen consumption rate; OPA1: OPA1, mitochondrial dynamin like GTPase; OXPHOS: oxidative phosphorylation; PBS: phosphate-buffered saline; PER1: period circadian clock 1; PPARGC1A/PGC-1α: peroxisome proliferative activated receptor, gamma, coactivator 1 alpha; qPCR: quantitative real-time PCR; RAB7A: RAB7, member RAS oncogene family; ROS: reactive oxygen species; RT: room temperature; shRNA: short hairpin RNA; siRNA: small interfering RNA; TFAM: transcription factor A, mitochondrial; TFEB: transcription factor EB; TMRM: tetra-methylrhodamine methyl ester perchlorate; WT: wild -type; ZT: zeitgeber time.

Keywords: Autophagy; clock; metabolism; mitochondrion; myocardial infarction.


Conflict of interest statement

The authors declare no competing interests.

Figures

Figure 1.
Figure 1.
Circadian Clock gene disruption impairs cardiac structure and function. (A) Clock mRNA expression in murine hearts from sham-operated controls and following ischemia-reperfusion (I-R). (B) Left panel; western blot analysis of CLOCK protein expression in murine cardiac muscle in sham-operated controls and following I-R; ACTA1 was used as a loading control; Right panel Quantification of western blot analysis from Left panel. (C) Upper, representative electron micrographs (EM) of murine cardiac muscle from wild-type (WT) and CLOCK Δ19/Δ19 hearts from sham-operated controls and I-R, (see methods for details), Center panel, magnified regions of the images, magnification = 500 nm, 19,000X, Lower panel, Quantitative analysis for EM images were derived from n = 4 randomly selected grids examined at 5800X counting > 80 mitochondria per section, from n = 3 sections per mouse heart using n = 3 blocks. (D) Echocardiography data for cardiac function in WT and CLOCK Δ19/Δ19 mice pre- and post 24 h following I-R. The top histograms represent left ventricular diastolic (LVIDd) dimensions, left ventricular systolic (LVIDs) dimensions, % ejection fraction (% EF) and % fractional shortening (% FS); bottom, representative M mode images, data are expressed as mean ± SEM, *p < 0.05, ** p < 0.01, n = 3–5 mice for each condition tested
Figure 2.
Figure 2.
Circadian Clock gene transcriptionally targets mitochondrial bioenergetics, dynamics and quality control. (A), E-box elements in Clock target genes. Canonical and non-canonical E-box sequences are highlighted in red; (B-E), Pie chart (B and D) represent the most common gene ontology clusters that were altered in response to I-R, tables represent the percentile change of each gene ontology from the total genes in the array (C and E); WT (B and C); CLOCK Δ19/Δ19 (D and E); (F), Histograms represent transcriptomic changes in CLOCK Δ19/Δ19 hearts, including alterations in autophagy, mitochondrial dynamics and mitochondrial energy, Rab32 p = 0.04033; Rab3d p = 0.014746; Xbp1, p = 8.25E-05; Tmem59 p = 0.014048; Ucp2 p = 0.010898; Mrpl12,p = 0.001328; (G), western blot analysis of OPA1, MFN2 and DNM1L protein expression in WT and CLOCK Δ19/Δ19 hearts following I-R, compared to ACTA1 loading control, bottom, quantification of western blot analysis; (H), PPARGC1A mRNA expression in WT and CLOCK Δ19/Δ19 hearts following I-R, labels are as described above; data are expressed as mean ± SEM, *p < 0.05, n = 3–5 mice hearts for each condition tested
Figure 3.
Figure 3.
Circadian Clock Δ19 mutation impairs mitochondrial function, mitophagy and cell viability in cardiac myocytes. Epifluorescence microscopy of cardiac myocytes under normoxic (NMX) or hypoxic (HPX) conditions in the absence and presence of Clock ∆19 expression vector; (A), mitochondrial reactive oxygen species (ROS) by dihydroethidine (red fluorescence), bar: 100 μm; (B), mitochondrial membrane potential (ΔΨm) by TMRM (red fluorescence), bar: 20 μm; (C), mitochondrial permeability transition pore opening (mPTP), (green fluorescence) bar: 20 μm; see Materials and Methods for details; (D), Upper, representative images for MitoKeima staining, as an index of mitophagy in cardiac myocytes under NMX and HPX conditions in the absence and presence of Clock ∆19 expression vector, bars: 10 μm. Magnified regions are depicted by the white boxes, green fluorescent puncta demark mitochondria that are unfused with lysosomes (neutral pH), red/yellow fluorescent puncta demark mitochondria that have fused with lysosomes (acidic pH) indicative of mitophagy. Bottom histogram, quantitative analysis for conditions shown above; (E), Cell viability as assessed with vital dyes calcein-AM and ethidium-homodimer-1 to identify the number of live (green) and dead (red) cells, respectively, bar: 100 μm, see methods for details; data are expressed as mean ± SEM. *p < 0.05; **p < 0.01, n = 3–4 independent myocyte isolations, counting >200 cells for each condition tested
Figure 4.
Figure 4.
Clock knockdown disrupts mitochondrial function and cell viability. (A); Top left, western blot analysis of CLOCK protein expression in post-natal cardiac myocytes. Cardiac myocytes were transfected with vector alone (control) or with the Clock expression vector along with short-hairpin RNA directed against Clock designated (siClock) or with Clock expression vector along with scrambled siRNA designated (scClock); Lower left, ACTA1 for loading control; Right, histogram represents quantitative data for the western blot analysis; (B), Oxygen consumption rate (OCR) in adenovirus-infected control cells AdCMV or cardiac myocytes infected with AdClock in the presence of siClock or scClock; (C), epifluorescence microscopy of reactive oxygen species (ROS) by dihydroethidine, bar: 100 μm; (D), epifluorescence microscopy of mitochondrial membrane potential ΔΨm by TMRM staining, bar: 20 μm; (E), Mitochondrial permeability transition pore opening (mPTP), bar: 20 μm; (F), cell viability, with vital dyes calcein-AM and ethidium-homodimer-1 to identify the number of live (green) and dead (red) cells, respectively, bar: 100 μm, see methods for details. Histogram represents quantitative data for ΔΨm, mPTP and cell viability, data are expressed as mean ± SEM from at least n = 3–4 independent myocyte isolations experiments counting >200 cells for each condition tested, *p < 0.05
Figure 5.
Figure 5.
CLOCK restores mitochondrial dynamics, mitochondrial function and mitochondrial bioenergetics during hypoxia. (A). Clock mRNA expression in cardiac myocytes is downregulated during hypoxia (HPX) (18 h) compared to normoxic controls (NMX), (B), Upper left, western blot analysis of CLOCK protein expression in cardiac myocytes during hypoxia (HPX) of 18 h compared to normoxia (NMX); Lower left, ACTA1 as a loading control; Right, histogram is quantitative data for the western blot analysis. (C), Left, Representative epifluorescence images of cardiac myocytes stained for mitochondrial HSPD1 to assess mitochondrial morphology aspect ratio, bar: 10 μm, magnified regions are depicted in red boxes, Right, quantitative data of mitochondrial morphology is displayed as mitochondrial form factor, (FF), as an index of mitochondrial fusion and fission, lower FF values are indicative of mitochondrial fission relative to control; (D), mitochondrial oxygen consumption rate (OCR) in cardiac myocytes under NMX and HPX conditions, viral control AdCMV (blue box) or AdClock (red box); (E), Epifluorescence microscopy of cardiac myocytes under normoxic (NMX) or hypoxic (HPX) conditions, assessed for mitochondrial reactive oxygen species (ROS) by dihydroethidine (red), bar: 100 μm; (F), mitochondrial membrane ΔΨm by TMRM (red), bar: 20 μm; Histogram represents quantitative data for panel F; (G), mitochondrial permeability transition pore opening (mPTP), (green fluorescence) bar: 20 μm; Histogram represents quantitative data for panel G; (H) Upper, western blot analysis for OPA1 and MFN2 protein expression in cardiac myocytes during normoxia (NMX) and hypoxia (HPX) at 18 h; Lower, Histogram represents quantitative analysis for Panel H; see Materials and Methods for details; data are expressed as mean ± SEM. *,#p < 0.05; **p < 0.01, n.s.- non significant, n = 3–4 independent myocyte isolations, counting >200 cells for each condition tested for Panels C, F-H
Figure 6.
Figure 6.
CLOCK restores autophagy gene expression and cell viability during hypoxia. (A-D), mRNA expression levels of autophagic genes in normoxic (NMX) and hypoxic (HPX) cardiac myocytes in the absence and presence of control adenovirus CMV (AdCMV) or AdClock, mRNA levels were normalized to Rpl32; (E), Top, western blot analysis of BECN1 and ATG14 protein expression in NMX and HPX cardiac myocytes in the absence and presence of AdCMV or AdClock. Lower panel, histogram represents quantitative data for the western blot, relative to ACTA1 as a loading control, (F), Upper, epifluorescence microscopy of ventricular myocytes expressing autophagy reporter GFP-LC3 (green puncta) and Hoechst 33258 nuclear staining (blue) in the presence of AdCMV (vector control) or, AdClock, or shAtg7 with or without Chloroquine (CQ) to assess autophagic flux under NMX and HPX conditions, bar: 10 μm, Magnified regions are depicted by the white boxes. Green fluorescent puncta are indicative of increased autophagic flux, Lower, analysis of conditions tested in Upper panel. (G), Left, representative images of MitoKeima staining, as an index of mitophagy in cardiac myocytes under NMX and HPX conditions 18 h in the absence and presence of AdCMV or AdClock or shAtg7, bar: 10 μm. Magnified regions are depicted by the white boxes, green fluorescent puncta demark mitochondria that are not fused with lysosomes (neutral pH), red/yellow fluorescent puncta demark mitochondria that have fused with lysosomes (acidic pH) indicative of mitophagy. Right, analysis of conditions tested on left panel; data are expressed as mean ± SEM. *p < 0.05, **p < 0.01, n = 3–4 independent myocyte isolations
Figure 7.
Figure 7.
CLOCK rescues mitochondrial bioenergetics and mitophagy in cardiac myocytes. (A), Ribbon structures of wild type (WT) and CLOCK mutants, CLOCKV315R, CLOCKL57E, CLOCK L57E/L113E/W284, designated as CLOCK 3xMut; blue ribbon represents CLOCK, red ribbon represents ARNTL, as previously reported by [32], Protein Data Bank (PDB) code 4 F3L; (B), Top, representative epifluorescence microscopy of MitoKeima staining in cardiac myocytes as an index of mitophagy. Cardiac myocytes expressing MitoKeima reporter under normoxic (NMX) and hypoxic (HPX) conditions 18 h in the presence of Clock WT or CLOCK mutants, bar: 10 μm. Magnified regions are depicted by insets outlined by white boxes, green fluorescence MitoKeima puncta represent mitochondria that unfused with lysosomes (neutral pH), red/yellow fluorescent puncta demark mitochondria that are fused with lysosomes (acidic pH), see methods for details. In contrast to Clock WT, each of the CLOCK mutants tested resulted in the accumulation of larger red/yellow MitoKeima puncta indicating that mitophagy and mitochondrial clearance was impaired (see text for details), Bottom, analysis of conditions tested in Upper panel; (C), mitochondrial oxygen consumption rate (OCR) in cardiac myocytes under NMX or HPX conditions in the presence Clock WT or CLOCK mutants; (D), Top Representative epifluorescence images of cardiac myocytes stained for mitochondrial HSPD1 to assess mitochondrial morphology aspect ratio, bar: 10 μm, magnified regions are depicted in red boxes, Bottom quantitative data of mitochondrial morphology is displayed as mitochondrial form factor, (FF), as an index of mitochondrial fusion and fission, lower FF values are indicative of mitochondrial fission relative to control, (E), cell viability of ventricular myocytes stained with vital dyes calcein-AM and ethidium-homodimer-1 to demark the live (green) and dead (red) cells in the absence and presence of Clock WT or CLOCK mutants, bar: 100 μm, histogram represents quantitative data for Panel E, data are expressed as mean ± SEM. *p < 0.05; **p < 0.01, n = 3 independent myocyte isolations, counting > 200 for each condition tested
Figure 8.
Figure 8.
CLOCK rescues cell survival in cardiac myocytes. (A), cell viability of ventricular myocytes stained with vital dyes calcein-AM and ethidium-homodimer-1 to demark the live (green) and dead (red) cells in the absence and presence of CLOCK WT or CLOCK mutants, bar: 100 μm, histogram represents quantitative data for Panel A, data are expressed as mean ± SEM. *p < 0.05; **p < 0.01, n = 3 independent myocyte isolations, counting > 200 for each condition tested
Figure 9.
Figure 9.
CLOCK Regulates Autophagy and Mitochondrial Quality Control in Cardiac Myocytes. Schematic model for CLOCK regulation of autophagy and mitochondrial quality control. Left panel, Clock gene expression promotes mitochondrial dynamics, quality control, bioenergetics and cell survival. Right panel, disruption of expression of Clock gene during ischemia-reperfusion impairs mitochondrial dynamics, quality control and bioenergetics, resulting in cell death

Similar articles

Cited by

References

    1. Ashrafian H, Frenneaux MP, Opie LH.. Metabolic mechanisms in heart failure. Circulation. 2007;116:434–448. - PubMed
    1. Balaban RS, Nemoto S, Finkel T.. Mitochondria, oxidants, and aging. Cell. 2005;120:483–495. - PubMed
    1. Reznick RM, Zong H, Li J, et al. Aging-associated reductions in AMP-activated protein kinase activity and mitochondrial biogenesis. Cell Metab. 2007;5:151–156. - PMC - PubMed
    1. Zid BM, Rogers AN, Katewa SD, et al. 4E-BP extends lifespan upon dietary restriction by enhancing mitochondrial activity in drosophila. Cell. 2009;139:149–160. - PMC - PubMed
    1. Petrie JR, Guzik TJ, Touyz RM. Diabetes, hypertension, and cardiovascular disease: clinical insights and vascular mechanisms. Can J Cardiol. 2018;34:575–584. - PMC - PubMed

Publication types

Grants and funding