Comparative Study
. 2021 Jun 4:10:e69594.
doi: 10.7554/eLife.69594.

Punishment insensitivity in humans is due to failures in instrumental contingency learning

Affiliations
Comparative Study

Punishment insensitivity in humans is due to failures in instrumental contingency learning

Philip Jean-Richard-Dit-Bressel et al. Elife. .

Abstract

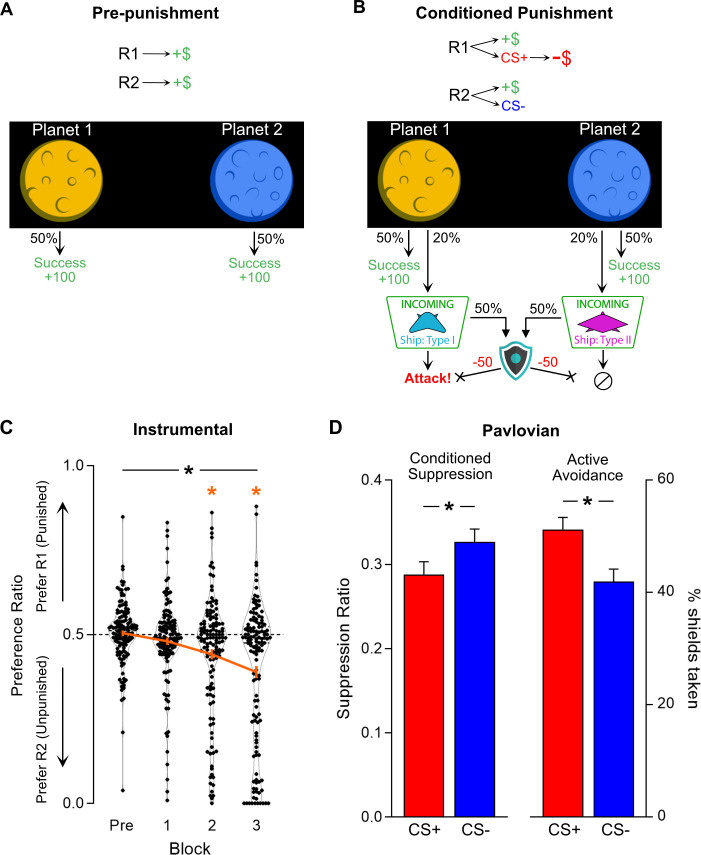
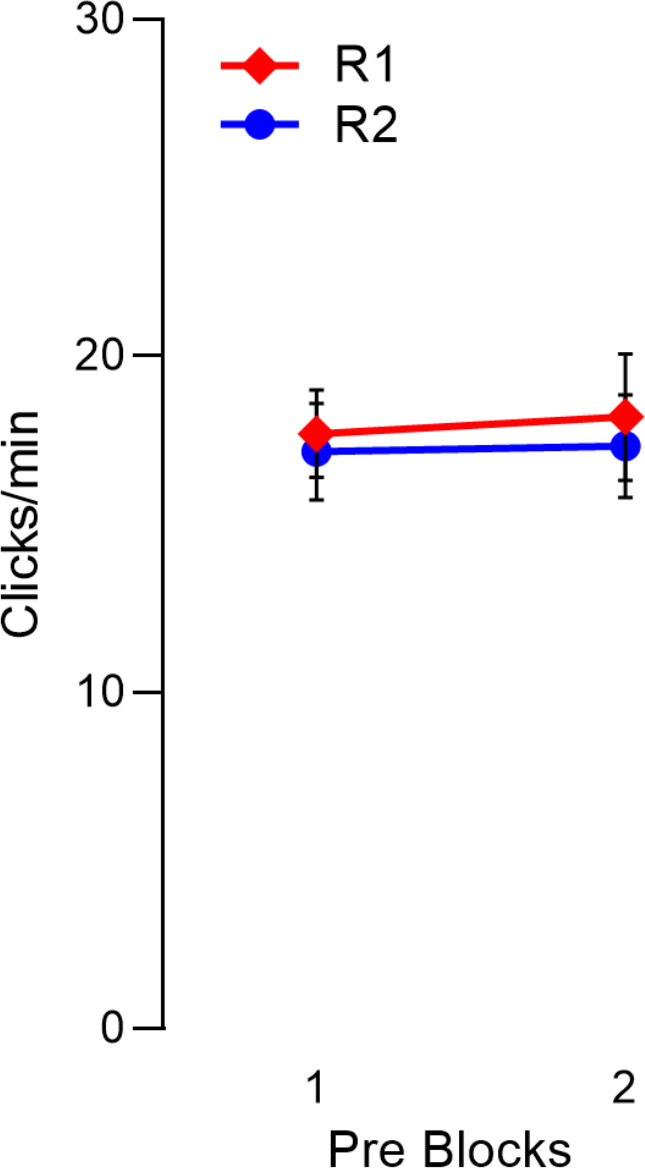
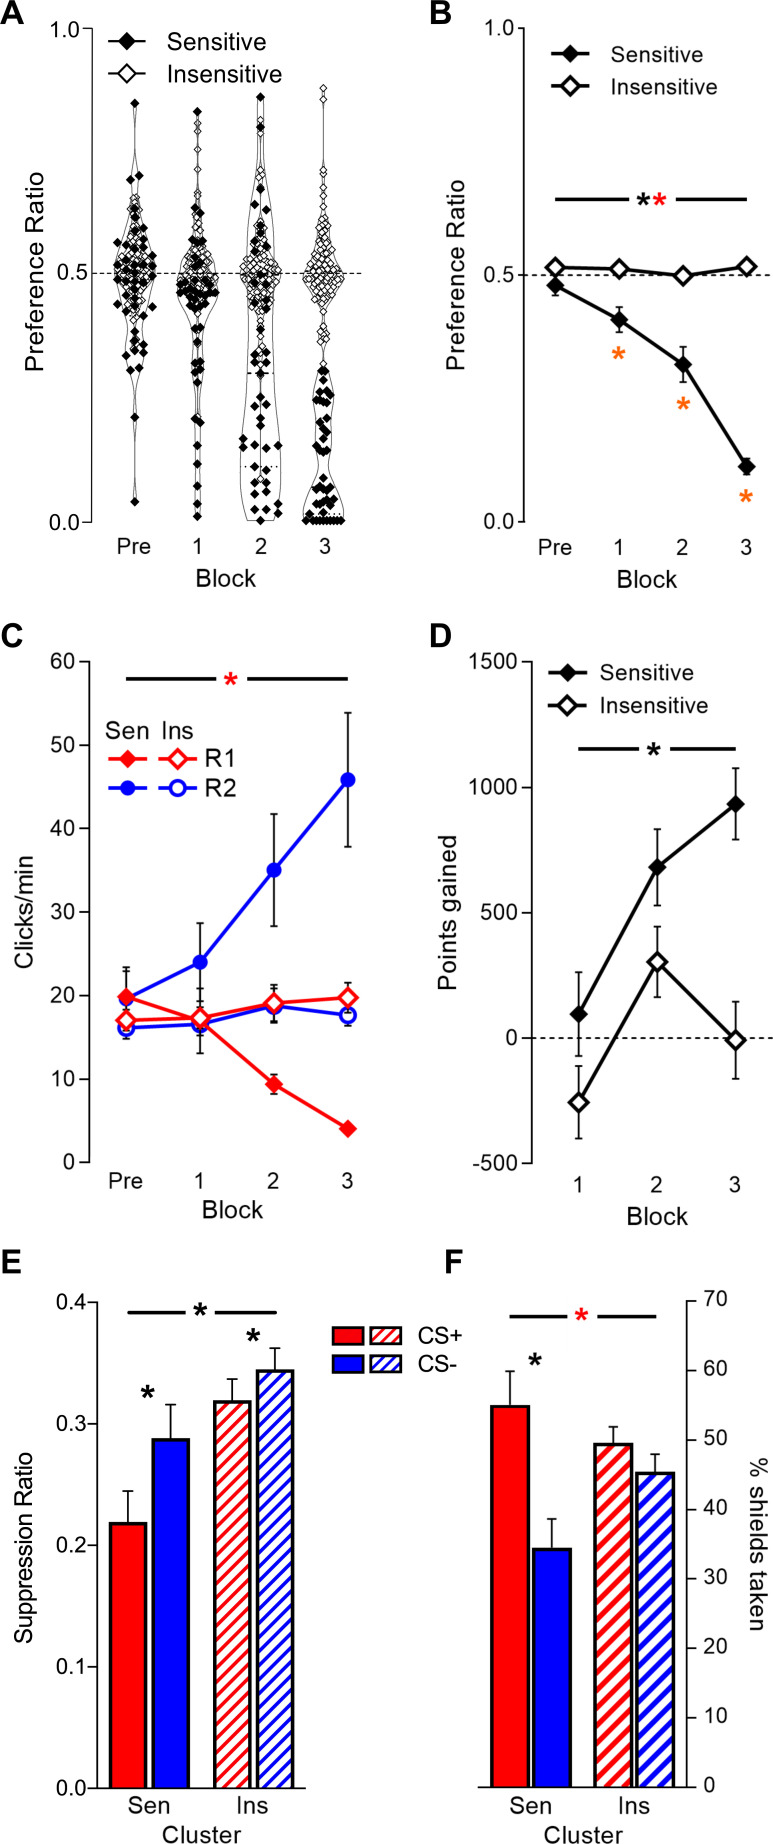
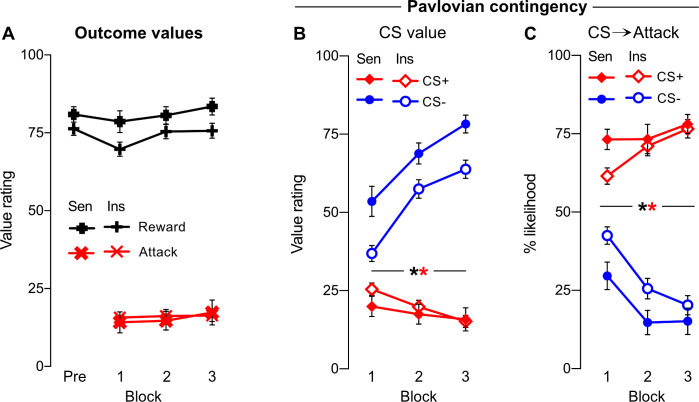
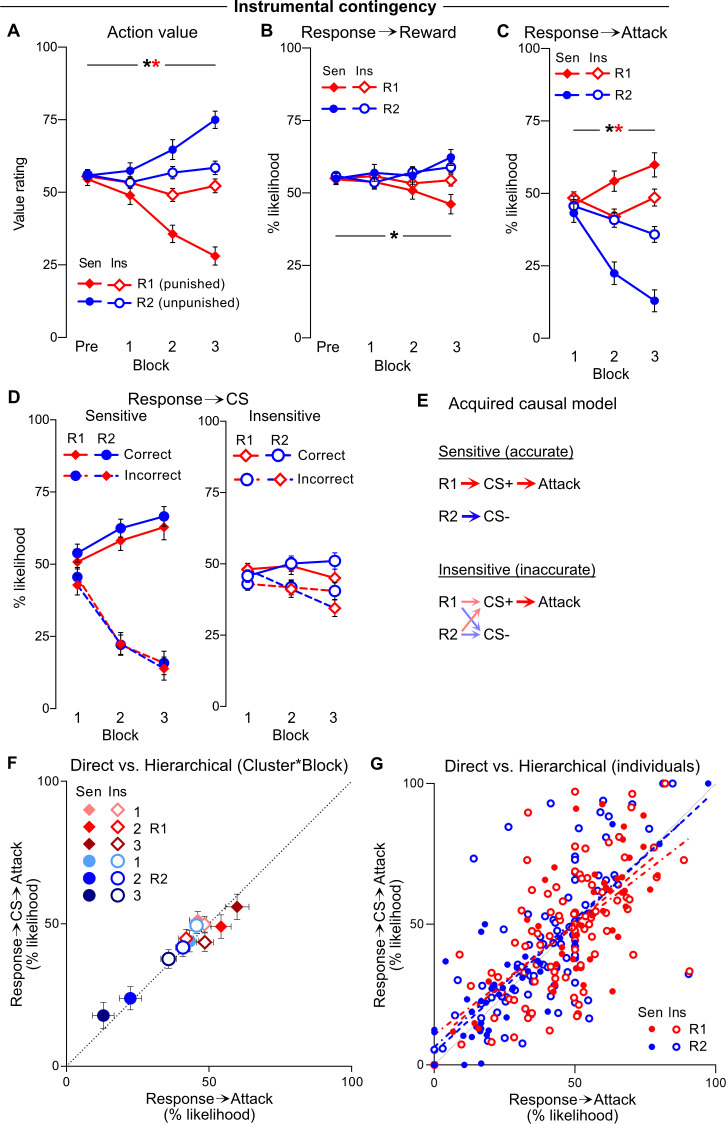
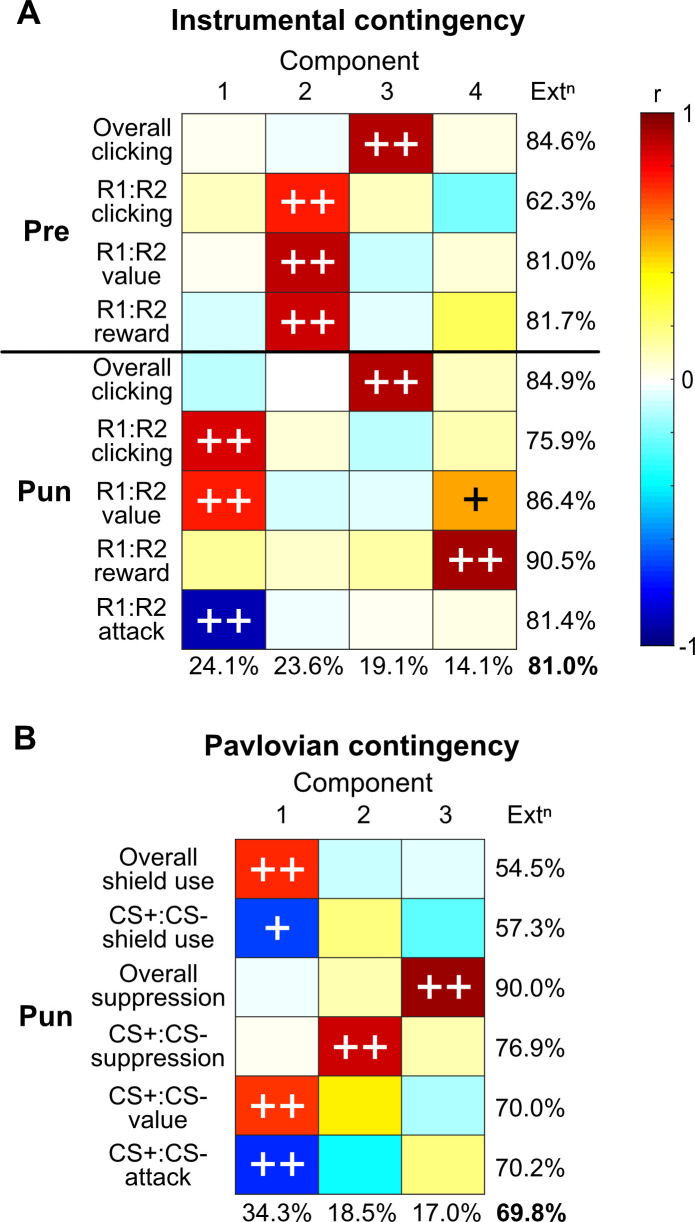
Punishment maximises the probability of our individual survival by reducing behaviours that cause us harm, and also sustains trust and fairness in groups essential for social cohesion. However, some individuals are more sensitive to punishment than others and these differences in punishment sensitivity have been linked to a variety of decision-making deficits and psychopathologies. The mechanisms for why individuals differ in punishment sensitivity are poorly understood, although recent studies of conditioned punishment in rodents highlight a key role for punishment contingency detection (Jean-Richard-Dit-Bressel et al., 2019). Here, we applied a novel 'Planets and Pirates' conditioned punishment task in humans, allowing us to identify the mechanisms for why individuals differ in their sensitivity to punishment. We show that punishment sensitivity is bimodally distributed in a large sample of normal participants. Sensitive and insensitive individuals equally liked reward and showed similar rates of reward-seeking. They also equally disliked punishment and did not differ in their valuation of cues that signalled punishment. However, sensitive and insensitive individuals differed profoundly in their capacity to detect and learn volitional control over aversive outcomes. Punishment insensitive individuals did not learn the instrumental contingencies, so they could not withhold behaviour that caused punishment and could not generate appropriately selective behaviours to prevent impending punishment. These differences in punishment sensitivity could not be explained by individual differences in behavioural inhibition, impulsivity, or anxiety. This bimodal punishment sensitivity and these deficits in instrumental contingency learning are identical to those dictating punishment sensitivity in non-human animals, suggesting that they are general properties of aversive learning and decision-making.

Keywords: Instrumental; Punishment; human; learning; neuroscience.


Conflict of interest statement

PJ, JL, SL, GW, PL, GM No competing interests declared

Figures

Figure 1.
Figure 1.. Design and aggregate behaviour in ‘Planets and Pirates’ task.
(A) During pre-punishment phase, participants could continuously click on two planets (R1 and R2 [side counterbalanced]) to earn reward (+100 points, 50% chance per response). (B) During conditioned punishment phase, additional R1→CS+ and R2→CS- contingencies were introduced (20% chance per response). CS+ precipitated attack (−20% point loss), whereas CS- had no aversive consequence. A shield button was made available on a random 50% of CS presentations; activating the shield cost 50 points but prevented any point loss from attacks. (C) Preference ratio (orange line = mean ± SEM; dots = individual preference scores) of R1:R2 clicking during pre-punishment phase (Pre) and punishment blocks (1–3). Overall, participants (n = 135) learned to avoid punishment, biasing responding away from punished R1 in favour of unpunished R2. (D) Mean ± SEM CS-elicited behaviour across punishment phase. Participants showed more response suppression (0 = complete suppression) during unshielded portions of CS+ compared CS- (left panel), and greater shield use to CS+ than CS- (right panel). * [black] p<0.05 behaviour effect; * [orange] p<0.05 vs. null ratio.
Figure 1—figure supplement 1.
Figure 1—figure supplement 1.. Click rate per planet (R1, R2) across pre-punishment blocks.
Figure 2.
Figure 2.. Behaviour in task by punishment sensitivity cluster.
(A) Final preference ratios (punishment avoidance) were bimodally distributed. Cluster analysis partitioned individuals into punishment-sensitive (n = 43; filled dots) and -insensitive (n = 92; unfilled dots) clusters. (B) Mean ± SEM preference ratio by cluster across pre-punishment (Pre) and punishment blocks (1–3); the sensitive cluster acquired punishment avoidance, while the insensitive cluster did not. (C) Mean ± SEM planet click rates by cluster across pre-punishment and punishment blocks. Clusters exhibited similar overall click rates across task phases, but divergent response allocation. (D) Mean ± SEM point gain per punishment block; only the sensitive cluster achieved a net gain in points across punishment blocks. (E) Mean ± SEM conditioned suppression to CS+ and CS- by cluster. Both clusters showed greater response suppression to CS+ than CS-; sensitive cluster showed greater response suppression overall. (F) Mean ± SEM active avoidance (shield use) by cluster. Only sensitive cluster showed significantly greater shield use during CS+ vs. CS-. Sen = sensitive cluster; Ins = insensitive cluster * [black] p<0.05 cluster main effect; * [orange] p<0.05 vs. null ratio; * [red] p<0.05 cluster*behaviour interaction.
Figure 3.
Figure 3.. Self-reported outcome and conditioned stimulus (CS) valuations, and Pavlovian contingency knowledge.
(A) Valuation of point outcomes (reward, attack) by cluster across pre-punishment (Pre) and punishment blocks (1–3). Rewards were more highly rated by the sensitive cluster. Both clusters equally disliked attacks. (B) Valuation of CS+ and CS- by cluster across punishment blocks. CS+ was valued less than CS-; clusters only differed in their valuation of CS-. (C) Pavlovian CS→Attack inferences by cluster across punishment blocks. Attacks were attributed to CS+ over CS-; clusters only differed in attack attributions following first block of punishment. Sen = sensitive cluster; Ins = insensitive cluster * [black] p<0.05 CS main effect; * [red] p<0.05 cluster*CS interaction.
Figure 4.
Figure 4.. Instrumental valuations and contingency knowledge.
(A) Mean ± SEM valuation of planets (R1, R2) by cluster across pre-punishment (Pre) and punishment blocks (1–3). Unpunished R2 was gradually valued more than punished R1, particularly by sensitive cluster. (B) Mean ± SEM instrumental Response→Reward inferences by cluster. Rewards were spuriously attributed to R2 more than R1; this did not interact with cluster. (C) Mean ± SEM instrumental Response→Attack inferences. Attacks were attributed to R1 over R2, particularly by sensitive cluster. (D) Mean ± SEM instrumental Response→CS inferences (Left panel: sensitive cluster; Right panel: insensitive cluster) according to correct (R1→CS+, R2→CS-) vs. incorrect (R1→CS-, R2→CS+) inferences. Clusters attributed CSs to their respective responses, particularly by sensitive cluster. (E) Putative causal model acquired by clusters across punishment phase. Sensitive individuals acquired accurate Response→CS and CS→Attack contingency knowledge. Insensitive individuals acquired accurate CS→Attack knowledge, but failed to acquire accurate Response→CS knowledge. (F) Mean ± SEM direct, self-reported Response→Attack inferences vs. estimate computed from hierarchical Response→CS→Attack inferences per response (R1, R2), cluster (Sen, Ins) and punishment block (1–3). Black dotted line represents perfect correspondence between direct and hierarchical inferences. (G) Direct, self-reported Response→Attack inferences vs. estimate computed from hierarchical Response→CS→Attack inferences per subject (averaged across punishment). Black dotted line represents perfect correspondence between direct and hierarchical inferences. Dashed line represents lines of best fit for sensitive cluster (per response); dotted-dashed line represents line of best fit line for insensitive cluster (per response). Sen = sensitive cluster; Ins = insensitive cluster * [black] p<0.05 response main effect; * [red] p<0.05 cluster*response interaction.
Figure 4—figure supplement 1.
Figure 4—figure supplement 1.. Relationship between self-reported Response→Attack inferences and estimate computed from hierarchical Response→CS→Attack inferences.
(A) Mean ± SEM direct Response→Attack inferences vs. estimate computed from hierarchical Response→CS+→Attack inferences per response (R1, R2), cluster (Sen, Ins) and punishment block (1–3). Black dotted line represents perfect correspondence between direct and hierarchical inferences; slight underprediction is observed without accounting for CS- contingencies. (B) Mean ± SEM direct Response→Attack inferences vs. estimate computed from hierarchical Response→CS-→Attack inferences per response (R1, R2), cluster (Sen, Ins) and punishment block (1–3). Black dotted line represents perfect correspondence between direct and hierarchical inferences; substantial underprediction is observed without accounting for CS+ contingencies.
Figure 5.
Figure 5.. Alignments in behaviour, valuations, and contingency knowledge.
(A) Principal component analysis of instrumental behaviour, valuations, and contingency knowledge across pre-punishment (Pre) and punishment (Pun) phases. (B) Principal component analysis of conditioned stimulus (CS)-related (Pavlovian) behaviour, valuations, and contingency knowledge across punishment (Pun) phase. Extn = overall extraction; ++ = >0.707 loading (>50% variance accounted for by component); + = >0.5 loading (>25% variance accounted for by component).

Similar articles

Cited by

References

    1. Adrián-Ventura J, Costumero V, Parcet MA, Ávila C. Linking personality and brain anatomy: a structural MRI approach to reinforcement sensitivity theory. Social Cognitive and Affective Neuroscience. 2019;14:329–338. doi: 10.1093/scan/nsz011. - DOI - PMC - PubMed
    1. American Psychiatric Association . Diagnostic and Statistical Manual of Mental Disorders. 5th edn. Washington, D.C.: American Psychiatric Publishing; 2013.
    1. Bechara A, Damasio H, Tranel D, Damasio AR. Deciding Advantageously Before Knowing the Advantageous Strategy. Science. 1997;275:1293–1295. doi: 10.1126/science.275.5304.1293. - DOI - PubMed
    1. Bechara A, Damasio H, Tranel D, Damasio AR. The Iowa Gambling Task and the somatic marker hypothesis: some questions and answers. Trends in Cognitive Sciences. 2005;9:159–162. doi: 10.1016/j.tics.2005.02.002. - DOI - PubMed
    1. Blair KS, Morton J, Leonard A, Blair RJR. Impaired decision-making on the basis of both reward and punishment information in individuals with psychopathy. Personality and Individual Differences. 2006;41:155–165. doi: 10.1016/j.paid.2005.11.031. - DOI

Publication types