. 2021 Jul 1;148(13):dev196519.
doi: 10.1242/dev.196519. Epub 2021 Jul 1.

Hydrostatic mechanical stress regulates growth and maturation of the atrioventricular valve

Affiliations

Hydrostatic mechanical stress regulates growth and maturation of the atrioventricular valve

David Bassen et al. Development. .

Abstract

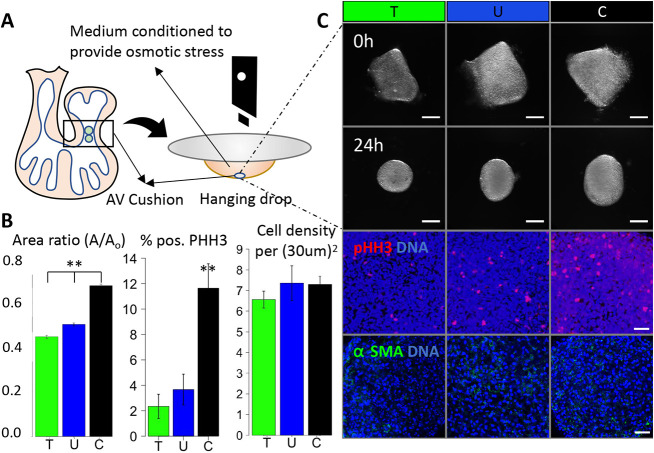
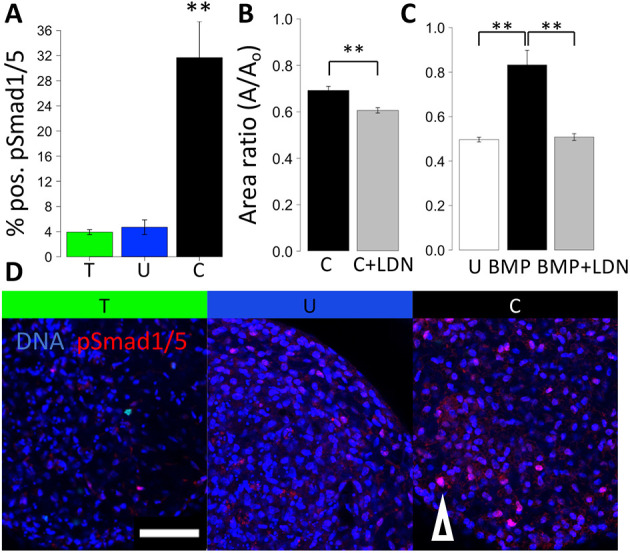
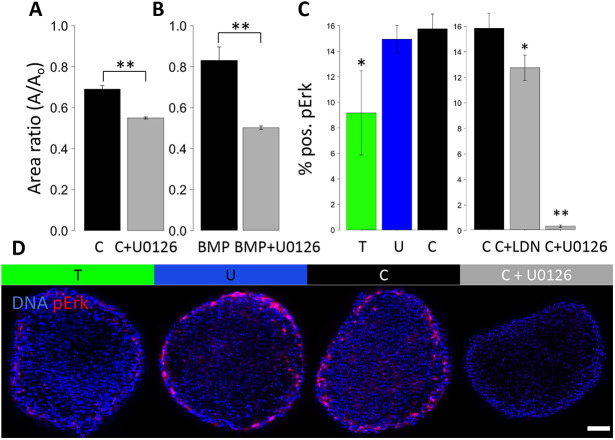
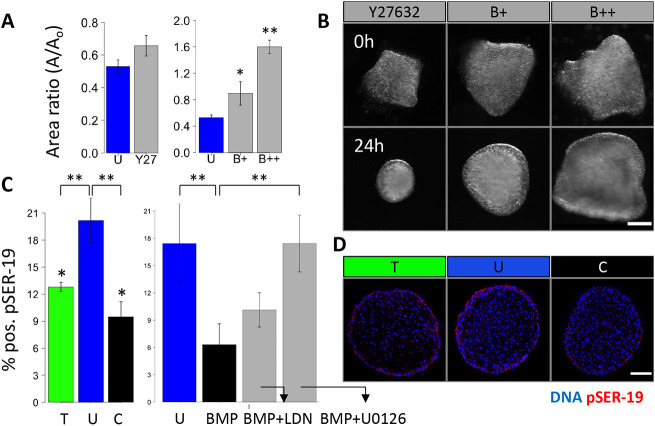
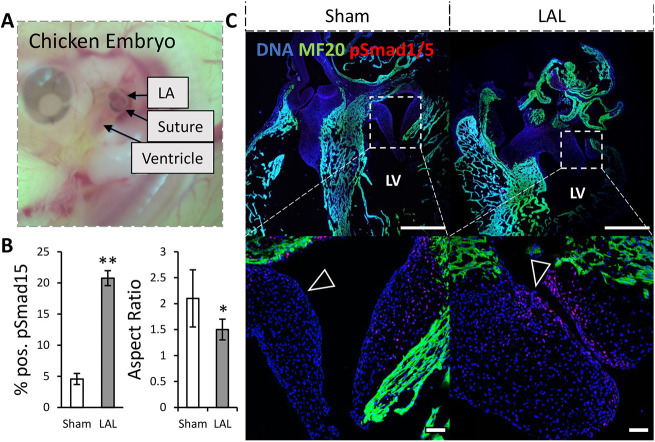
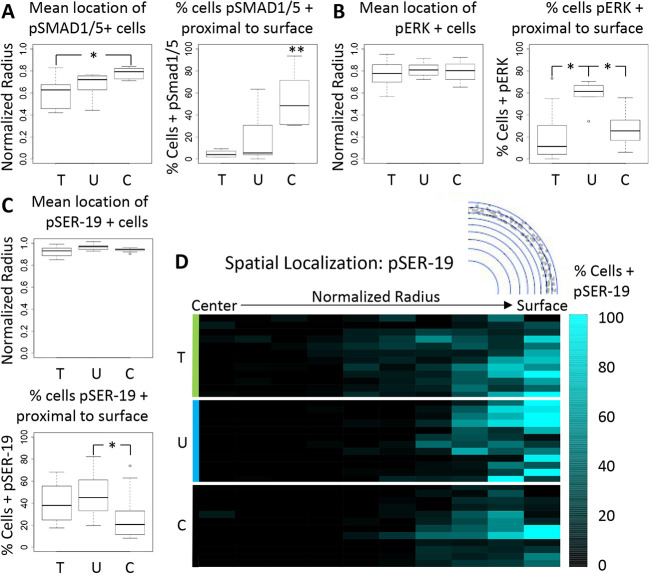
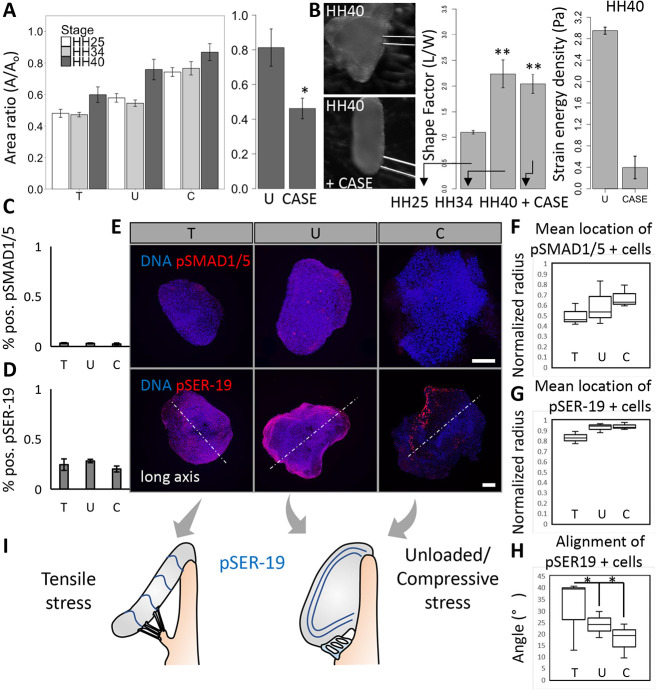
During valvulogenesis, cytoskeletal, secretory and transcriptional events drive endocardial cushion growth and remodeling into thin fibrous leaflets. Genetic disorders play an important role in understanding valve malformations but only account for a minority of clinical cases. Mechanical forces are ever present, but how they coordinate molecular and cellular decisions remains unclear. In this study, we used osmotic pressure to interrogate how compressive and tensile stresses influence valve growth and shape maturation. We found that compressive stress drives a growth phenotype, whereas tensile stress increases compaction. We identified a mechanically activated switch between valve growth and maturation, by which compression induces cushion growth via BMP-pSMAD1/5, while tension induces maturation via pSer-19-mediated MLC2 contractility. The compressive stress acts through BMP signaling to increase cell proliferation and decrease cell contractility, and MEK-ERK is essential for both compressive stress and BMP mediation of compaction. We further showed that the effects of osmotic stress are conserved through the condensation and elongation stages of development. Together, our results demonstrate that compressive/tensile stress regulation of BMP-pSMAD1/5 and MLC2 contractility orchestrates valve growth and remodeling.

Keywords: BMP signaling; Cardiac valve development; MLC contractility; Mechanobiology.


Conflict of interest statement

Competing interests The authors declare no competing or financial interests.

Figures

Fig. 1.
Fig. 1.
Osmotic pressure regulates the cushion compaction phenotype in vitro. (A) Schematic of experimental design. (B) Compaction (24 h), proliferation (10 h) and cell density (24 h) of HH25 AV cushions cultured in conditioned media. (C) Endpoint bright-field and immunofluorescence images of HH25 AV cushions compacting and rounding over 24 h of hanging drop culture. T, tensile stress; U, unloaded; C, compressive stress. Scale bars: 200 μm in bright-field images; 0.25 μm in immunofluorescence images. n=4-6 cushions per condition from 3-6 independent experiments; data are mean±s.e.m. **P<0.01 (ANOVA with Tukey's post-hoc test).
Fig. 2.
Fig. 2.
Compressive stress regulates tissue compaction through BMP signaling. (A) Percentage of cells positive for pSmad1 and pSmad5 in HH25 cushions cultured under osmotic stress for 24 h, n=4 or 5, data are mean±s.d. (B) Compaction trend for compressive stress combined with the Alk2/3 inhibitor LDN. (C) Compaction trend for BMP treatment combined with the Alk2/3 inhibitor LDN, n=4 or 5 cushions per condition, data are mean±s.e.m. (D) Representative immunofluorescence images stained for pSmad1/5 of HH25 cushions cultured under osmotic stress over 24 h. T, tensile stress; U, unloaded; C, compressive stress. Arrowhead indicates an example of a pSmad1/5-positive cell. Scale bar: 50 μm, **P<0.01 [ANOVA with Tukey's post-hoc test (A,C) and a two-tailed unpaired t-test (C)].
Fig. 3.
Fig. 3.
MEK-ERK is involved in the tissue growth driven by BMP and by compressive stress. (A) Compaction trend for compressive stress combined with the MEK inhibitor U0126. (B) Compaction trend for BMP treatment combined with the MEK inhibitor. (C) Percentage of cells positive for pERK in HH25 cushions cultured under osmotic stress, and cultured with BMP and MEK inhibitors. (D) Representative immunofluorescence images stained for pERK of HH25 cushions cultured under osmotic stress and cultured with a MEK inhibitor. T, tensile stress; U, unloaded; C, compressive stress. Scale bar: 50 μm, n=4-6 cushions per condition per three independent experiments, data are mean±s.e.m., *P<0.05, **P<0.01 [ANOVA with Tukey's post-hoc test (C) and a two-tailed unpaired t-test (A,B)].
Fig. 4.
Fig. 4.
NM-myosin-II is inhibited in tissue growth driven by BMP and by compressive stress. (A) Compaction of HH25 AV cushions cultured with the ROCK inhibitor Y27632, 1 μM NM myosin II inhibitor blebbistatin (B+) and 10 μM blebbistatin (B++) for 24 h. (B) Representative images of cushions treated with blebbistatin showing varying degrees of compaction and rounding. (C) Percentage of pSER19-positive cells in HH25 cushions cultured under osmotic stress, and with BMP, the BMP inhibitor LDN and the MEK inhibitor U0126 for 24 h. (D) Representative immunofluorescence images stained for pSER19 of HH25 cushions cultured under osmotic stress over 24 h. Scale bars: 50 μm, n=4-6 cushions per condition per three independent experiments, data are mean±s.e.m., *P<0.05, **P<0.01 (ANOVA with Tukey's post-hoc test).
Fig. 5.
Fig. 5.
Altered mechanical loading upregulates BMP signaling and impairs valve thinning in vivo. (A) Photo showing left atrial ligation of the chicken embryo heart. (B) Number of cells positive for pSmad1 and pSmad5, n=3 sections from independent embryos per condition, data are mean±s.d. (C) Immunohistochemical images of HH30 chick mitral valve stained for pSmad1 and pSmad5 and MF20 (myocardial marker) with arrowheads indicating location on the atrial aspect with increased pSmad1 and pSmad5 signaling under LAL. Scale bars: 100 μm, LV, left ventricle; LA, left atrium, *P<0.05, **P<0.01 (two-tailed unpaired t-test).
Fig. 6.
Fig. 6.
Smad1/5, ERK and myosin activity are spatially coordinated in response to osmotic stress. (A) The mean normalized radii for pSmad1- and pSmad5-positive cells in HH25 cushions cultured under osmotic conditions, and percentage of signal at or near the cushion surface. (B,C) The same scenarios are shown for pERK-positive cells (B) and pSER19-positive cells (C). Lines within boxes indicate the median. The length of each box represents the interquartile range. The whiskers indicate the highest and lowest observed values (unless outliers, which are indicated by points). (D) Color map of pSmad1 and pSmad5 distribution along a normalized cushion radius within 10 regions of interest of equal area. n=3-8 cushions per group with two slices per cushion around 30 μm. T, tensile stress; U, unloaded; C, compressive stress. *P<0.05, **P<0.01 (ANOVA with Tukey's post-hoc test).
Fig. 7.
Fig. 7.
Compressive/tensile stress-regulated tissue compaction is conserved across stages of valve maturation and its interaction with extracellular matrix preserves leaflet morphology. (A) The compaction behavior of cushions across mid to late stages under osmotic stress conditions, and across late stage (HH40) compaction with collagenase II treatment (300 U). (B) Wide-field images of a HH40 leaflet before and after 24 h treatment with collagenase II (CASE). Shape factors, measured as aspect ratio, of HH25 and HH34 cushions cultured for 24 h, and HH40 leaflets cultured with collagenase II for 24 h. n=4-6 cushions per condition per three independent experiments, data are mean±s.e.m. Strain energy densities for control/unloaded and collagenase treated HH40 leaflets, three or four cushions per condition, data are mean±s.d. Percentage of pSmad1- and pSmad5- (C), and pSER19- (D) positive cells in HH40 leaflets cultured under osmotic stress for 24 h, n=3 leaflets per condition, data are mean±s.d. (E) Representative 3D reconstructed immunofluorescence images stained for pSmad1 and pSmad5, and pSER19 of HH40 leaflets cultured under osmotic stress over 24 h. The mean normalized radii for pSmad1- and pSmad5- (F), and pSER19- (G) positive cells in HH40 leaflets cultured under osmotic stress, n=3 leaflets per condition. (H) Angle between aligned pSER19-positive cells and long axis (perpendicular to elongation direction), n=3. Lines within boxes indicate the median. The length of each box represents the interquartile range. The whiskers indicate the highest and lowest observed values (unless outliers, which are indicated by points). (I) Schematic of alignment of pSER19-positive cells in HH40 leaflets under compressive/tensile stress and unloaded conditions. Scale bars: 100 μm. *P<0.05, **P<0.01.

References

    1. Ahsan, S., Ge, Y. and Tainsky, M. A. (2016). Combinatorial therapeutic targeting of BMP2 and MEK-ERK pathways in NF1-associated malignant peripheral nerve sheath tumors. Oncotarget 7, 57171-57185. 10.18632/oncotarget.11036 - DOI - PMC - PubMed
    1. Aikawa, E., Whittaker, P., Farber, M., Mendelson, K., Padera, R. F., Aikawa, M. and Schoen, F. J. (2006). Human semilunar cardiac valve remodeling by activated cells from fetus to adult: implications for postnatal adaptation, pathology, and tissue engineering. Circulation 113, 1344-1352. 10.1161/CIRCULATIONAHA.105.591768 - DOI - PubMed
    1. Aubin, J., Davy, A. and Soriano, P. (2004). In vivo convergence of BMP and MAPK signaling pathways: impact of differential Smad1 phosphorylation on development and homeostasis. Genes Dev. 18, 1482-1494. 10.1101/gad.1202604 - DOI - PMC - PubMed
    1. Basser, P. J., Schneiderman, R., Bank, R. A., Wachtel, E. and Maroudas, A. (1998). Mechanical properties of the collagen network in human articular cartilage as measured by osmotic stress technique. Arch. Biochem. Biophys. 351, 207-219. 10.1006/abbi.1997.0507 - DOI - PubMed
    1. Beppu, H., Malhotra, R., Beppu, Y., Lepore, J. J., Parmacek, M. S. and Bloch, K. D. (2009). BMP type II receptor regulates positioning of outflow tract and remodeling of atrioventricular cushion during cardiogenesis. Dev. Biol. 331, 167-175. 10.1016/j.ydbio.2009.04.032 - DOI - PMC - PubMed

Publication types