

Visualizing the effects of lactate dehydrogenase (LDH) inhibition and LDH-A genetic ablation in breast and lung cancer with hyperpolarized pyruvate NMR
- PMID: 34086382
- PMCID: PMC8764798
- DOI: 10.1002/nbm.4560
Visualizing the effects of lactate dehydrogenase (LDH) inhibition and LDH-A genetic ablation in breast and lung cancer with hyperpolarized pyruvate NMR
Abstract
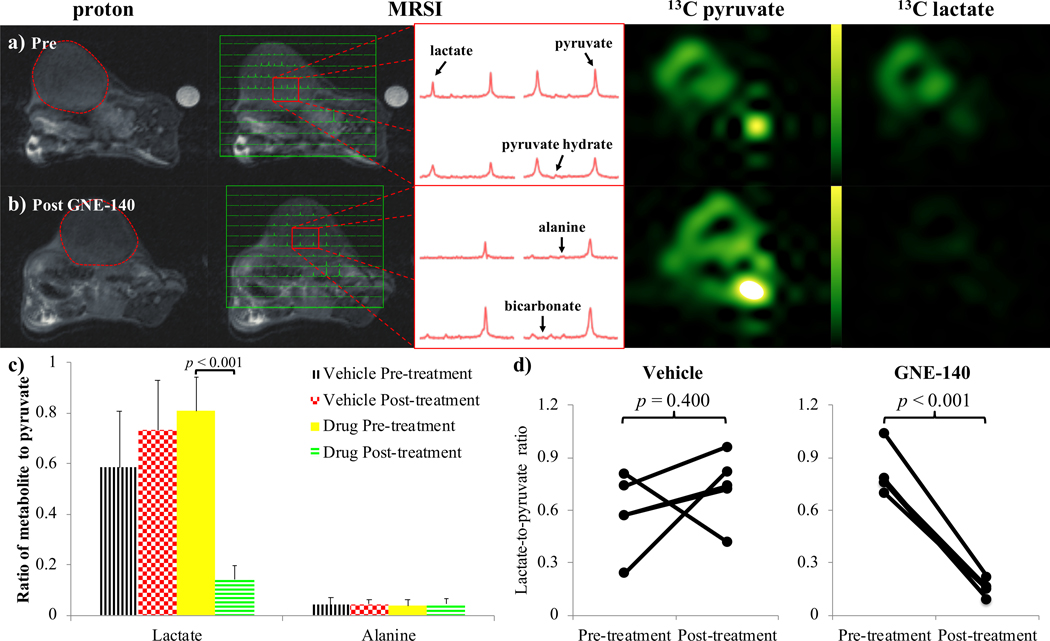
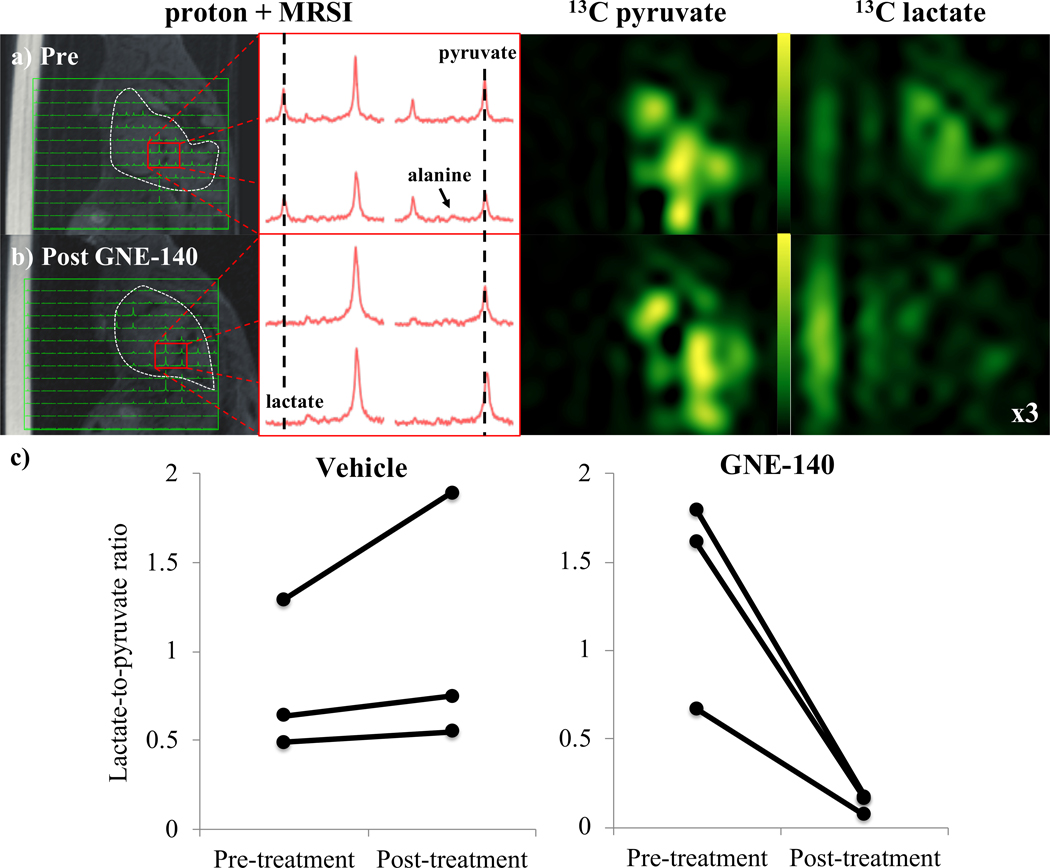
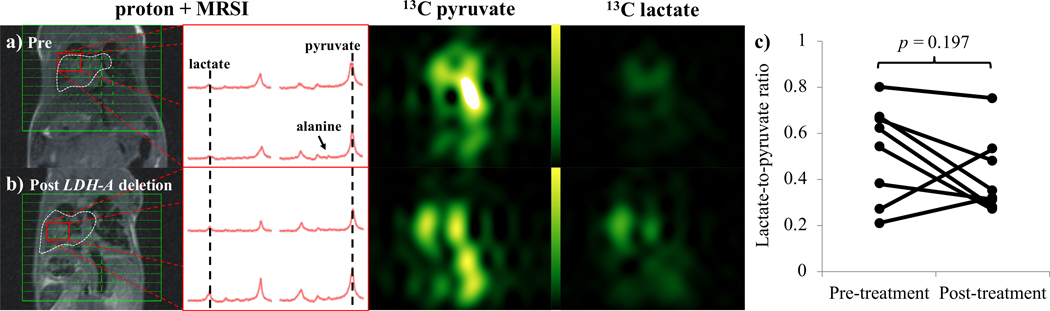
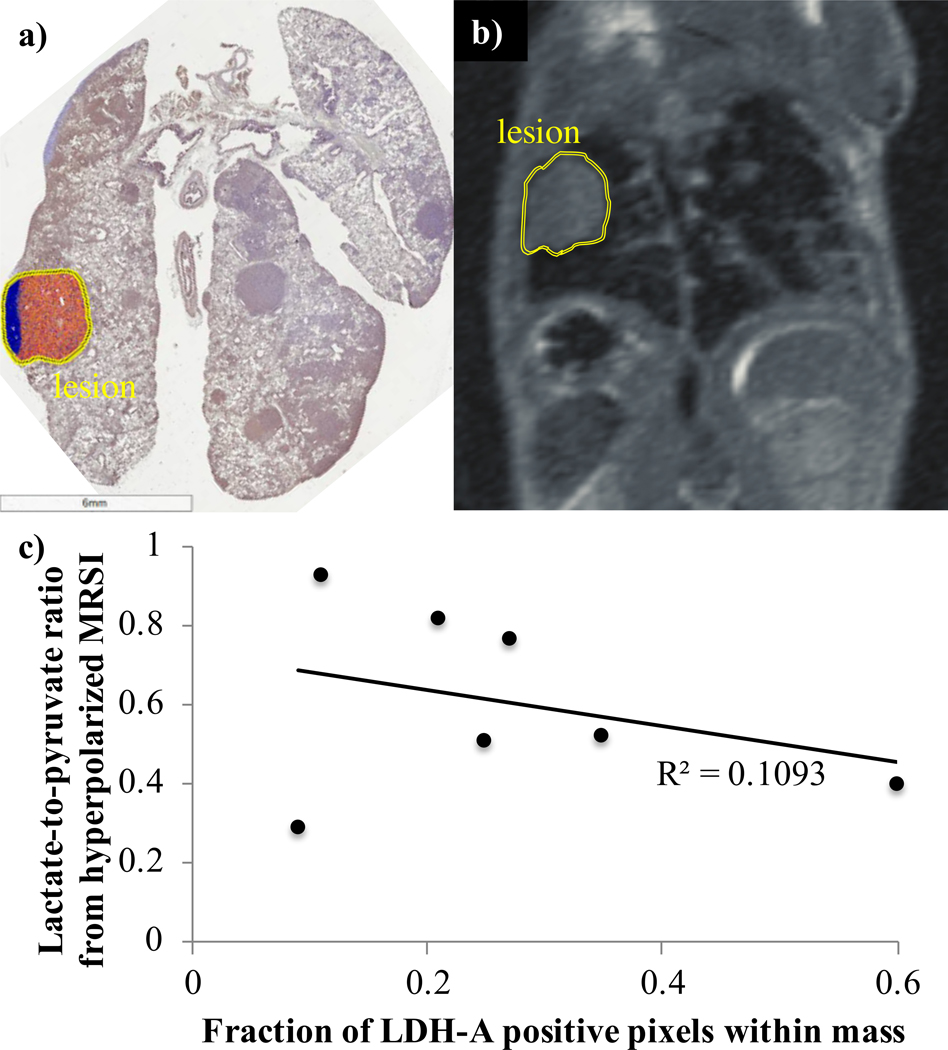
In many tumors, cancer cells take up large quantities of glucose and metabolize it into lactate, even in the presence of sufficient oxygen to support oxidative metabolism. It has been hypothesized that this malignant metabolic phenotype supports cancer growth and metastasis, and that reversal of this so-called "Warburg effect" may selectively harm cancer cells. Conversion of glucose to lactate can be reduced by ablation or inhibition of lactate dehydrogenase (LDH), the enzyme responsible for conversion of pyruvate to lactate at the endpoint of glycolysis. Recently developed inhibitors of LDH provide new opportunities to investigate the role of this metabolic pathway in cancer. Here we show that magnetic resonance spectroscopic imaging of hyperpolarized pyruvate and its metabolites in models of breast and lung cancer reveal that inhibition of LDH was readily visualized through reduction in label exchange between pyruvate and lactate, while genetic ablation of the LDH-A isoform alone had smaller effects. During the acute phase of LDH inhibition in breast cancer, no discernible bicarbonate signal was observed and small signals from alanine were unchanged.
Keywords: GNE140; LDH; LDH-A; MRSI; Warburg effect; cancer metabolism; hyperpolarized 13C pyruvate.
© 2021 John Wiley & Sons, Ltd.
Figures
Similar articles
-
Excess exogenous pyruvate inhibits lactate dehydrogenase activity in live cells in an MCT1-dependent manner.J Biol Chem. 2021 Jul;297(1):100775. doi: 10.1016/j.jbc.2021.100775. Epub 2021 May 20. J Biol Chem. 2021. PMID: 34022218 Free PMC article.
-
Imaging breast cancer using hyperpolarized carbon-13 MRI.Proc Natl Acad Sci U S A. 2020 Jan 28;117(4):2092-2098. doi: 10.1073/pnas.1913841117. Epub 2020 Jan 21. Proc Natl Acad Sci U S A. 2020. PMID: 31964840 Free PMC article.
-
Hyperpolarized [1-13C]pyruvate-to-[1-13C]lactate conversion is rate-limited by monocarboxylate transporter-1 in the plasma membrane.Proc Natl Acad Sci U S A. 2020 Sep 8;117(36):22378-22389. doi: 10.1073/pnas.2003537117. Epub 2020 Aug 24. Proc Natl Acad Sci U S A. 2020. PMID: 32839325 Free PMC article.
-
Lactate shuttle: from substance exchange to regulatory mechanism.Hum Cell. 2022 Jan;35(1):1-14. doi: 10.1007/s13577-021-00622-z. Epub 2021 Oct 4. Hum Cell. 2022. PMID: 34606041 Review.
-
The redox switch/redox coupling hypothesis.Neurochem Int. 2006 May-Jun;48(6-7):523-30. doi: 10.1016/j.neuint.2005.12.036. Epub 2006 Mar 10. Neurochem Int. 2006. PMID: 16530294 Review.
Cited by
-
Neurons require glucose uptake and glycolysis in vivo.Cell Rep. 2023 Apr 25;42(4):112335. doi: 10.1016/j.celrep.2023.112335. Epub 2023 Apr 6. Cell Rep. 2023. PMID: 37027294 Free PMC article.
-
Impact of lactate on immune cell function in the tumor microenvironment: mechanisms and therapeutic perspectives.Front Immunol. 2025 Mar 26;16:1563303. doi: 10.3389/fimmu.2025.1563303. eCollection 2025. Front Immunol. 2025. PMID: 40207222 Free PMC article. Review.
-
Targeting the lactic acid metabolic pathway for antitumor therapy.Mol Ther Oncolytics. 2023 Oct 31;31:100740. doi: 10.1016/j.omto.2023.100740. eCollection 2023 Dec 19. Mol Ther Oncolytics. 2023. PMID: 38033399 Free PMC article. Review.
-
Anti-cancer Substances and Safety of Lactic Acid Bacteria in Clinical Treatment.Front Microbiol. 2021 Oct 12;12:722052. doi: 10.3389/fmicb.2021.722052. eCollection 2021. Front Microbiol. 2021. PMID: 34721321 Free PMC article. Review.
-
Metabolic Effects of New Glucose Transporter (GLUT-1) and Lactate Dehydrogenase-A (LDH-A) Inhibitors against Chemoresistant Malignant Mesothelioma.Int J Mol Sci. 2023 Apr 24;24(9):7771. doi: 10.3390/ijms24097771. Int J Mol Sci. 2023. PMID: 37175477 Free PMC article.
References
-
- Warburg O. On respiratory impairment in cancer cells. Science (80- ). 1956;124(3215):269–270. - PubMed
Publication types
MeSH terms
Substances
Grants and funding
LinkOut - more resources
Full Text Sources
Medical
Miscellaneous
