. 2021 Jun 4;16(6):e0252013.
doi: 10.1371/journal.pone.0252013. eCollection 2021.

An external telemetry system for recording resting heart rate variability and heart rate in free-ranging large wild mammals

Affiliations

An external telemetry system for recording resting heart rate variability and heart rate in free-ranging large wild mammals

Sean D Twiss et al. PLoS One. .

Abstract

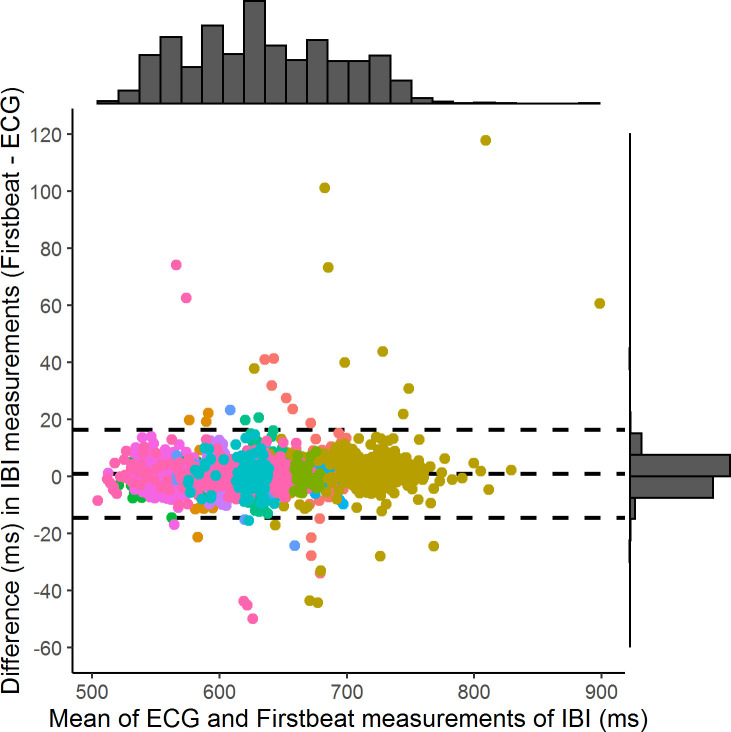
Measures of heart rate variability (and heart rate more generally) are providing powerful insights into the physiological drivers of behaviour. Resting heart rate variability (HRV) can be used as an indicator of individual differences in temperament and reactivity to physical and psychological stress. There is increasing interest in deriving such measures from free ranging wild animals, where individuals are exposed to the natural and anthropogenic stressors of life. We describe a robust, externally mounted heart rate monitor for use in wild mammals, deployed here on wild breeding adult female grey seals (Halichoerus grypus), that delivers millisecond precise measures of inter beat intervals (IBIs), allowing computation of resting HRV parameters. Based on Firstbeat™ heart rate belts, our system allows for remote, continuous recording of IBI data from over 30 individuals simultaneously at ranges of up to 200m. We assessed the accuracy of the IBI data provided by the Firstbeat™ system using concurrent IBI data derived from in-field electrocardiogram (ECG) recordings. Bland-Altmann analyses demonstrated high correspondence between the two sets of IBI data, with a mean difference of 0.87±0.16ms. We used generalized additive mixed-effects models to examine the impact of the default Firstbeat™ software artefact correction procedure upon the generation of anomalous data (flats and stairs). Artefact correction and individual activity were major causes of flats and stairs. We used simulations and models to assess the impact of these errors on estimates of resting HRV and to inform criteria for subsampling relatively error free IBI traces. These analyses allowed us to establish stringent filtering procedures to remove traces with excessive numbers of artefacts, including flats and stairs. Even with strict criteria for removing potentially erroneous data, the abundance of data yielded by the Firstbeat™ system provides the potential to extract robust estimates of resting HRV. We discuss the advantages and limitations of our system for applications beyond the study system described here.


Conflict of interest statement

The authors have declared that no competing interests exist.

Figures

Fig 1
Fig 1. FirstbeatTM transmitter and modified electrodes.
Image also shows the two attachment donuts, the right hand one with cover plate in place.
Fig 2
Fig 2. The mounting of the FirstbeatTM transmitter and modified electrodes on an adult female grey seal.
Devices and cables were protected by nylon (blue and green in Fig 2A). Anterior of the centrally mounted heart rate transmitter is the accelerometer mounting (a). Data were transmitted to a receiving station located within line-of-sight at distances of up to 200 m from instrumented seals (b).
Fig 3
Fig 3. Example 300 s traces of interbeat intervals (ms), corrected for artefacts by Firstbeat™ Sports software (v.4.5.0.2), from the Firstbeat™ heart rate belts deployed on lactating grey seals.
(a) A trace with less than 5% flats (green dots) and stairs (blue dots). (b) A trace with a prolonged period of flats (0 - c. 85 s). (c) A trace with sequences of stairs (c. 115 s, 165 s and 265 s). All traces also contain additional isolated flats and stairs.
Fig 4
Fig 4. Bland-Altman plot showing limits of agreements between Firstbeat™ IBI data and AliveCor ECG measurements during recapture events (n = 16 traces | 12 individuals).
Each dot represents a single IBI, and different colours indicate individual seals. Horizontal dashed lines represent mean difference (0.87 ms) and lower (-14.89 ms) and upper limits of agreement (16.61 ms). The 95% confidence intervals for the bias (mean difference, centre line) are 0.61 to 1.12 ms. The 95% confidence intervals for the lower limit of agreement (lower broken line) are -15.33 to -14.43 ms. The 95% confidence intervals for the upper limit of agreement (upper broken line) are 16.16 to 17.06 ms.
Fig 5
Fig 5
Estimated smoothing curves for GAMM describing the effect that (a) the percentage of the trace comprised of artefacts, (b) proportion of activity, (c) deployment time and (d) day of year have on the number of flats in 5 min IBI traces for female grey seals. The smoothing curve is indicated by the solid black line with approximate 95% confidence intervals represented by grey shading. On the y-axis, 0 indicates no effect of the covariate, while positive values indicate positive correlation and negative values indicate negative correlation. The effect, relative to the mean number of stairs (dashed line), for a particular value of a covariate can be obtained as the natural antilogarithm of the y-axis value for the smoothing curve. The sampling spread of HR traces across each covariate scale is indicated by above the x-axis.
Fig 6
Fig 6
Estimated smoothing curves for GAMM describing the effect that (a) the percentage of artefacts, (b) proportion of activity and (c) temperature have on the number of stairs in 5 min IBI traces for female grey seals. The smoothing curve is indicated by the solid black line with approximate 95% confidence intervals represented by grey shading. On the y-axis, 0 indicates no effect of the covariate, while positive values indicate positive correlation and negative values indicate negative correlation. The effect, relative to the mean number of stairs (dashed line), for a particular value of a covariate can be obtained as the natural antilogarithm of the y-axis value for the smoothing curve. The sampling spread of HR traces across each covariate scale is indicated by above the x-axis.
Fig 7
Fig 7
Estimated smoothing curves for GAMM describing the effect that (a) proportion of activity, (b) deployment time, (c) day of year and (d) time of day have on the number of artefacts identified by the FirstbeatTM software in 5 min IBI traces for female grey seals. The smoothing curve is indicated by the solid black line with approximate 95% confidence intervals represented by grey shading. On the Y axis, 0 indicates no effect of the covariate, while positive values indicate positive correlation and negative values indicate negative correlation. The effect, relative to the mean number of stairs (dashed line), for a particular value of a covariate can be obtained as the natural antilogarithm of the y-axis value for the smoothing curve. The sampling spread of HR traces across each covariate scale is indicated by above the x-axis.
Fig 8
Fig 8
Output of n = 1000 simulations for increasing proportion of flats (a) and stairs (b) in IBI traces with high (dotted curve), moderate (dashed curve) and low (solid curve) resting rMSSD estimates. Proportion of flats and stairs shown to a maximum of 50% of the trace, rMSSD estimates diminish to zero at 100% flats or stairs in all traces. Vertical grey dashed line indicates the 5% flats or stairs for reference. The curves do have 95% confidence intervals plotted, but these are narrower than the width of the plotting line, so are not visible.

References

    1. Koolhaas JM, Korte SM, De Boer SF, Van Der Vegt BJ, Van Reenen CG, Hopster H, et al.. Coping styles in animals: current status in behavior and stress physiology. Neurosci. Biobehav. Rev. 1999. 23:925–935. doi: 10.1016/s0149-7634(99)00026-3 - DOI - PubMed
    1. Koolhaas JM, De Boer SF, Coppens CM, Buwalda B. Neuroendocrinology of coping styles: Towards understanding the biology of individual variation. Front. Neuroendocrinol. 2010. 31:307–321. doi: 10.1016/j.yfrne.2010.04.001 - DOI - PubMed
    1. von Borell E, Langbein J, Despres G, Hansen S, Leterrier C, Marchant-Forde J, et al.. Heart rate variability as a measure of autonomic regulation of cardiac activity for assessing stress and welfare in farm animals: a review. Physiol. Behav. 2007. 92:293–316. doi: 10.1016/j.physbeh.2007.01.007 - DOI - PubMed
    1. Mohr E, Langbein J, Nürnberg G. Heart rate variability: a noninvasive approach to measure stress in calves and cows. Physiol. Behav. 2002. 75:251–9. doi: 10.1016/s0031-9384(01)00651-5 - DOI - PubMed
    1. Marchant-Forde RM, Marlin DJ, Marchant-Forde JN. Validation of a cardiac monitor for measuring heart rate variability in adult female pigs: accuracy, artefacts and editing. ‎Physiol. Behav. 2004. 80:449–458. - PubMed

Publication types