. 2021 Jun 4;16(6):e0252799.
doi: 10.1371/journal.pone.0252799. eCollection 2021.

Plasma ACE2 predicts outcome of COVID-19 in hospitalized patients

Affiliations

Plasma ACE2 predicts outcome of COVID-19 in hospitalized patients

Tue W Kragstrup et al. PLoS One. .

Abstract

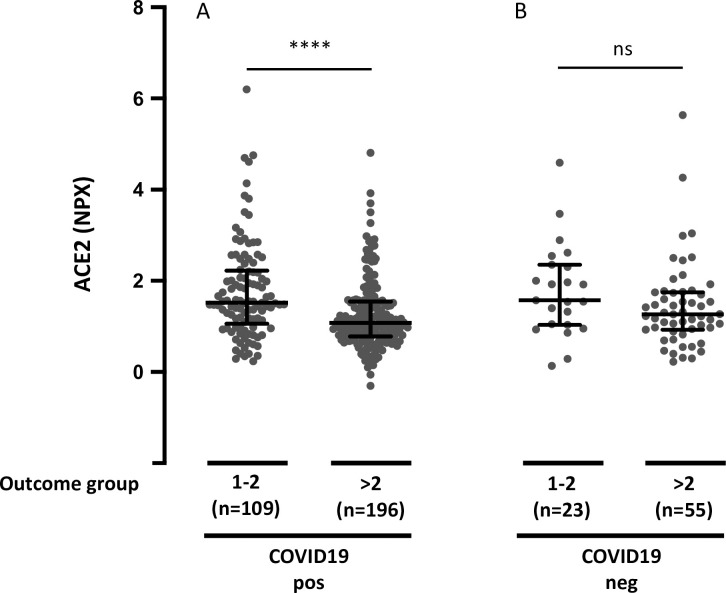
Aims: Severe acute respiratory syndrome coronavirus 2 (SARS-CoV-2) binds to angiotensin converting enzyme 2 (ACE2) enabling entrance of the virus into cells and causing the infection termed coronavirus disease of 2019 (COVID-19). Here, we investigate associations between plasma ACE2 and outcome of COVID-19.

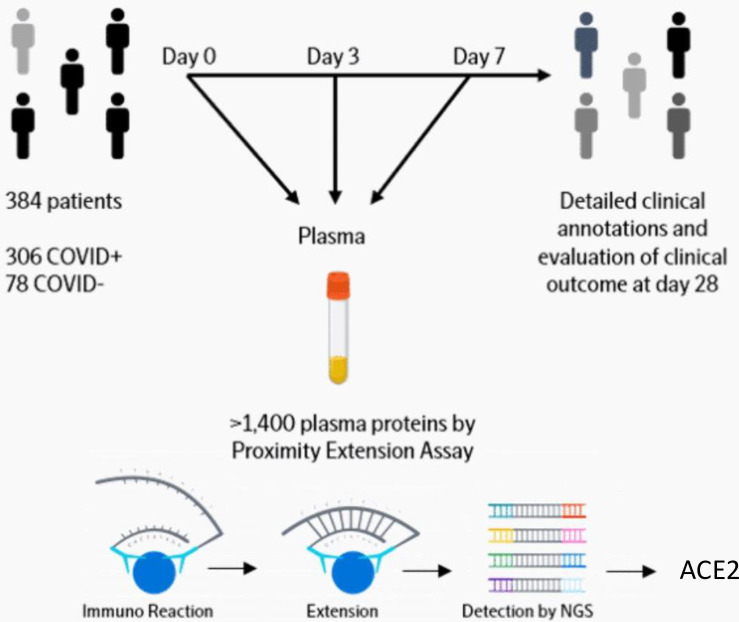
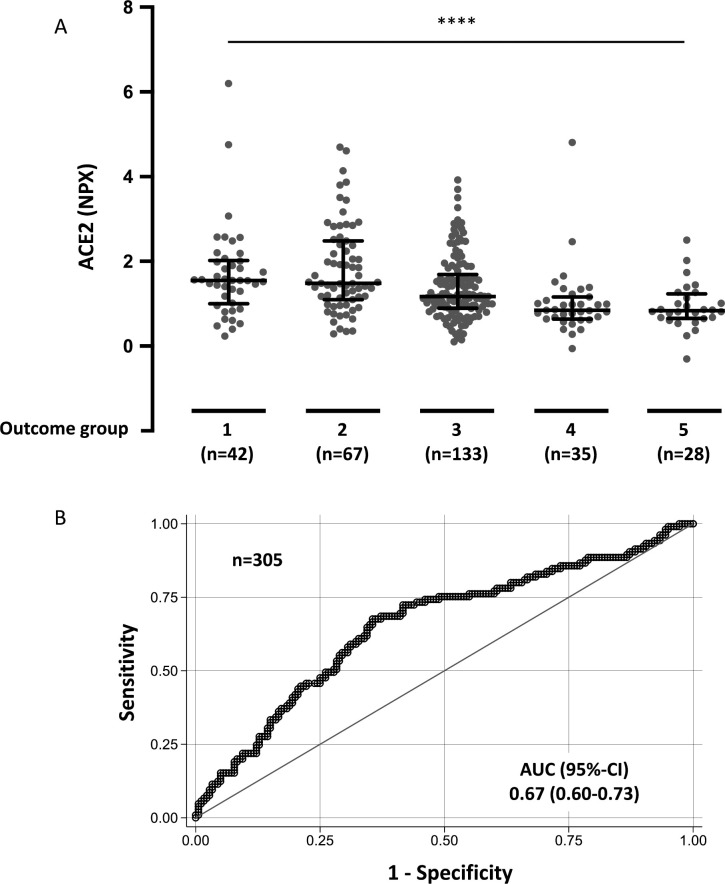
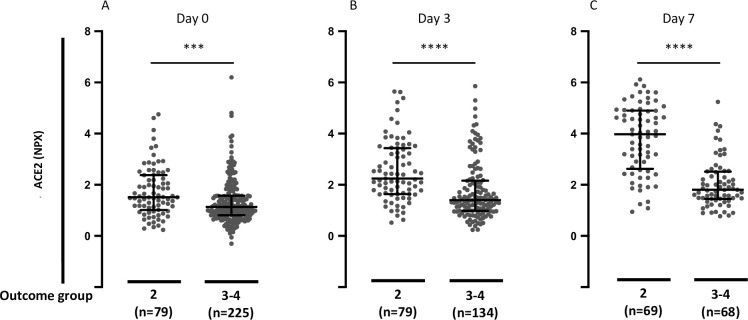
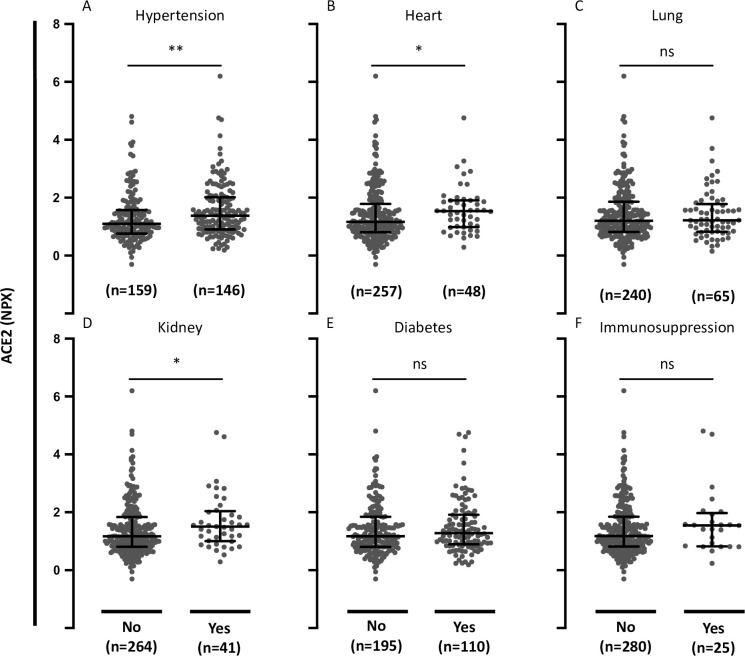
Methods and results: This analysis used data from a large longitudinal study of 306 COVID-19 positive patients and 78 COVID-19 negative patients (MGH Emergency Department COVID-19 Cohort). Comprehensive clinical data were collected on this cohort, including 28-day outcomes. The samples were run on the Olink® Explore 1536 platform which includes measurement of the ACE2 protein. High admission plasma ACE2 in COVID-19 patients was associated with increased maximal illness severity within 28 days with OR = 1.8, 95%-CI: 1.4-2.3 (P < 0.0001). Plasma ACE2 was significantly higher in COVID-19 patients with hypertension compared with patients without hypertension (P = 0.0045). Circulating ACE2 was also significantly higher in COVID-19 patients with pre-existing heart conditions and kidney disease compared with patients without these pre-existing conditions (P = 0.0363 and P = 0.0303, respectively).

Conclusion: This study suggests that measuring plasma ACE2 is potentially valuable in predicting COVID-19 outcomes. Further, ACE2 could be a link between COVID-19 illness severity and its established risk factors hypertension, pre-existing heart disease and pre-existing kidney disease.


Conflict of interest statement

IG is an employee of Olink Proteomics. This does not alter our adherence to PLOS ONE policies on sharing data and materials. The authors declare no other potential conflicts of interest.

Figures

Fig 1
Fig 1. Diagram of study work flow.
Link https://www.olink.com/mgh-covid-study/. Modified and used with permission.
Fig 2
Fig 2. Day 0 plasma ACE2 in COVID-19 positive patients by clinical outcome group and ROC curve.
A. Acuity max group is the maximum acuity score attained within the first 28 days with death being the maximum possible. A1 = Death within 28 days. A2 = Intubated, ventilated, survived to 28 days. A3 = Hospitalized, supplementary O2 required. A4 = Hospitalized, no supplementary O2 required. A5 = Discharged directly from ED and not subsequently hospitalized within 28 days. Data were analyzed using the Kruskal-Wallis test. Bars indicate median and interquartile range. **** P < 0.0001. B. Receiver operating characteristic (ROC) curve comparing severe outcome groups A1-A2 vs non-severe outcome groups A3-A5 during the 28-day period.
Fig 3
Fig 3. Plasma ACE2 in hospitalized COVID-19 positive patients segregated by acuity groups A2 (intubated) versus A3-A4 (not intubated).
A. Day 0 plasma ACE2 in hospitalized COVID-19 positive patients by acuity groups A2 (intubated) or A3-A4 (not intubated) for day 0 study window (enrollment plus 24 hours). B. Day 3 plasma ACE2 in hospitalized COVID-19 positive patients by acuity groups A2 versus A3-A4 for day 3 study window. C. Day 7 plasma ACE2 in hospitalized COVID-19 positive patients by acuity groups A2 or A3-A4 for day 7 study window. Acuity categories: A2 = Intubated, ventilated. A3 = Hospitalized, supplementary O2 required. A4 = Hospitalized, no supplementary O2 required. Bars indicate median and interquartile range. Data were analyzed using the Mann Whitney test. *** P< 0.001. **** P < 0.0001.
Fig 4
Fig 4. Plasma ACE2 in COVID-19-positive patients with comorbidities.
A. Plasma ACE2 in COVID-19-positive patients with or without pre-existing hypertension. B. Plasma ACE2 in COVID-19-positive patients with or without pre-existing heart disease (coronary artery disease, congestive heart failure, valvular disease). C. Plasma ACE2 in COVID-19-positive patients with or without pre-existing lung disease (asthma, COPD, requiring home O2, any chronic lung condition). D. Plasma ACE2 in COVID-19-positive patients with or without pre-existing kidney disease (chronic kidney disease, baseline creatinine >1.5, ESRD). E. Plasma ACE2 in COVID-19-positive patients with or without pre-existing diabetes (pre-diabetes, insulin and non-insulin dependent diabetes). F. Plasma ACE2 in COVID-19-positive patients with or without pre-existing immunocompromised condition (active cancer, chemotherapy, transplant, immunosuppressant agents, asplenic). Data were analyzed using the Mann Whitney test. Bars indicate median and interquartile range. * P< 0.05. ** P< 0.01. ns = not significant.
Fig 5
Fig 5. Plasma ACE2 in COVID-19-positive patients in relation to age and BMI.
A. Plasma ACE2 in COVID-19-positive patients by age groups. B. Plasma ACE2 in COVID-19 positive patients by body mass index (BMI) groups. Data were analyzed using the Kruskal-Wallis test. *** P< 0.001. ns = not significant.
Fig 6
Fig 6. Plasma ACE2 and maximal acuity group during the 28-day period in COVID-19 positive and negative patients.
A. Plasma ACE2 and outcome group in COVID-19-positive patients. B. Plasma ACE2 and outcome group in COVID-19 negative patients. The acuity group is the maximum acuity group during the 28-day period with death being the maximum possible. A1 = Death within 28 days. A2 = Intubated, ventilated, survived to 28 days. A3 = Hospitalized, supplementary O2 required. A4 = Hospitalized, no supplementary O2 required. A5 = Discharged directly from ED and not subsequently hospitalized within 28 days. Data were analyzed using the Mann Whitney test. Bars indicate median and interquartile range. **** P < 0.0001. ns = not significant.

References

    1. Cummings MJ, Baldwin MR, Abrams D, Jacobson SD, Meyer BJ, Balough EM, et al.. Epidemiology, clinical course, and outcomes of critically ill adults with COVID-19 in New York City: a prospective cohort study. Lancet. 2020;395(10239):1763–70. doi: 10.1016/S0140-6736(20)31189-2 - DOI - PMC - PubMed
    1. Banerjee A, Pasea L, Harris S, Gonzalez-Izquierdo A, Torralbo A, Shallcross L, et al.. Estimating excess 1-year mortality associated with the COVID-19 pandemic according to underlying conditions and age: a population-based cohort study. Lancet. 2020;395(10238):1715–25. doi: 10.1016/S0140-6736(20)30854-0 - DOI - PMC - PubMed
    1. Zhou F, Yu T, Du R, Fan G, Liu Y, Liu Z, et al.. Clinical course and risk factors for mortality of adult inpatients with COVID-19 in Wuhan, China: a retrospective cohort study. Lancet. 2020;395(10229):1054–62. doi: 10.1016/S0140-6736(20)30566-3 - DOI - PMC - PubMed
    1. Zhou P, Yang XL, Wang XG, Hu B, Zhang L, Zhang W, et al.. A pneumonia outbreak associated with a new coronavirus of probable bat origin. Nature. 2020;579(7798):270–3. doi: 10.1038/s41586-020-2012-7 - DOI - PMC - PubMed
    1. Wan Y, Shang J, Graham R, Baric RS, Li F. Receptor Recognition by the Novel Coronavirus from Wuhan: an Analysis Based on Decade-Long Structural Studies of SARS Coronavirus. J Virol. 2020;94(7). doi: 10.1128/JVI.00127-20 - DOI - PMC - PubMed

Publication types

Substances