. 2021 Dec 30;138(26):2768-2780.
doi: 10.1182/blood.2021011192.

CRISPR-targeted MAGT1 insertion restores XMEN patient hematopoietic stem cells and lymphocytes

Affiliations

CRISPR-targeted MAGT1 insertion restores XMEN patient hematopoietic stem cells and lymphocytes

Julie Brault et al. Blood. .

Abstract

XMEN disease, defined as "X-linked MAGT1 deficiency with increased susceptibility to Epstein-Barr virus infection and N-linked glycosylation defect," is a recently described primary immunodeficiency marked by defective T cells and natural killer (NK) cells. Unfortunately, a potentially curative hematopoietic stem cell transplantation is associated with high mortality rates. We sought to develop an ex vivo targeted gene therapy approach for patients with XMEN using a CRISPR/Cas9 adeno-associated vector (AAV) to insert a therapeutic MAGT1 gene at the constitutive locus under the regulation of the endogenous promoter. Clinical translation of CRISPR/Cas9 AAV-targeted gene editing (GE) is hampered by low engraftable gene-edited hematopoietic stem and progenitor cells (HSPCs). Here, we optimized GE conditions by transient enhancement of homology-directed repair while suppressing AAV-associated DNA damage response to achieve highly efficient (>60%) genetic correction in engrafting XMEN HSPCs in transplanted mice. Restored MAGT1 glycosylation function in human NK and CD8+ T cells restored NK group 2 member D (NKG2D) expression and function in XMEN lymphocytes for potential treatment of infections, and it corrected HSPCs for long-term gene therapy, thus offering 2 efficient therapeutic options for XMEN poised for clinical translation.


Figures

None
Graphical abstract
Figure 1.
Figure 1.
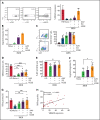
Design of rAAV6-MAGT1 donor for CRISPR/Cas9 targeted integration into XMEN CD34+ HSPCs. (A) Location of the 10-candidate sgRNAs targeting MAGT1 gene transcription start site. Each sgRNA (sg) is represented as a 20-bp sequence (light pink or green) associated with the 3-bp protospacer adjacent motif sequence (darker color). (B) Evaluation of the percentage of cutting activity by tracking of indels by decomposition (TIDE) assay of indel formation after guide DNA (gDNA) extraction from untreated vs Cas9/sgRNA-treated HD CD34+ cells at 5 days post-electroporation (EP), sequencing of exon 1, and comparison of the sequences using TIDE software (data represent 1-5 independent experiments ). (C) Design of the rAAV6-MAGT1 donor. (D) Molecular analysis showing the percentage of TIs in gene-edited CD34+ cells (3 different donors, 2 HDs and XMEN patient 1) using GE enhancers as described. gDNA was extracted at 5 days post-EP, and insertion of the MAGT1 cDNA donor was quantified by droplet digital PCR (ddPCR) (4 independent experiments for –i53, 7 for +i53, and 7 for +i53+hGSE). (E) Viability was determined by trypan blue exclusion in naive and rAAV6-MAGT1–treated HSPCs at day 2 post-EP (5 independent experiments for –i53, 10 for +i53, and 10 for +i53+hGSE). (F) Bar graphs of HSPC subpopulations (multilymphoid progenitor [MLP], CD34+CD38+CD45RA; common myeloid progenitor [CMP], CD34+CD38+CD45RA; HSCs, CD34+CD38CD45RACD90+CD133+; and multipotential progenitor [MPP], CD34+CD38CD45RACD90]) 2 days EP (data represent 4 independent experiments for –i53, 4 for +i53, and 7 for +i53+hGSE), compared with naive cells. Data are shown as mean ± standard deviation (SD); analysis of variance (ANOVA) 1-way test and Tukey’s post hoc multiple comparisons test were used. *P < .05; **P < .01; ***P < .001; ****P < .0001. Fwd, forward; ITR, inverted terminal repeat; ns, nonsignificant; LHA, left homology arm; polyA, poly(A) tail; RHA, right homology arm; Rev, reverse; WPRE, woodchuck hepatitis virus posttranscriptional regulatory element.
Figure 2.
Figure 2.
Effect of hGSE mRNA on DDR after GE with AAV. (A) Representative flow cytometric dot plots showing γH2AX expression in CD34+ cells (naive, AAV alone without Cas9/sgRNA-induced DSB, Cas9/sgRNA-induced DSB + AAV) 2 hours after treatment. (B) Histogram summarizing the percentages of γH2AX+ marker in the conditions indicated at 24 hours (h) after DSB induced by Cas9/sgRNA (data represent 2-7 independent experiments). (C) Evolution of percentages of γH2AX+ cells after 48 to 96 hours after treatment (data represent 2-7 independent experiments). Paired sample Student t test was used to compare the proportion of positive cells at 24 and 48 hours. (D) Percentage of CD34+ cells in G1, S, or G2/M cell cycle phases at 24 and 48 hours after treatment. Significance compared with naive condition is indicated. (E) Histograms summarizing the percentages of cleaved poly(ADP-ribose) polymerase (c-PARP)+ cells, a marker of apoptosis, at 24 hours in the conditions indicated (data are representative of 3 independent experiments). (F) Proliferation index (FlowJo software) comparing carboxyfluorescein succinimidyl ester (CFSE)–stained HSPCs at day 1 and day 6 post-EP (data are representative of 3 independent experiments). Data are shown as mean ± SD. ANOVA 1-way test and Tukey’s post hoc multiple comparisons test were used. *P < .05; **P < .01; ***P < .001; ****P < .0001. SSC, side scatter.
Figure 3.
Figure 3.
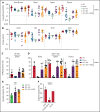
In vitro phenotypic and functional correction in immune cells after GE of XMEN CD34+ HSPCs. (A) Dot plots showing the gating strategy after in vitro T-cell differentiation of CD34+ cells using the ATO system; bar graph on the right shows NKG2D expression in CD3+ T cells at 6 weeks of differentiation (data are representative of 2-4 independent experiments; 300-20 000 events acquired in CD3+ gate). (B) Targeted integration measured by ddPCR analysis in ATO-derived cells at week 6 of in vitro differentiation (data are representative of 2 independent experiments). (C) Dot plot showing the gating for NK cells (CD3CD56+) and NKG2D expression after 35 days of in vitro NK-cell differentiation from CD34+ cells; bar graph shows the percentage of CD34-derived NK cells in each condition. (D) NKG2D expression (% positive cells), (E) level of expression determined as the percentage of mean fluorescence intensity (MFI) of HD NK cells, and (F) targeted integration by ddPCR analysis in NK cells at day 35 of in vitro differentiation (4 independent experiments for –i53, 5 for +i53, and 8 for +i53+hGSE). (G) Cytotoxic activity of CD34+-differentiated NK cells against K562 cells at an effector:target ratio of 2:1 (4 independent experiments for –i53, 9 for +i53, and 8 for +i53+hGSE). (H) Correlation between the NKG2D expression (%) and the killing activity (%) in NK cells at day 35 was calculated using Spearman’s correlation coefficient and 2-tailed P value (n = 33 pairs). Data are shown as mean ± SD. *P < .05; **P < .01; ***P < .001; ****P < .0001. FSC, forward scatter.
Figure 4.
Figure 4.
Hematopoietic reconstitution of gene-edited HSPCs in immunodeficient mice. (A) Human engraftment measured by the presence of human CD45+ cells by flow cytometry at week 16 in the BM, PB, spleen, and thymus of NSGS mice transplanted with HD, naive (n = 15 mice), or gene-edited XMEN CD34+ HSPCs (n = 3 mice [–i53, 2 experiments], 12 mice [+i53, 5 experiments], and 24 mice [+i53+hGSE, 4 experiments]). The dotted line indicates the threshold for engraftment at 0.2% hCD45+ cells in the BM. (B) Immunophenotypic analysis of BM at 16 weeks posttransplant by flow cytometry showing the percentages of CD34+ cells, myeloid (CD33+), lymphoid B (CD19+), and T (CD3+) after gating on the hCD45+ population. (C-D) Percentage of NKG2D expression in NK cells from the spleen (C) and CD8+ T cells from the PB (D), spleen, and thymus at week 16 posttransplant. (E) Targeted insertion quantified by ddPCR in human CD45+ cells isolated from the BM after GE without enhancers (red bar), with i53 (blue bar), or with i53+hGSE (green bar); BM from the mice injected with the same cells were pooled. (F) Targeted insertion quantified by ddPCR in the lymphoid T (CD3), myeloid (CD33/CD14), and lymphoid B (CD19) cells sorted from the spleen after GE with i53+hGSE. Data are shown as mean ± SD.
Figure 5.
Figure 5.
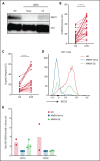
GE in XMEN T cells. (A) Representative western blot for MAGT1 protein expression in HD XMEN (naive and gene edited) T cells with β-actin as loading control. (B) Percentage of NKG2D-positive CD8+ T cells in AAV-treated T cells at days 2 and 35 post-EP (data are representative of 8 independent experiments; XMEN patients P1 and P2). (C) Targeted insertion rates measured at day 2 and day 35 post-EP (data are representative of 8 independent experiments). (D) Representative flow cytometry histogram overlaying NKG2D expression in HD and XMEN (naive and gene-edited) T cells at day 35 after GE. Percentage of NKG2D+ in gene-edited CD8+ XMEN T cells was 57.5% and TI was 64.6%. (E) Expression of CD70 and CD28 by flow cytometry for HD and XMEN (naive and gene-edited) T cells at day 28 post-EP; data are expressed as the ratio of MFI normalized to XMEN untreated cells for CD70 and CD28 (data are representative of 2-3 independent experiments). A paired sample Student t test was used. ***P < .001; ****P < .0001.
Figure 6.
Figure 6.
Analysis of OT activity. (A) Manhattan plot showing the results of off-targets for CD34+ cells by CHANGE-seq assay using gDNA extracted from HD male donor CD34+ cells electroporated with Cas9 mRNA and sgRNA#1. The brown arrow indicates the on-target site (MAGT1 gene) on chromosome X. (B) Table reporting the total number (nb) of cleavage sites (on- and off-targets) and the specificity ratio using male and female HD HSPCs or HD peripheral blood mononuclear cells (PBMCs). (C) Pie charts showing fraction of cleavage sites categorized according to their genomic features after CD34+ cells from HD male and female donors were edited. (D) Identity of the nucleotide mismatches at the OT sites. ON indicates the on-target site without mismatch, whereas OT1-OT8 indicate the top 8 OT sites shared by male and female HD CD34+ HSPCs and HD PBMCs. (E) Percentage of cutting activity evaluated by sequencing at ON and OT sites detected by CHANGE-Seq in in vitro (CD34+ cells 2 days after gene editing) and in vivo (hCD45+ cells from the BM of NSGS mice that had received a transplant at week 16 posttransplant) samples. For all the graphs, data are shown as mean ± SD.

Comment in

  • Is this a cure for XMEN?
    Torgerson TR. Torgerson TR. Blood. 2021 Dec 30;138(26):2743-2744. doi: 10.1182/blood.2021012755. Blood. 2021. PMID: 34967867 No abstract available.

References

    1. Blommaert E, Péanne R, Cherepanova NA, et al. . Mutations in MAGT1 lead to a glycosylation disorder with a variable phenotype. Proc Natl Acad Sci U S A. 2019;116(20):9865-9870. - PMC - PubMed
    1. Matsuda-Lennikov M, Biancalana M, Zou J, et al. . Magnesium transporter 1 (MAGT1) deficiency causes selective defects in N-linked glycosylation and expression of immune-response genes. J Biol Chem. 2019;294(37):13638-13656. - PMC - PubMed
    1. Ravell JC, Matsuda-Lennikov M, Chauvin SD, et al. . Defective glycosylation and multisystem abnormalities characterize the primary immunodeficiency XMEN disease. J Clin Invest. 2020;130(1):507-522. - PMC - PubMed
    1. Li FY, Chaigne-Delalande B, Su H, Uzel G, Matthews H, Lenardo MJ. XMEN disease: a new primary immunodeficiency affecting Mg2+ regulation of immunity against Epstein-Barr virus. Blood. 2014;123(14):2148-2152. - PMC - PubMed
    1. Ravell J, Chaigne-Delalande B, Lenardo M. X-linked immunodeficiency with magnesium defect, Epstein-Barr virus infection, and neoplasia disease: a combined immune deficiency with magnesium defect. Curr Opin Pediatr. 2014;26(6):713-719. - PMC - PubMed

Publication types

MeSH terms

Substances