. 2021 Jul 2;49(W1):W317-W325.
doi: 10.1093/nar/gkab447.

KOBAS-i: intelligent prioritization and exploratory visualization of biological functions for gene enrichment analysis

Affiliations

KOBAS-i: intelligent prioritization and exploratory visualization of biological functions for gene enrichment analysis

Dechao Bu et al. Nucleic Acids Res. .

Abstract

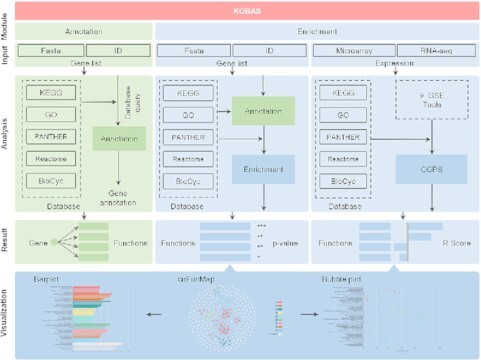
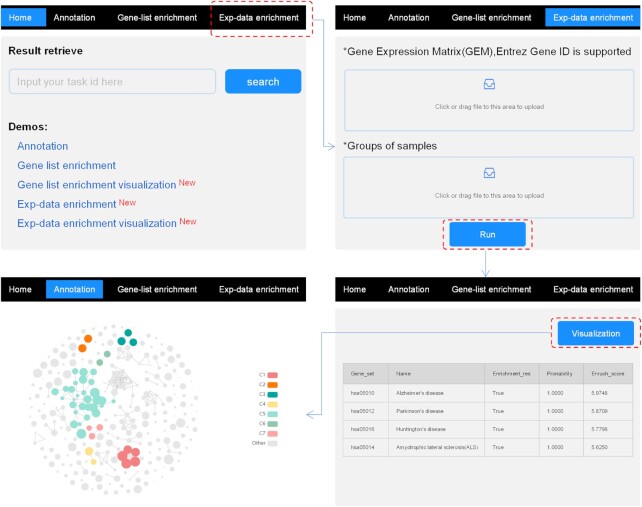
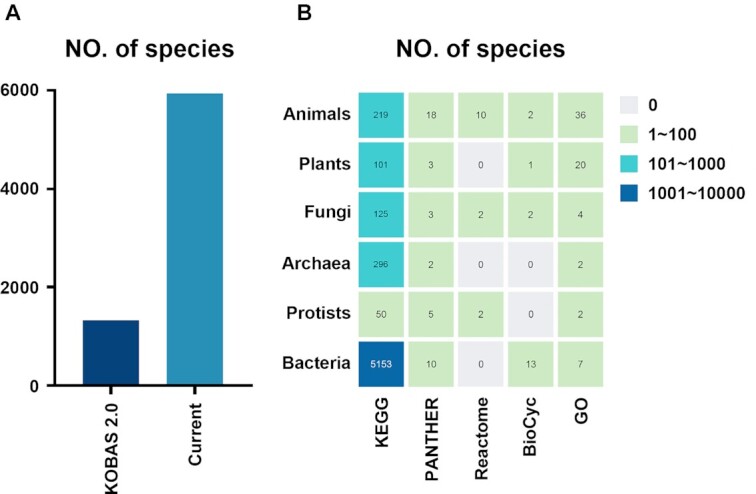
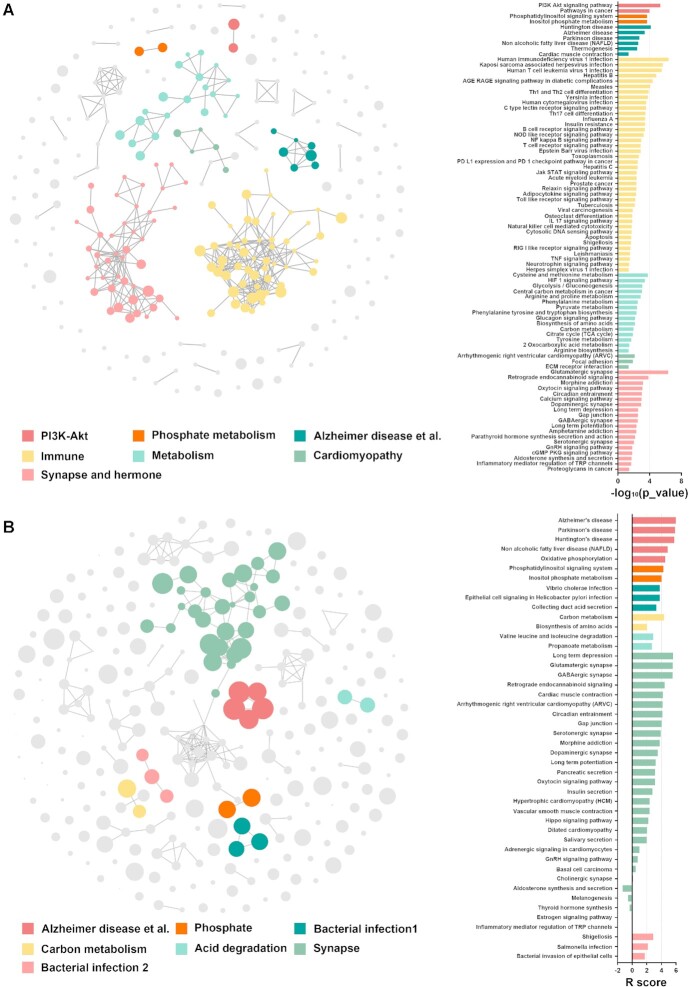
Gene set enrichment (GSE) analysis plays an essential role in extracting biological insight from genome-scale experiments. ORA (overrepresentation analysis), FCS (functional class scoring), and PT (pathway topology) approaches are three generations of GSE methods along the timeline of development. Previous versions of KOBAS provided services based on just the ORA method. Here we presented version 3.0 of KOBAS, which is named KOBAS-i (short for KOBAS intelligent version). It introduced a novel machine learning-based method we published earlier, CGPS, which incorporates seven FCS tools and two PT tools into a single ensemble score and intelligently prioritizes the relevant biological pathways. In addition, KOBAS has expanded the downstream exploratory visualization for selecting and understanding the enriched results. The tool constructs a novel view of cirFunMap, which presents different enriched terms and their correlations in a landscape. Finally, based on the previous version's framework, KOBAS increased the number of supported species from 1327 to 5944. For an easier local run, it also provides a prebuilt Docker image that requires no installation, as a supplementary to the source code version. KOBAS can be freely accessed at http://kobas.cbi.pku.edu.cn, and a mirror site is available at http://bioinfo.org/kobas.


Figures

Graphical Abstract
Graphical Abstract
Framework of KOBAS.
Figure 1.
Figure 1.
Framework of KOBAS. KOBAS consists of two parts called the ‘annotation module’ and the ‘enrichment module’. The GSE analysis is performed on a gene-list or expression input, and the output enrichment results can be viewed by visualization.
Figure 2.
Figure 2.
Online operation flow for running analysis of exp-data enrichment. Click ‘exp-data enrichment’ on top of the homepage, then upload the expression profile and group information to start an analysis. After obtaining the enrichment results, click the ‘visualization’ button to browse the cirFunMap.
Figure 3.
Figure 3.
Pathway and GO databases supported by KOBAS. (A) Number of supported species in KOBAS 2.0 and current KOBAS. (B) Number of supported species with pathway and GO annotations in different species classes.
Figure 4.
Figure 4.
cirFunMap visualization of two demo enrichment results. (A) cirFunMap visualization of gene-list enrichment results. Left is the circular network view; the node color represents different clusters; the node size represents six levels of P-value, node size from small to large: [0.05,1], [0.01,0.05), [0.001,0.01), [0.0001,0.001), [1e-10,0.0001), [0,1e-10); the edge represents correlations larger than the user-defined threshold (0.35 in the demo). Right is the barplot of the P-value for terms in different clusters. (B) cirFunMap visualization of exp-data enrichment results. Left is the circular network view; the node color represents different clusters; the node size is linearly positively correlated with the R score; the edge represents correlations greater than the user-defined threshold (0.25 in the demo). Right is the barplot of the R score for terms in different clusters, while R score is a measure of relevance for a gene set to an experimental condition.

References

    1. Khatri P., Sirota M., Butte A.J.. Ten years of pathway analysis: current approaches and outstanding challenges. PLoS Comput. Biol. 2012; 8:e1002375. - PMC - PubMed
    1. Wu J., Mao X., Cai T., Luo J., Wei L.. KOBAS server: a web-based platform for automated annotation and pathway identification. Nucleic Acids Res. 2006; 34:720–724. - PMC - PubMed
    1. Huang da W., Sherman B.T., Lempicki R.A.. Bioinformatics enrichment tools: paths toward the comprehensive functional analysis of large gene lists. Nucleic Acids Res. 2009; 37:1–13. - PMC - PubMed
    1. Yu G., Wang L.G., Han Y., He Q.Y.. clusterProfiler: an R package for comparing biological themes among gene clusters. Omics. 2012; 16:284–287. - PMC - PubMed
    1. Raudvere U., Kolberg L., Kuzmin I., Arak T., Adler P., Peterson H., Vilo J.. g:Profiler: a web server for functional enrichment analysis and conversions of gene lists (2019 update). Nucleic Acids Res. 2019; 47:W191–W198. - PMC - PubMed

Publication types