. 2021 Jul 26;31(14):3185-3191.e3.
doi: 10.1016/j.cub.2021.05.006. Epub 2021 Jun 3.

Serial dependence revealed in history-dependent perceptual templates

Affiliations

Serial dependence revealed in history-dependent perceptual templates

Yuki Murai et al. Curr Biol. .

Abstract

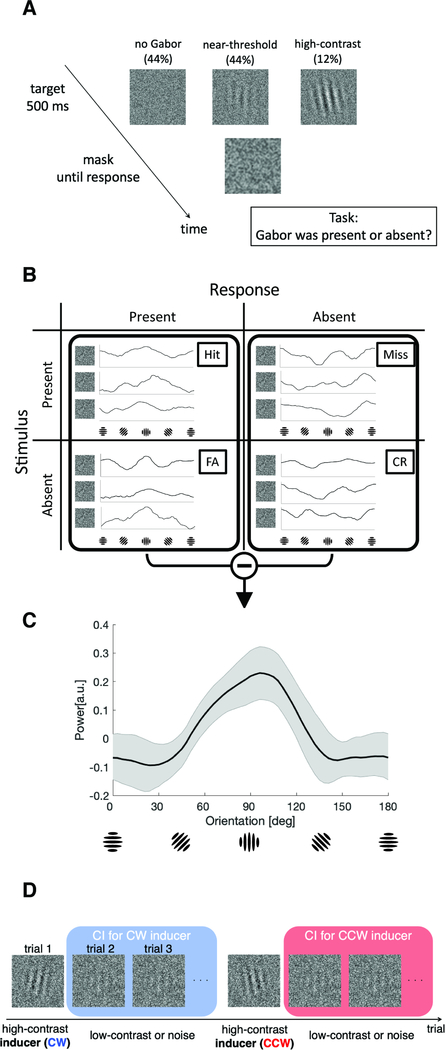
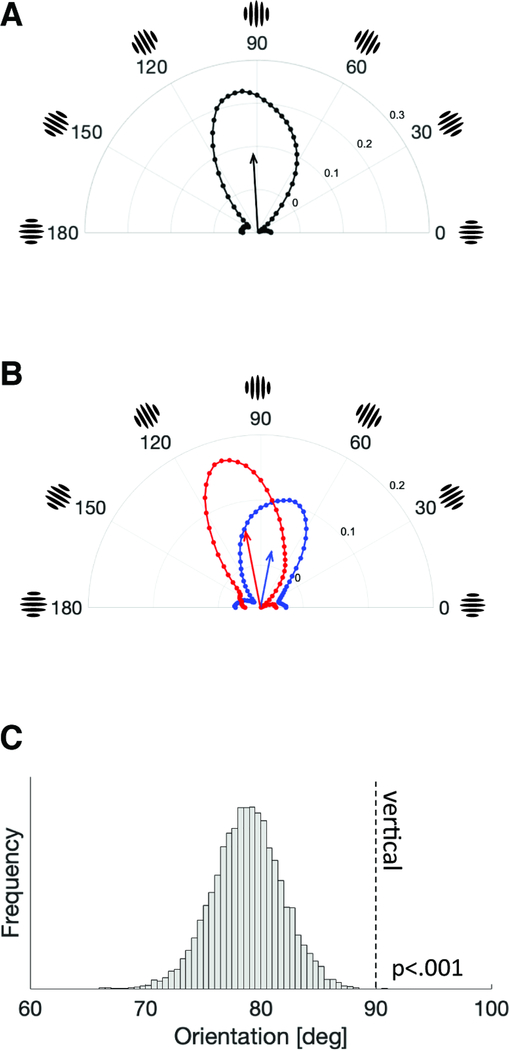
In any given perceptual task, the visual system selectively weighs or filters incoming information. The particular set of weights or filters form a kind of template, which reveals the regions or types of information that are particularly useful for a given perceptual decision.1,2 Unfortunately, sensory input is noisy and ever changing. To compensate for these fluctuations, the visual system could adopt a strategy of biasing the templates such that they reflect a temporal smoothing of input, which would be a form of serial dependence.3-5 Here, we demonstrate that perceptual templates are, in fact, altered by serial dependence. Using a simple orientation detection task and classification-image technique, we found that perceptual templates are systematically biased toward previously seen, task-irrelevant orientations. The results of an orientation discrimination task suggest that this shift in perceptual template derives from a change in the perceptual appearance of orientation. Our study reveals how serial dependence biases internal templates of orientation and suggests that the sensitivity of classification-image techniques in general could be improved by taking into account history-dependent fluctuations in templates.

Keywords: classification image; orientation; serial dependence; visual perception.


Conflict of interest statement

Declaration of interests The authors declare no competing interests.

Figures

Figure 1.
Figure 1.. Schematics of the first (detection) experiment.
(A) In each trial, the participants judged whether a Gabor stimulus was present or absent in a noisy image. In 44% of the trials, a near-threshold Gabor was embedded in a white noise stimulus. In another 44% of the trials, the white noise was presented on its own, without any Gabor. In the remaining 12% of the trials, a high-contrast Gabor was presented to induce serial dependence. (B) Trials were classified into 4 categories based on stimulus presence and the subject’s response. Each noise image (excluding all Gabor signal information) was Fourier-transformed and the power of each orientation was calculated. The orientation power is graphed here for twelve example noise stimuli: only the noise was included in this analysis; the signal Gabor orientation was removed. (C) The classification image (CI) was obtained by subtracting the mean power distribution for “absent” response trials (Miss and Correct Rejection [CR]) from the mean power distribution for “present” response trials (Hit and False Alarm [FA]). This group-averaged CI is tuned toward vertical orientations and has a vector average that is not significantly different from vertical (mean = 92.5, p = .75). (D) To estimate how the inducers might distort the classification image in subsequent trials, CIs were estimated separately for trials following clockwise (CW) and counterclockwise (CCW) inducers. The inter-inducer interval was 5–11 trials, roughly 8–20 seconds in time.
Figure 2.
Figure 2.. Perceptual template of orientation is biased toward prior orientation.
(A) The group-averaged classification image for all the trials, which is replotted from Figure 1c. The angle represents the orientation, and the radius represents the power of each orientation in the classification image (arbitrary unit). The black arrow indicates the mean vector of the orientation vectors in the classification image (approximately vertical). (B) The classification image for trials following CW (blue) and CCW (red) inducers. The arrows represent the mean vectors for each classification image. In the analysis, the CCW curve was flipped and merged with the CW curve, and the mean vector was calculated for this integrated classification image. (C) The histogram of the bootstrapped mean vector angles for the integrated classification image, indicating that the CI was biased toward previous inducer orientations (p<.001). See also Figure S1.
Figure 3.
Figure 3.. Schematics of the second (discrimination) experiment.
(A) In a trial, the participants judged whether the Gabor was (1) absent, (2) present and tilted CW, or (3) present and tilted CCW. In 44% of the trials, a near-threshold Gabor was embedded in a white noise stimulus. In another 44% of the trials, the white noise was presented on its own, without any Gabor. In the remaining 12% of the trials, a high-contrast Gabor was presented to induce serial dependence. (B) Psychometric functions were estimated separately for trials following CW and CCW inducers. (C) A hypothetical visualization showing how the response bias and perceptual shift could affect psychometric functions differently.
Figure 4.
Figure 4.. Serial dependence attracts the current perception toward prior inputs.
(Left panel) The psychometric functions of a representative participant for trials following CW (blue) and CCW (red) inducers in the discrimination experiment. (Right panel) Group average of point of subjective equality (PSE) to vertical orientation. The significant difference between the PSEs (p<.001), indicates that prior orientation information attracted the observers’ percepts of what counted as vertical.

Similar articles

Cited by

References

    1. Murray RF (2011). Classification images: A review. J. Vis. 11. - PubMed
    1. Eckstein MP, and Ahumada AJ Jr (2002). Classification images: a tool to analyze visual strategies. J. Vis. 2, 121–131. - PubMed
    1. Fischer J, and Whitney D (2014). Serial dependence in visual perception. Nat. Neurosci. 17, 738–743. - PMC - PubMed
    1. Cicchini GM, Anobile G, and Burr DC (2014). Compressive mapping of number to space reflects dynamic encoding mechanisms, not static logarithmic transform. Proc. Natl. Acad. Sci. U. S. A. 111, 7867–7872. - PMC - PubMed
    1. Liberman A, Fischer J, and Whitney D (2014). Serial dependence in the perception of faces. Curr. Biol. 24, 2569–2574. - PMC - PubMed

Publication types