. 2021 Jun 14;39(6):779-792.e11.
doi: 10.1016/j.ccell.2021.05.002. Epub 2021 Jun 3.

Interactions between cancer cells and immune cells drive transitions to mesenchymal-like states in glioblastoma

Affiliations

Interactions between cancer cells and immune cells drive transitions to mesenchymal-like states in glioblastoma

Toshiro Hara et al. Cancer Cell. .

Erratum in

Abstract

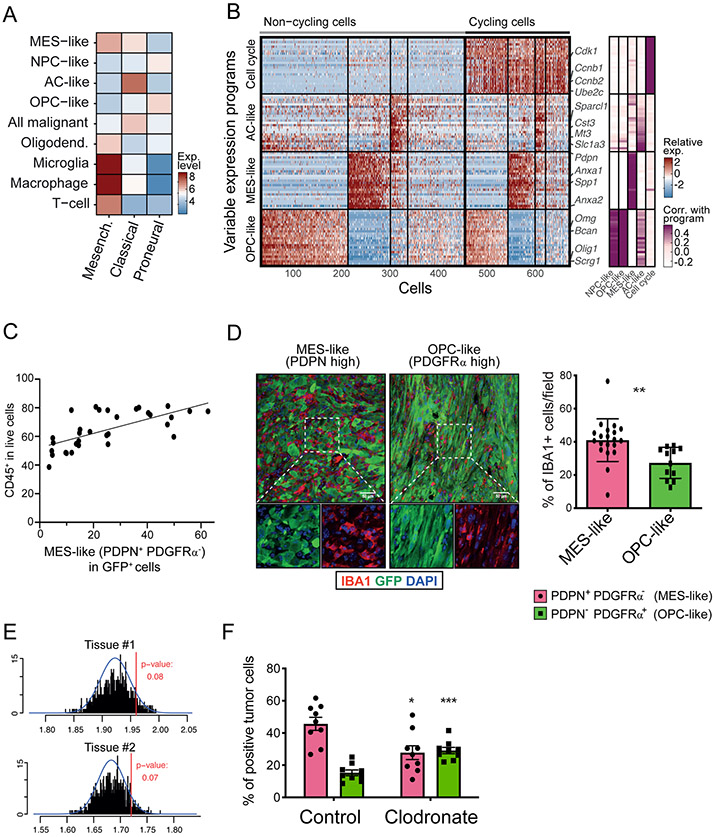
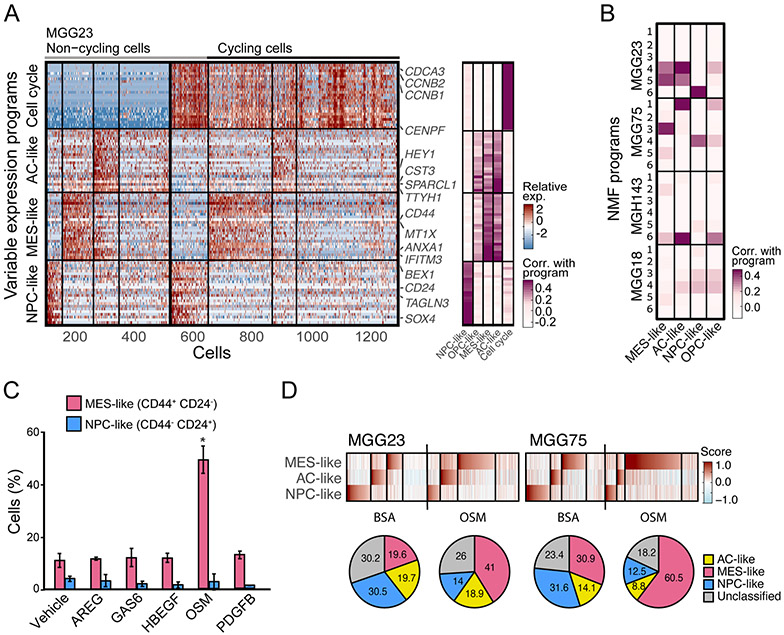
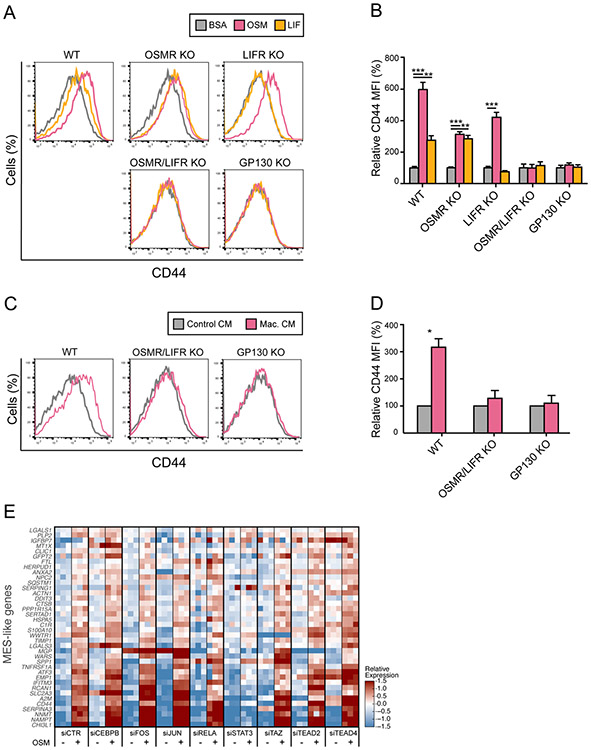
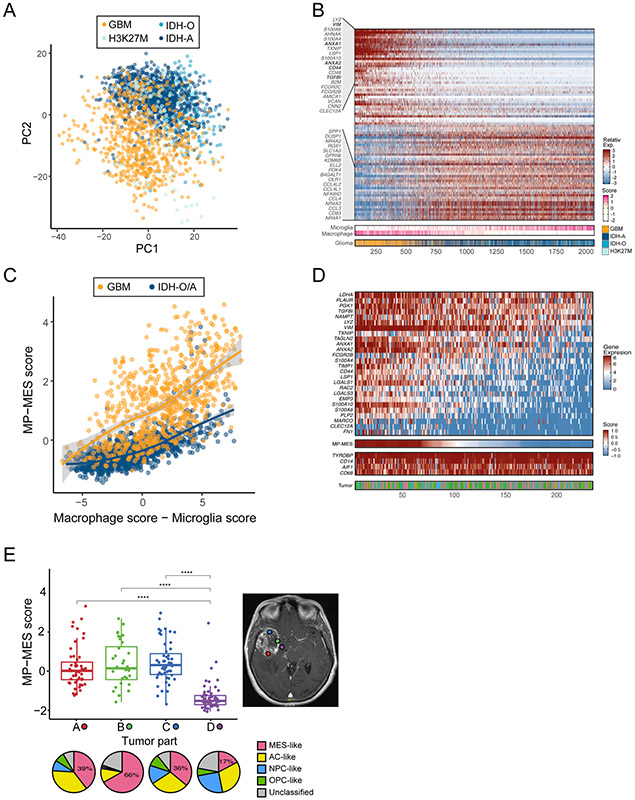
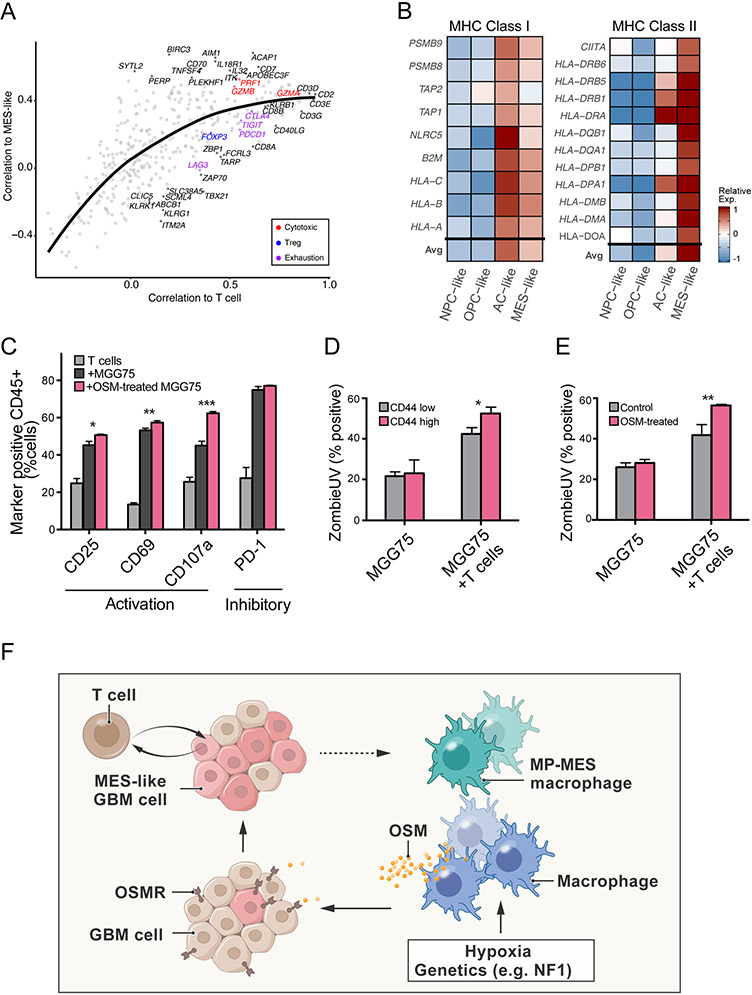
The mesenchymal subtype of glioblastoma is thought to be determined by both cancer cell-intrinsic alterations and extrinsic cellular interactions, but remains poorly understood. Here, we dissect glioblastoma-to-microenvironment interactions by single-cell RNA sequencing analysis of human tumors and model systems, combined with functional experiments. We demonstrate that macrophages induce a transition of glioblastoma cells into mesenchymal-like (MES-like) states. This effect is mediated, both in vitro and in vivo, by macrophage-derived oncostatin M (OSM) that interacts with its receptors (OSMR or LIFR) in complex with GP130 on glioblastoma cells and activates STAT3. We show that MES-like glioblastoma states are also associated with increased expression of a mesenchymal program in macrophages and with increased cytotoxicity of T cells, highlighting extensive alterations of the immune microenvironment with potential therapeutic implications.

Keywords: GBM; OSM; glioblastoma; macrophage; mesenchymal; scRNA-seq; tumor microenvironment.


Conflict of interest statement

Declaration of interests M.L.S. and K.W.W. are equity holders, scientific co-founders, and advisory board members of Immunitas Therapeutics. I.T. is advisory board member of Immunitas Therapeutics. A.R. is a founder and equity holder of Celsius Therapeutics, an equity holder in Immunitas Therapeutics, and until July 31, 2020, was an SAB member for Thermo Fisher Scientific, Syros Pharmaceuticals, Asimov and Neogene Therapeutics. O.R.R. and A.R. are employees of Genentech since October 19, 2020, and August 1, 2020, respectively. K.W.W. serves on the scientific advisory board of TCR2 Therapeutics, T-Scan Therapeutics, SQZ Biotech, and Nextechinvest, and receives sponsored research funding from Novartis. N.D.M. serves as a scientific advisor to Immunitas Therapeutics. X.Z. is a co-founder and consultant for Vizgen, Inc.

Figures

Figure 1:
Figure 1:. Macrophages induce transition of cancer cells into a MES-like state.
(A) Heatmap shows the average expression of the three TCGA signatures (Mesenchymal, Classical, and Proneural) in different cell types in human glioblastoma scRNA-seq, including the four GBM cell states: neural-progenitor-like (NPC-like), oligodendrocyte-progenitor-like (OPC-like), astrocyte-like (AC-like), and mesenchymal-like (MES-like). (B) Programs of heterogeneity identified using NMF in a mouse model of glioblastoma. Left panel: heatmap shows relative expression of genes from four programs across all cells. Cells are ordered in three subsequent steps by their score for the cell cycle, OPC-like, MES-like and AC-like programs; first, cells are separated into cycling and non-cycling; Second, cells within each group are further separated by the identity of the highest-scoring program, or defined as having no high-scoring program; Third, the cells with the same highest-scoring program are further sorted by their score for that program. Selected genes are indicated. Right panel: gene’s correlations to the corresponding human glioblastoma programs. (C) Quantification of the fraction of immune cells (CD45+) cells and MES-like (PDPN+ PDGFRα) glioblastoma (GFP+) cells in each tumor (32 mouse glioblastoma samples). Pearson correlation is indicated between percentage of CD45+ cells and that of PDPN+ PDGFRα cells, Pearson’r=0.6747, p<0.0001. (D) Left: Representative immunofluorescence (IF) staining of a MES-like, defined as PDPN+ PDGFRα (left), and an OPC-like, defined as PDPN PDGFRα+(right) tumor fields, stained for markers for macrophages (IBA1, red), cancer cells (GFP, green) and nuclei (DAPI, blue). See Figure S1D for details of PDPN and PDGFRα characterization. Scale bar, 50 μm. Right: Quantification of the fraction of macrophages (IBA1+) in tumor fields defined as being MES-high (based on PDPN staining) or OPC-high (based on PDGFRα staining). 8 mouse glioblastoma tissues were subjected to the analysis (PDPN; 20 regions, 1,4181 cells analyzed, PDGFRα; 12 regions, 6506 cells analyzed). Error-bars indicate Standard deviation (SD), and the difference between averages is significant by t-test (** denotes p<0.001). (E) Histogram showing observed mean number of macrophages in 30 nearest cells to each MES-like glioblastoma cell (red line) and distribution expected at random (black lines). Blue line shows the fitted normal distribution. Tumor section 1 shown on top and tumor section 2 shown on bottom (F) Fraction of MES-like (PDPN+ PDGFRα) and OPC-like (PDPN PDGFRα+) cells by flow cytometry, in liposome-PBS (control)-treated mice and mice injected with liposome-clodronate. Error bars indicate standard error of the mean (n=9 for each group), and the difference between averages is significant by t-test (PDPN group; * denotes p<0.0077, PDGFRα group;*** denotes p=0.0001). See also Figure S1 and Table S1.
Figure 2:
Figure 2:. Macrophage-secreted ligands as a driver of MES-like state.
(A) Average expression of each gene (dot) in glioblastoma malignant cells (x-axis) and macrophage cells (y-axis). Ligands expressed by macrophages (pink) with corresponding receptors expressed by malignant cells (cyan) are colored and labeled. (B) Correlation between the expression of receptors shown in (A) and the scores for 4 human glioblastoma cellular states (MES-like, AC-like, NPC-like, OPC-like) across the malignant cells in the human GBM scRNA-seq dataset (top) and across TCGA bulk-RNA seq (bottom). Error bars correspond to standard error, calculated by bootstrapping 500 cells (top) or 130 tumors (bottom) with 1000 iterations. (C) Fraction of MES-like (PDPN+ PDGFRα) and OPC-high (PDPN PDGFRα+) cells by flow cytometry in tumors of mice injected with cells overexpressing AREG, GAS6, HBEGF, OSM, or Luciferase as a control. Error bars indicate standard error of the mean (n=3 for each group), and the difference between averages is significant by t-test (* denotes p<0.05). See also Figure S2.
Figure 3:
Figure 3:. OSM-induced transition to MES-like state is recapitulated in human cells in vitro.
(A) Programs of heterogeneity identified using NMF in MGG23, a glioblastoma cell line grown as gliomaspheres. Right panel: heatmap shows relative expression of genes from four programs across all cells. Cells are ordered in three subsequent steps by their score for the cell cycle, NPC-like, MES-like and AC-like programs; first, cells are separated into cycling and non-cycling; Second, cells within each group are further separated by the identity of the highest-scoring program, or defined as having no high-scoring program; Third, the cells with the same highest-scoring program are further sorted by their score for that program Selected genes are indicated and labeled. Left panel: gene’s correlations with the corresponding human in vivo glioblastoma programs. (B) Comparison of the programs heterogeneity identified using NMF from the 4 cell lines profiled: MGG23, MGG75, MGH143, and MGG18. Heatmap shows each NMF program (6 per cell-line) correlations with the corresponding human in vivo glioblastoma programs (MES-like, AC-like, NPC-like, and OPC-like) (C) Fraction of MES-like (CD44+ CD24) and NPC-like (CD44 CD24+) cells by flow cytometry, in MGG23 cells treated with recombinant AREG, GAS6, HBEGF, OSM, PDGFB, or control. Error bars indicate standard deviation (n=3 for each group), and the difference between averages is significant by t-test (* denotes p=0.029). (D) ScRNA-seq of MGG23 (left) and MGG75 (right) after treatment with OSM or BSA. Heatmaps show cells from each experiment, ordered by their score for the different glioblastoma states. Pie charts below show the relative proportion of each cell state in corresponding heatmap. See also Figure S3 and Table S2.
Figure 4:
Figure 4:. OSM-induced transition of MES-like state is mediated by OSMR/LIFR
(A) Flow cytometry analysis of CD44 expression on MGG23 cells treated with OSM, LIF, or BSA, in wild-type cells (WT) and CRISPR knock-out of OSMR (OSMR KO), LIFR (LIFR KO), both OSMR and LIFR (OSMR/LIFR KO), and IL6ST (GP130 KO). (B) Quantification of mean fluorescence intensity (MFI) values in (A) reflecting CD44 expression on MGG23 cells treated with OSM, LIF or BSA, in WT, OSMR KO, LIFR KO, OSMR/LIFR KO and GP130 KO group, normalized by an averaged MFI of BSA-treated cells. Error bars indicate standard deviation (n=3 for each group), and the difference between averages is significant by t-test (** denotes p<0.001, *** denotes p<0.0001). (C) Flow cytometry analysis of CD44 expression on MGG23 cells treated with conditioned medium (CM) from human macrophage culture, in WT, OSMR/LIFR KO and GP130 KO group. (D) Quantification of MFI values in (C) reflecting CD44 expression on MGG23 cells treated with macrophage CM or control CM, in WT, OSMR/LIFR KO and GP130 KO group, normalized by an averaged MFI of control CM-treated cells. Error bars indicate standard deviation of means from three independent experiments, and the difference between averages is significant by t-test (* denotes p=0.0059). (E) MGG23 cells after knockdown of 8 different TFs (CEBPB, FOS, JUN, RELA, STAT3, WWTR1(TAZ), TEAD2, TEAD4) using siRNA were profiled by RNA-seq. Heatmap of relative expression of MES-like genes in bulk RNA-seq of MGG23 cells after knockdown of TFs and treatment with OSM or BSA, centered across all samples. See also Figure S4.
Figure 5:
Figure 5:. A mesenchymal state of glioblastoma-associated macrophages.
(A) PCA plot of myeloid cells from four glioma types (GBM for glioblastoma, IDH-mutant Astrocytoma and Oligodendroglioma, and H3K27M gliomas). (B) Heatmap of genes with top (positive and negative) loading scores in PC2, of which the top 40 are labeled. Cells are ordered by their expression of PC2-low genes. Lower panels indicate the glioma type and the score for the microglia and macrophage programs. (C) Myeloid cells MP-MES scores (Y-axis) and macrophage vs. microglia scores (X-axis). Colors distinguish GBM-derived cells from those of IDH-mutant tumors (Oligodendroglioma and Astrocytoma; IDH-O/A). Line indicates a LOESS regression. (D) The main heatmap (top) shows expression of the MP-MES program genes in macrophage-like cells in glioblastoma. Cells are ordered by their MP-MES scores, as shown in the lower panel. Additional lower panels show the expression of 4 housekeeping macrophage genes, and the tumor of origin (bottom). (E) Boxplots (the line in the box shows the median, the upper and lower borders of the box indicate the upper and lower quartile, lines below and above the box indicate the 5th and 95th percentiles, and all data points are shown) depict the MP-MES scores of macrophages from 4 different locations of glioblastoma tumor MGH105 (labeled by color on MRI, right). Pie charts below show the assignment of the malignant cells from each location to four states. Location D had the smallest percentage of MES-like malignant cells and a significantly lower macrophage MP-MES scores compared to locations A, B and C (**** denotes p<10−12 in three comparisons by t-test). See also figure S5 and Table S3.
Figure 6:
Figure 6:. MES-like states may be associated with T-cell activation.
(A) Scatter plot of 406 T-cell specific genes. Correlation of each gene’s expression to estimated T cell abundance, defined by genes (CD2, CD3D, CD3E, CD3G) (x-axis) and the correlation of each gene’s expression to the MES-like score (y-axis) in TCGA bulk RNA-seq. Line indicates a LOESS regression. Colors distinguish marker genes for T cell subtypes (Cytotoxic, Treg, Exhaustion). (B) Heatmap shows the relative average expression of MHC class I (left) and MHC class II (right) genes in simulated bulk profiles of NPC-like, OPC-like, AC-like, and MES-like cells. (C) Quantification of T cell activation markers (CD25 and CD69), a marker of T cell degranulation (CD107a) and an exhaustion marker PD-1 positive cells in CD45+ cells after 24 hours co-culture of engineered T cells with NY-ESO-1 expressing MGG75 cells pretreated with or without 20ng/mL of OSM. Error bars indicate standard deviation (n=3 for each group), and the difference between averages is significant by t-test (*p=0.011, **p=0.0083, ***p=0.0003). (D) Cellular viability of MGG75-NY-ESO-1 cells co-cultured with or without NY-ESO-1 TCR T cells. ZombieUV dye incorporation into CD44low and CD44high MGG75-NY-ESO-1 cells were measured by flow cytometry analysis after an 8 hours co-culture. Error bars indicate standard deviation (n=3 for each group), and the difference between averages is significant by t-test (*p=0.0124). (E) Cellular viability of NY-ESO-1 MGG75 cells pre-treated with or without 20 ng/mL of OSM for 24 hours, followed by co-culture with or without NY-ESO-1 TCR T cells. ZombieUV dye incorporation into CD45 negative MGG75-NY-ESO-1 cells were measured by flow cytometry analysis after an 8 hours co-culture. Error bars indicate standard deviation (n=3 for each group), and the difference between averages is significant by t-test (**p=0.00829). (F) Scheme explaining the establishment of a TCGA-MES tumor. An abundance of macrophages could be driven by tumor genetics, such as alterations of NF1 that promote macrophage recruitment, or by hypoxia and other aspects of the glioma microenvironment. Macrophage-derived OSM then induces a MES-like state of the glioblastoma cells. The MES-like glioblastoma cells and/or the associated microenvironment also facilitate a transition of macrophages into the MP-MES state through mechanisms that remain unclear. See also Figure S6 and Table S4.

Comment in

Similar articles

Cited by

References

    1. Beyer M, Mallmann MR, Xue J, Staratschek-Jox A, Vorholt D, Krebs W, Sommer D, Sander J, Mertens C, Nino-Castro A, et al. (2012). High-resolution transcriptome of human macrophages. PLoS One 7, e45466. - PMC - PubMed
    1. Bhat KP, Balasubramaniyan V, Vaillant B, Ezhilarasan R, Hummelink K, Hollingsworth F, Wani K, Heathcock L, James JD, Goodman LD, et al. (2013). Mesenchymal differentiation mediated by NF-kappaB promotes radiation resistance in glioblastoma. Cancer cell 24, 331–346. - PMC - PubMed
    1. Bhat KP, Salazar KL, Balasubramaniyan V, Wani K, Heathcock L, Hollingsworth F, James JD, Gumin J, Diefes KL, Kim SH, et al. (2011). The transcriptional coactivator TAZ regulates mesenchymal differentiation in malignant glioma. Genes & development 25, 2594–2609. - PMC - PubMed
    1. Butowski N, Colman H, De Groot JF, Omuro AM, Nayak L, Wen PY, Cloughesy TF, Marimuthu A, Haidar S, Perry A, et al. (2016). Orally administered colony stimulating factor 1 receptor inhibitor PLX3397 in recurrent glioblastoma: an Ivy Foundation Early Phase Clinical Trials Consortium phase II study. Neuro-oncology 18, 557–564. - PMC - PubMed
    1. Carro MS, Lim WK, Alvarez MJ, Bollo RJ, Zhao X, Snyder EY, Sulman EP, Anne SL, Doetsch F, Colman H, et al. (2010). The transcriptional network for mesenchymal transformation of brain tumours. Nature 463, 318–325. - PMC - PubMed

Publication types

MeSH terms