. 2021 Jul 6;120(13):2734-2745.
doi: 10.1016/j.bpj.2021.05.014. Epub 2021 Jun 2.

Roles of Fe-Histidine bonds in stability of hemoglobin: Recognition of protein flexibility by Q Sepharose

Affiliations

Roles of Fe-Histidine bonds in stability of hemoglobin: Recognition of protein flexibility by Q Sepharose

Shigenori Nagatomo et al. Biophys J. .

Abstract

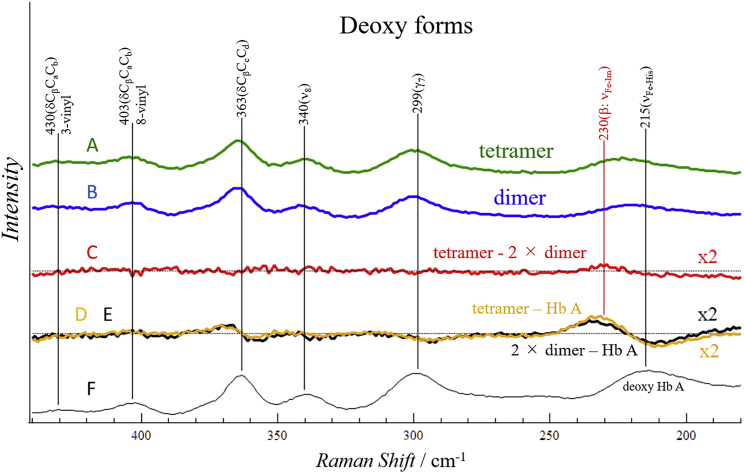
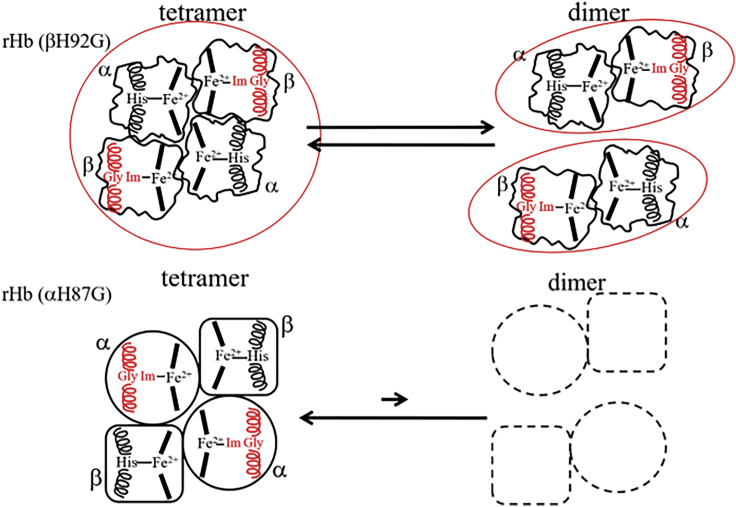
Using various mutants, we investigated to date the roles of the Fe-histidine (F8) bonds in cooperative O2 binding of human hemoglobin (Hb) and differences in roles between α- and β-subunits in the α2β2 tetramer. An Hb variant with a mutation in the heme cavity exhibited an unexpected feature. When the β mutant rHb (βH92G), in which the proximal histidine (His F8) of the β-subunit is replaced by glycine (Gly), was subjected to ion-exchange chromatography (Q Sepharose column) and eluted with an NaCl concentration gradient in the presence of imidazole, yielded two large peaks, whereas the corresponding α-mutant, rHb (αH87G), gave a single peak similar to Hb A. The β-mutant rHb proteins under each peak had identical isoelectric points according to isoelectric focusing electrophoresis. Proteins under each peak were further characterized by Sephadex G-75 gel filtration, far-UV CD, 1H NMR, and resonance Raman spectroscopy. We found that rHb (βH92G) exists as a mixture of αβ-dimers and α2β2 tetramers, and that hemes are released from β-subunits in a fraction of the dimers. An approximate amount of released hemes were estimated to be as large as 30% with Raman relative intensities. It is stressed that Q Sepharose columns can distinguish differences in structural flexibility of proteins having identical isoelectric points by altering the exit rates from the porous beads. Thus, the role of Fe-His (F8) bonds in stabilizing the Hb tetramer first described by Barrick et al. was confirmed in this study. In addition, it was found in this study that a specific Fe-His bond in the β-subunit minimizes globin structural flexibility.


Figures

Figure 1
Figure 1
Relationships between heme and helix F (blue ribbon) of the β-subunits in Hb A (right) and rHb (βH92G) (left). As normal β-subunits of Hb A have Fe-His bonds, there is a covalent linkage between the Im ring of β92His and helix F. Although the β-subunits of rHb (βH92G) have Fe-Im (Im) bonds, there is no covalent linkage between the Im ring and helix F. The molecular structure of Hb A is taken from PDB: 2DN2 (20), and that of rHb (βH92G) is shown by in silico mutagenesis of PDB: 2DN2 (20). To see this figure in color, go online.
Figure 2
Figure 2
rHb purification using a two-step Q Sepharose column chromatography protocol. Left: Q1 column equilibrated at pH 7.4. Hb does not bind, but E. coli-derived proteins and DNA fragments do. Right: Q2 column equilibrated at pH 8.3. rHb and Hb A typically bind, but other proteins such as lysozyme do not. The rHb and Hb A bound to the Q2 column are eluted with an increasing concentration gradient of NaCl. The NaCl solution for eluting samples of rHb (αH87G) and rHb (βH92G) contains 10 mM Im. The Q1 eluate is loaded onto the Q2 column. To see this figure in color, go online.
Figure 3
Figure 3
Elution patterns of rHb (αH87G) and rHb (βH92G) in Q2 Sepharose column chromatography. The black dotted line in each elution pattern shows the NaCl concentration gradient (0–0.16 M). The column (1.5 × 17 cm) was equilibrated with 20 mM Tris-HCl buffer (pH 8.3) containing 10 mM Im. After the Q2 column was loaded with the Q1 eluate and washed with equilibration buffer, bound Hb was eluted with a linear gradient (total 300 mL) from 0 to 0.16 M NaCl in equilibration buffer. To see this figure in color, go online.
Figure 4
Figure 4
Isoelectric focusing profiles on an ampholine plate gel (pH 3.5–9.5) of peak fractions from Q2 Sepharose column chromatography of rHb (βH92G) compared with Mb and Hb A. Samples of Q2-0, Q2-I, and Q2-II were taken from labeled peak fractions in Fig. 3. Horse heart myoglobin was used for Mb. Hb A was loaded in both outside lanes of the gel to assess whether or not electrophoresis ran correctly.
Figure 5
Figure 5
G-75 gel filtration results. (A) Elution pattern of rHb (αH87G) (peak fraction from the Q2 column) from a Sephadex G-75 gel filtration column. T, D, and M indicate expected positions of tetramers, dimers, and monomer, respectively. The position of tetramers (T) is inferred from elution of Hb A. That of dimers (D) is from Hb Hirose (βTrp37 → Ser) (26), and that of monomer (M) is from sperm whale myoglobin. Void volume was determined with blue dextran. The Sephadex G-75 column was 1.5 × 115 cm and equilibrated with 0.05 M phosphate buffer (pH 7.0) containing 10 mM Im at 4°C. One-milliliter samples of 150 μM protein (based on heme concentration) were applied to the column. (B) Sephadex G-75 gel filtration column elution patterns of Q2-II (left) and Q2-I (right) fractions of rHb (βH92G) (red) in 0.05 M phosphate buffer (pH 7.0) containing 10 mM Im. The patterns for Hb A (dotted orange) and Hb Hirose (dotted blue) are displayed for comparison. To see this figure in color, go online.
Figure 6
Figure 6
(A) Far-UV CD spectra of Hb A (red) and rHb (αH87G) (blue). Molar CD (Δε), calculated per heme, is given in M−1 cm−1. (B) Far-UV CD spectra of Q2-I (blue) and Q2-II fractions (green) of rHb (βH92G) and Hb A (red) with 1 (left) or 2 (right) mM Im. To see this figure in color, go online.
Figure 7
Figure 7
RR spectra of rHb (βH92G) and Hb A: (A) tetramer (α2β2) of rHb (βH92G); (B) 2 × dimer (αβ) of rHb (βH92G); (C) difference spectrum = tetramer − 2 × dimer; (D and E) and difference spectra, orange (D) = tetramer – Hb A, black (E) = 2 × dimer – Hb A. (F) Hb A in deoxy form in 0.05 M phosphate buffer (pH 7). To see this figure in color, go online.
Figure 8
Figure 8
Simulation of RR spectra to estimate the fraction of heme released. The δ(CβCcCd) band of the porphyrin macrocycle at 365 cm−1, and the νFe-Im and νFe-His bands around 230–210 cm−1 in the observed spectra of tetramer and dimer from Fig. 7 are reproduced in (A) and (B), respectively. Intensities of δ(CβCcCd) relative to νFe-Im and νFe-His bands in the spectra of the tetramer and dimer are the same as those in Fig. 7. (C) The difference spectrum, tetramer – 2 × dimer, (same as the red curve in Fig. 7). (D) The simulated spectrum of α2β2 tetramer of cavity mutants reported in (8). In this figure, however, only the peak frequency of the β-subunit is shifted from 223 to 225 cm−1 with no change in intensity. (E) The calculated spectra of dimer (Dx; broken line) and the tetramer-dimer difference spectra (Δ; solid line) for the assumed values x = 0.3 (E1) and x = 0.5 (E2). To see this figure in color, go online.
Figure 9
Figure 9
1H NMR spectra of the azide forms of tetrameric ferric rHb (βH92G) (upper spectrum) and metHb A (lower spectrum) at 308 K (pH 8.0) in 20 mM phosphate buffer containing 10 mM Im. The H2O/D2O ratio is 9:1. To see this figure in color, go online.
Figure 10
Figure 10
Schematic illustration of the apparent tetramer-dimer equilibria of rHb (βH92G) and rHb (αH87G). Solid and broken lines denote major and minor species present, respectively. The F helices associated with Im-bound hemes in mutated globins, and His-bound hemes in native globins are represented in red and black, respectively. The globins of rHb (αH87G) adopt ordinary higher order structures similar to Hb A, but those of rHb (βH92G) adopt dynamic structures involving large amplitude-segmental motions. As a result, they dissociate more readily into dimers. The Q Sepharose column recognizes differences among the three species and separates them despite their shared pI. To see this figure in color, go online.

References

    1. Perutz M.F. Regulation of oxygen affinity of hemoglobin: influence of structure of the globin on the heme iron. Annu. Rev. Biochem. 1979;48:327–386. - PubMed
    1. Imai K. Cambridge University Press; Cambridge, UK: 1982. Allosteric Effects in Haemoglobin.
    1. Perutz M.F. Stereochemistry of cooperative effects in haemoglobin. Nature. 1970;228:726–739. - PubMed
    1. Baldwin J., Chothia C. Haemoglobin: the structural changes related to ligand binding and its allosteric mechanism. J. Mol. Biol. 1979;129:175–220. - PubMed
    1. Monod J., Wyman J., Changeux J.P. On the nature of allosteric transitions: a plausible model. J. Mol. Biol. 1965;12:88–118. - PubMed

Publication types

LinkOut - more resources