. 2021 Aug 1;27(15):4221-4229.
doi: 10.1158/1078-0432.CCR-21-0417. Epub 2021 Jun 4.

Prognostic Significance of Blood-Based Multi-cancer Detection in Plasma Cell-Free DNA

Affiliations

Prognostic Significance of Blood-Based Multi-cancer Detection in Plasma Cell-Free DNA

Xiaoji Chen et al. Clin Cancer Res. .

Abstract

Purpose: We recently reported the development of a cell-free DNA (cfDNA) targeted methylation (TM)-based sequencing approach for a multi-cancer early detection (MCED) test that includes cancer signal origin prediction. Here, we evaluated the prognostic significance of cancer detection by the MCED test using longitudinal follow-up data.

Experimental design: As part of a Circulating Cell-free Genome Atlas (CCGA) substudy, plasma cfDNA samples were sequenced using a TM approach, and machine learning classifiers predicted cancer status and cancer signal origin. Overall survival (OS) of cancer participants in the first 3 years of follow-up was evaluated in relation to cancer detection by the MCED test and clinical characteristics.

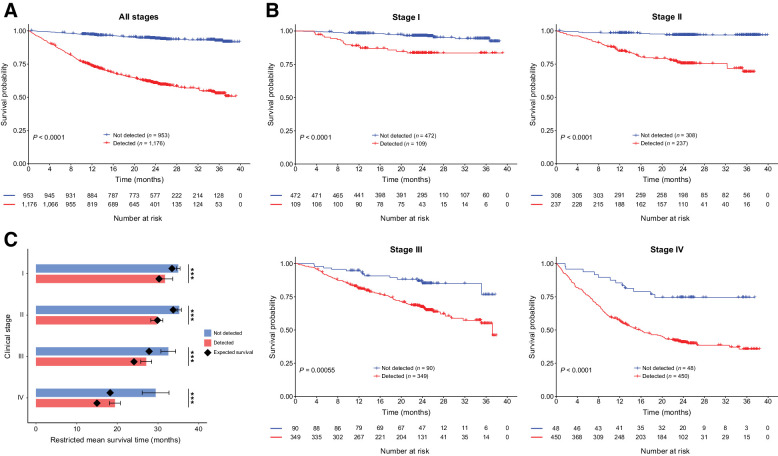
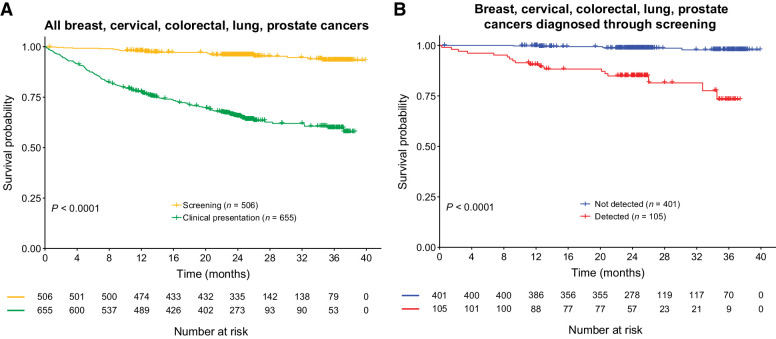
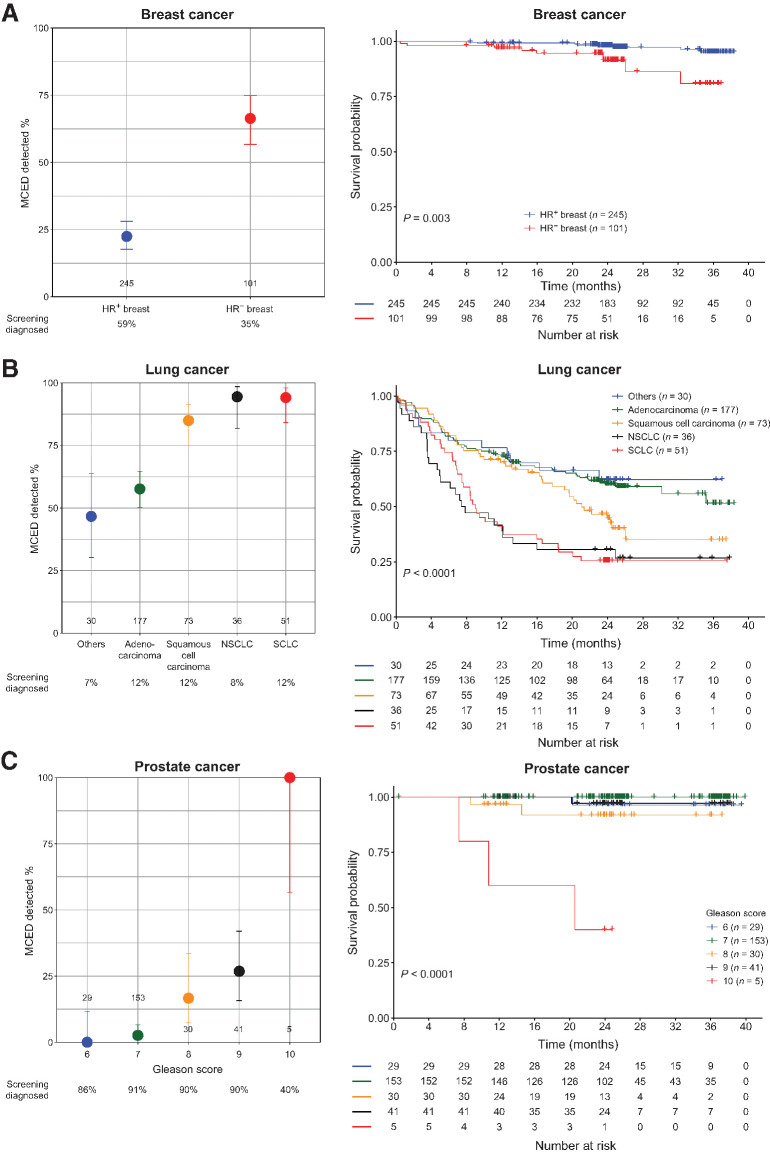
Results: Cancers not detected by the MCED test had significantly better OS (P < 0.0001) than cancers detected, even after accounting for other covariates, including clinical stage and method of clinical diagnosis (i.e., standard-of-care screening or clinical presentation with signs/symptoms). Additionally, cancers not detected by the MCED test had better OS than was expected when data were adjusted for age, stage, and cancer type from the Surveillance, Epidemiology, and End Results (SEER) program. In cancers with current screening options, the MCED test also differentiated more aggressive cancers from less aggressive cancers (P < 0.0001).

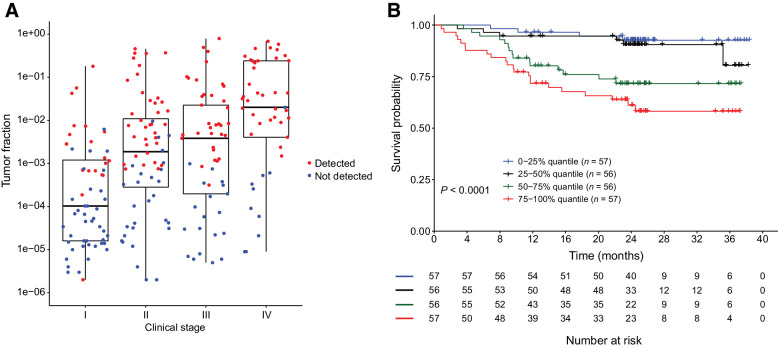
Conclusions: Cancer detection by the MCED test was prognostic beyond clinical stage and method of diagnosis. Cancers not detected by the MCED test had better prognosis than cancers detected and SEER-based expected survival. Cancer detection and prognosis may be linked by the underlying biological factor of tumor fraction in cfDNA.


Figures

Figure 1. Comparison of OS in cancers detected versus not detected by the MCED test. A, Kaplan–Meier curve depicting OS for cancer participants of all stages detected (red) versus not detected (blue) by the MCED test. P value: log-rank test. B, Kaplan–Meier curve depicting OS for cancer participants of stages I–IV, detected (red) versus not detected (blue) by the MCED test. P values: log-rank test. C, Estimated RMST at 36 months for the MCED test detected and not detected cancers. Black diamonds indicate SEER-based expected survival. Error bars, 95% CI. ***, t test, P < 0.0001.
Figure 1.
Comparison of OS in cancers detected versus not detected by the MCED test. A, Kaplan–Meier curve depicting OS for cancer participants of all stages detected (red) versus not detected (blue) by the MCED test. P value: log-rank test. B, Kaplan–Meier curve depicting OS for cancer participants of stages I–IV, detected (red) versus not detected (blue) by the MCED test. P values: log-rank test. C, Estimated RMST at 36 months for the MCED test detected and not detected cancers. Black diamonds indicate SEER-based expected survival. Error bars, 95% CI. ***, t test, P < 0.0001.
Figure 2. Multivariate Cox proportional hazards regression model to identify factors associated with OS. Hazard ratios and 95% CIs are indicated by black boxes and gray lines, respectively. P values are indicated. Cancer mortality group is based on SEER 5-year survival of stage II cancers. Cancer mortality hazard-high group includes sarcoma, head and neck, cervix, plasma cell neoplasm, urothelial tract, bladder, myeloid neoplasm, stomach, lung, liver bile duct, esophagus, gallbladder, and pancreas cancer types. Cancer mortality hazard-low group includes thyroid, prostate, breast, kidney, uterus, lymphoid leukemia, lymphoma, ovary, colon/rectum, anus, melanoma, and other [includes brain, mesothelioma, orbit, penis, pleura, skin cancer (not basal cell carcinoma, squamous cell carcinoma, or melanoma), small intestine, testis, thymus, vagina, vulva, and unspecified] cancer types.
Figure 2.
Multivariate Cox proportional hazards regression model to identify factors associated with OS. Hazard ratios and 95% CIs are indicated by black boxes and gray lines, respectively. P values are indicated. Cancer mortality group is based on SEER 5-year survival of stage II cancers. Cancer mortality hazard-high group includes sarcoma, head and neck, cervix, plasma cell neoplasm, urothelial tract, bladder, myeloid neoplasm, stomach, lung, liver bile duct, esophagus, gallbladder, and pancreas cancer types. Cancer mortality hazard-low group includes thyroid, prostate, breast, kidney, uterus, lymphoid leukemia, lymphoma, ovary, colon/rectum, anus, melanoma, and other [includes brain, mesothelioma, orbit, penis, pleura, skin cancer (not basal cell carcinoma, squamous cell carcinoma, or melanoma), small intestine, testis, thymus, vagina, vulva, and unspecified] cancer types.
Figure 3. Survival trends in cancers with screening modalities (breast, cervical, colorectal, lung, and prostate cancers). A, OS comparison of cancers diagnosed through standard screening paradigms or clinical presentation. B, OS comparison of cancers detected or not detected by the MCED test in cancers diagnosed through standard screening paradigms.
Figure 3.
Survival trends in cancers with screening modalities (breast, cervical, colorectal, lung, and prostate cancers). A, OS comparison of cancers diagnosed through standard screening paradigms or clinical presentation. B, OS comparison of cancers detected or not detected by the MCED test in cancers diagnosed through standard screening paradigms.
Figure 4. MCED test detection in breast, lung, and prostate cancer subgroups. Sensitivity for MCED test detection and OS in different subgroups of breast (A), lung (B), and prostate (C) cancers are shown. Number of samples, and the proportion of cancers diagnosed through standard screening are indicated.
Figure 4.
MCED test detection in breast, lung, and prostate cancer subgroups. Sensitivity for MCED test detection and OS in different subgroups of breast (A), lung (B), and prostate (C) cancers are shown. Number of samples, and the proportion of cancers diagnosed through standard screening are indicated.
Figure 5. Association of tumor fraction in cfDNA and cancer aggressiveness. A, Box plot depicting clinical stage (x-axis) versus tumor fraction (y-axis). Cancers detected (red) or not detected (blue) by the MCED test are indicated. B, Comparison of OS in tumor fraction high and low cancers. Tumor fraction is divided into four quantiles, with 75%–100% being the highest quantile.
Figure 5.
Association of tumor fraction in cfDNA and cancer aggressiveness. A, Box plot depicting clinical stage (x-axis) versus tumor fraction (y-axis). Cancers detected (red) or not detected (blue) by the MCED test are indicated. B, Comparison of OS in tumor fraction high and low cancers. Tumor fraction is divided into four quantiles, with 75%–100% being the highest quantile.

Comment in

References

    1. Tan G, Chu C, Gui X, Li J, Chen Q. The prognostic value of circulating cell-free DNA in breast cancer: a meta-analysis. Medicine (Baltimore) 2018;97:e0197. - PMC - PubMed
    1. Stover DG, Parsons HA, Ha G, Freeman SS, Barry WT, Guo H, et al. . Association of cell-free DNA tumor fraction and somatic copy number alterations with survival in metastatic triple-negative breast cancer. J Clin Oncol 2018;36:543–53. - PMC - PubMed
    1. Chen X, Chang C-W, Spoerke JM, Yoh KE, Kapoor V, Baudo C, et al. . Low-pass whole-genome sequencing of circulating cell-free DNA demonstrates dynamic changes in genomic copy number in a squamous lung cancer clinical cohort. Clin Cancer Res 2019;25:2254–63. - PubMed
    1. Chen L, Zhang Y, Cheng Y, Zhang D, Zhu S, Ma X. Prognostic value of circulating cell-free DNA in patients with pancreatic cancer: a systemic review and meta-analysis. Gene 2018;679:328–34. - PubMed
    1. Phallen J, Sausen M, Adleff V, Leal A, Hruban C, White J, et al. . Direct detection of early-stage cancers using circulating tumor DNA. Sci Transl Med 2017;9:eaan2415. - PMC - PubMed

Publication types

Substances