. 2021 Jun 4;11(1):11843.
doi: 10.1038/s41598-021-90903-2.

Seaweed cellulose scaffolds derived from green macroalgae for tissue engineering

Affiliations

Seaweed cellulose scaffolds derived from green macroalgae for tissue engineering

Nurit Bar-Shai et al. Sci Rep. .

Abstract

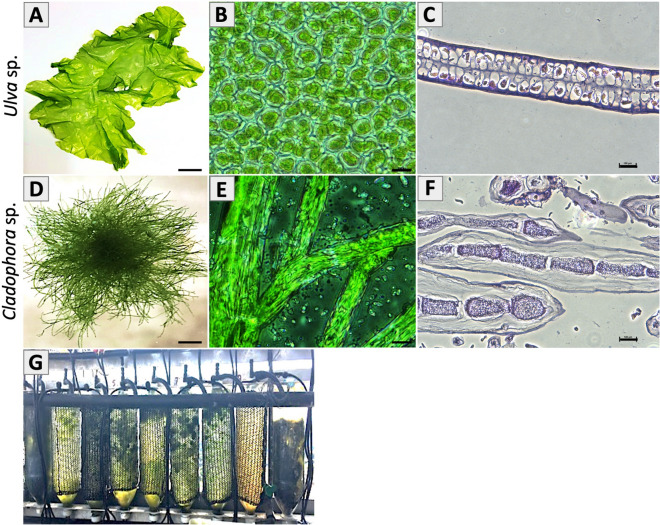
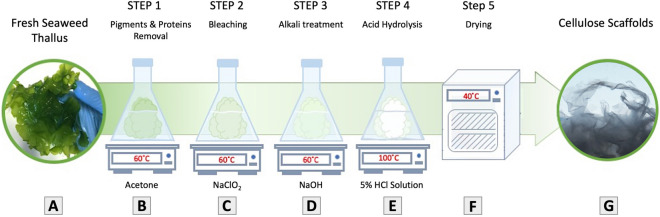
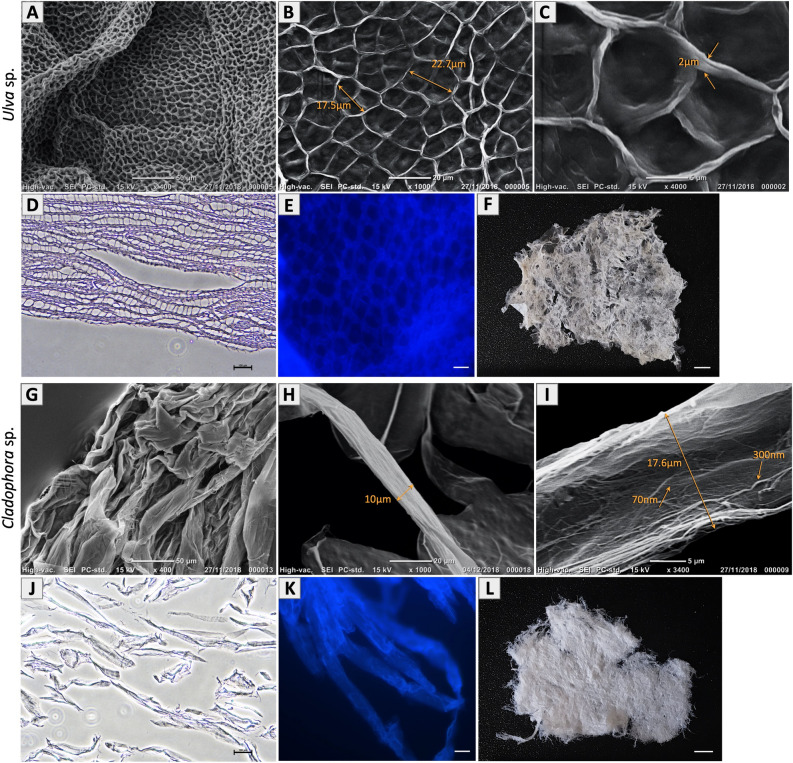
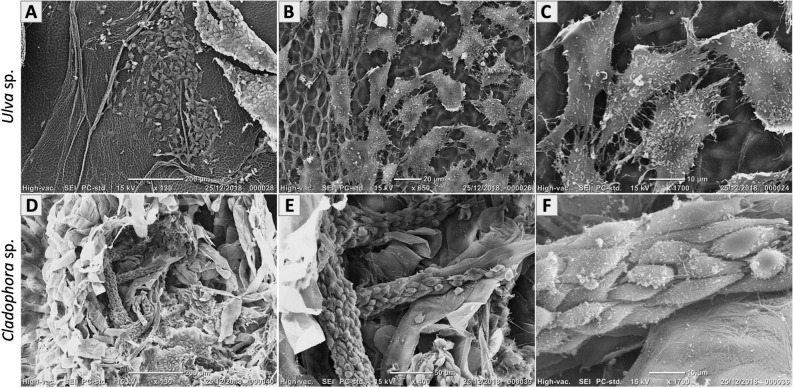
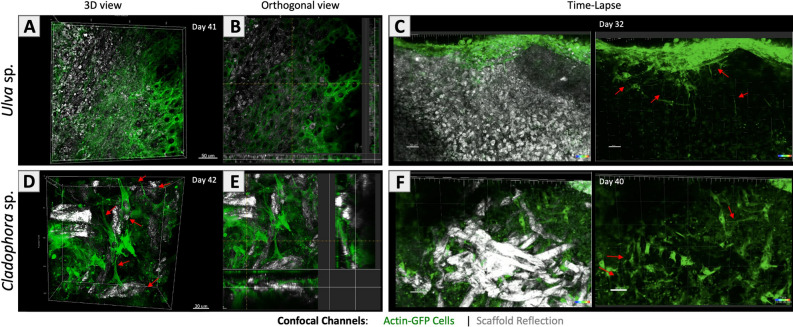
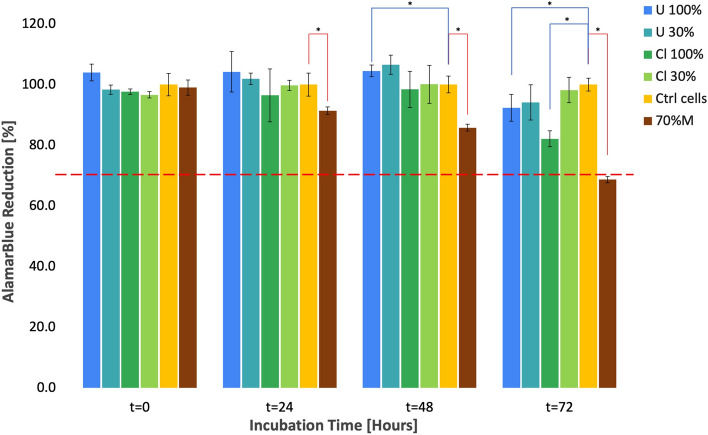
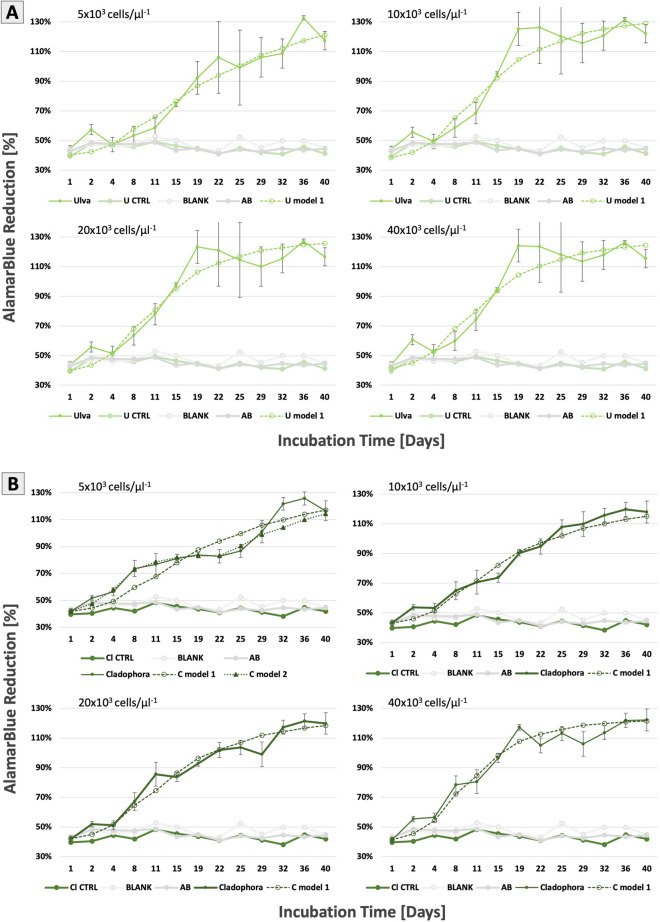
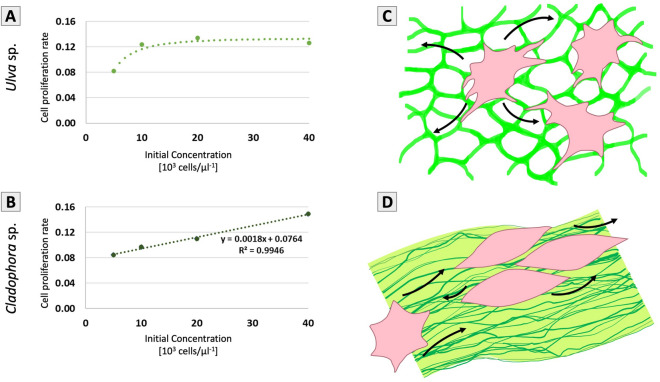
Extracellular matrix (ECM) provides structural support for cell growth, attachments and proliferation, which greatly impact cell fate. Marine macroalgae species Ulva sp. and Cladophora sp. were selected for their structural variations, porous and fibrous respectively, and evaluated as alternative ECM candidates. Decellularization-recellularization approach was used to fabricate seaweed cellulose-based scaffolds for in-vitro mammalian cell growth. Both scaffolds were confirmed nontoxic to fibroblasts, indicated by high viability for up to 40 days in culture. Each seaweed cellulose structure demonstrated distinct impact on cell behavior and proliferation rates. The Cladophora sp. scaffold promoted elongated cells spreading along its fibers' axis, and a gradual linear cell growth, while the Ulva sp. porous surface, facilitated rapid cell growth in all directions, reaching saturation at week 3. As such, seaweed-cellulose is an environmentally, biocompatible novel biomaterial, with structural variations that hold a great potential for diverse biomedical applications, while promoting aquaculture and ecological agenda.


Conflict of interest statement

The authors declare no competing interests.

Figures

Figure 1
Figure 1
Marine green macroalgae: Thallus morphology macro view of (A) Ulva sp. and (D) Cladophora sp. Light microscopy observation (40×) of middle region reveals (B) Ulva sp. micro-porous structure and (E) Cladophora sp. branching fibrous filamentous structure. Hematoxylin and eosin (H&E) staining of cross-sections reveal tissue fragments of (C) Ulva sp. by-layer porous structure and of (F) Cladophora sp., fibers. (G) Macroalgae species cultivated in a Macroalgae Photo-Bioreactors (MPBR) system, design of Chemodanov, A., the Golberg Environmental Bioengineering Lab, Porter, Tel Aviv University. Cylindrical sleeve dimensions: 100 × 40 cm, thickness: 200 µm. *Scale Bars: (A) = 2.5 cm, (B,E) = 20 µm, (C,F) = 100 µm, (D) = 0.25 cm.
Figure 2
Figure 2
Scheme of decellularization treatment: cellular components are removed from a whole green macroalgae. (A) Fresh algae thallus samples were obtained, (B) soaked in acetate buffer to remove pigments and proteins (C) then soaked in bleach bath to remove polysaccharides of simpler structure than cellulose. (D) Following an alkali treatment with Sodium Hydroxide, to remove all excessive lipids and hemicellulose within the cell wall. (E) Further acid treatment is carried out with Hydrochloric acid, to remove all excessive polysaccharides, such as starch, that might remain close to the cell wall. Finally, the samples were rinsed in DW until reaching a neutral PH and obtaining a clear clean cellulose biomass. The samples were then filtered and dried making them a ready to be used acellular scaffolds.
Figure 3
Figure 3
Decellularized seaweed cellulose: Structural surface area SEM imaging of (A–C) Ulva sp., acellular scaffold, show highly organized porous architecture with average pore size width 20.2 ± 4 µm (n = 50 analyzed regions) and cell wall thickness ranging between 0.5 and 2.0 µm (n = 10 analyzed regions). (G–I) Cladophora sp., acellular scaffold, show highly fibrous architecture with fiber diameter from 5 µm and above 80 µm (n = 55 analyzed regions), covered with microfibrils ranging in width between 55 and 400 nm (n = 50 analyzed regions). Hematoxylin and eosin (H&E) staining of cross-sections of decellularized scaffolds (D) Ulva sp. and (J) Cladophora sp., reveal eosin stain of the matrix and no hematoxylin (cell nucleus). Corresponding fluorescent microscopy images of seaweed cell wall stained with Calcofluor White, reveal middle region overview structural properties and confirm cellulose as the prime structural component of the seaweed scaffolds (E) Ulva spp. and (K) Cladophora sp. Both seaweed scaffolds were confirmed a-cellular, empty of cell organelles, indicating that the decellularization method was effective, and that the seaweed cellulose structural shape remained intact post decellularization treatment. Macro view of the decellularized seaweed (F) Ulva sp. and (L) Cladophora sp., were used as scaffolds for cell growth. *Scale bars: (A,G) = 50 µm, (B,H) = 20 µm, (C,I) = 5 µm, (D,J) = 100 µm, (E,K) = 10 µm, (F,L) = 0.25 cm.
Figure 4
Figure 4
Recellularized seaweed cellulose scaffolds: SEM Imaging of sterilized cellulose scaffolds, recellularized with fibroblast after 4 weeks of seeding, reveal cell growth and cell attachments onto the (A–C) Ulva sp. porous matrix, with average cell size of 34.2 ± 8.4 µm (n = 40 analyzed regions), and along the (D–F) Cladophora sp. fibrous matrix, with average cell size of 20.1 ± 4 µm (n = 70 analyzed regions). Observations show elongated filament profusions (C) traced the Ulva sp. porous cell-wall matrix and (D) along the Cladophora sp. fibers, as well as connected to neighboring cells on both scaffolds’ surface areas. Both which confirmed cell-to-matrix and cell-to-cell interactions. *Scale bars: (A,D) = 200 µm, (B,F) = 20 µm, (C) = 10 µm, (E) = 50 µm.
Figure 5
Figure 5
Cells growth on seaweed cellulose scaffolds: Fluorescence confocal microscopy imaging of live fibroblast (20 × 103 cells/µl), labeled with actin-GFP (green), overlay the macroalgae cellulose scaffolds, detected in reflection mode. 3D Z-stack and orthogonal views (40×) reveal cell growth and attachments onto the (A,B) Ulva sp. porous matrix, (Day 41) and (D,E) Cladophora sp. fibrous matrix, (Day 42). Yellow dash lines indicate the location of the orthogonal cut. Additional time-lapse imaging (20×), available in Supplementary Movies S1–S4 reveal cell growth and spreading on the cellulose scaffolds (C) Ulva sp. (Day 32) and (F) Cladophora sp. (Day 40). Extended slender cell protrusions observed on both scaffolds, indicate that the cells remain alive and function during the entire experiment as they formed connectivity with neighboring cells and the scaffolds’ surface area. *Scale bars: (A–C) = 50 µm, (D,E) = 30 µm, (F) = 80 µm.
Figure 6
Figure 6
Cytotoxicity indirect test: SC scaffold Ulva sp. and Cladophora sp. were prepared according to ISO-10993. Cell viability was quantified with alamarBlue indirect test. Fibroblast incubated with 100% and 30% media extracted from Ulva sp. (U 100% and U 30%) and Cladophora sp. (Cl 100% and Cl 30%) cellulose scaffolds, at incubation time points t = 0, t = 24, t = 48 and t = 72. Control groups include negative control of cell culture incubated with regular media (Ctrl cells) and positive cytotoxic 70% methanol treatment (70%M). A red dashed line at 70% viability, distinguish between viable and toxic constructs. Values are expressed as mean ± SD, n = 5, *p < 0.05 (obtained by Student t-test).
Figure 7
Figure 7
Cell viability direct test: Fibroblast seeded with seaweed cellulose scaffolds derived from (A) Ulva sp. and (B) Cladophora sp. at initial cell densities 5 × 103, 10 × 103, 20 × 103 and 40 × 103 cells/µl. The plots present cell growth over a period of 40 days for each cell concentration, relative to the alamarBlue percentage reduction. Control groups include Ulva sp. and Cladophora sp. scaffolds without cells, Blank media and 10% AB media solution. Values are expressed as mean ± SD, n = 3.
Figure 8
Figure 8
Cell growth in correlation to cell concentrations: Modeled cell proliferation rates as a function of initial cell seeding concentration for the (A) Ulva sp., which reached rapid increase following by cell saturation at high cell concentrations and for the (B) Cladophora sp. with a linear increase correlated to cell proliferation rate and initial cell seeding concentrations. The plots present cell growth upward trends at 5 × 103, 10 × 103, 20 × 103 and 40 × 103 cells/µl cell concentrations. Scheme of cell migration and alignment in correlation to SC structures: the (C) Ulva sp. matrix facilitates migration opportunities in all directions, which results in rapid cell growth, as cells ‘cover’ the scaffold’s microporous surface area, following proliferation rate decrease, due to early cell saturation. The (D) Cladophora sp. structure facilitates migration opportunities along the fiber elongated axis, guided by microfibrils that overlay the fiber’s surface, which results in linear increase of proliferation rates.

Similar articles

Cited by

References

    1. Ratner, B. D., Hoffman, A. S., Schoen, F. J. & Lemons, J. E. Biomaterials Science: An Introduction to Materials in Medicine (Elsevier, 2013).
    1. Lanza, R., Langer, R. & Vacanti, J. Principles of Tissue Engineering (Academic Press, 2020).
    1. Hickey RJ, Pelling AE. Cellulose biomaterials for tissue engineering. Front. Bioeng. Biotechnol. 2019 doi: 10.3389/fbioe.2019.00045. - DOI - PMC - PubMed
    1. Klemm D, Heublein B, Fink H-P, Bohn A. Cellulose: Fascinating biopolymer and sustainable raw material. Angew. Chemie Int. Ed. 2005;44:3358–3393. doi: 10.1002/anie.200460587. - DOI - PubMed
    1. Gibson LJ. The hierarchical structure and mechanics of plant materials. J. R. Soc. Interface. 2012;9:2749–2766. doi: 10.1098/rsif.2012.0341. - DOI - PMC - PubMed

Publication types

MeSH terms