. 2021 Jun 4;11(1):11842.
doi: 10.1038/s41598-021-90618-4.

Inhibition of epithelial-mesenchymal transition in retinal pigment epithelial cells by a retinoic acid receptor-α agonist

Affiliations

Inhibition of epithelial-mesenchymal transition in retinal pigment epithelial cells by a retinoic acid receptor-α agonist

Yuka Kobayashi et al. Sci Rep. .

Abstract

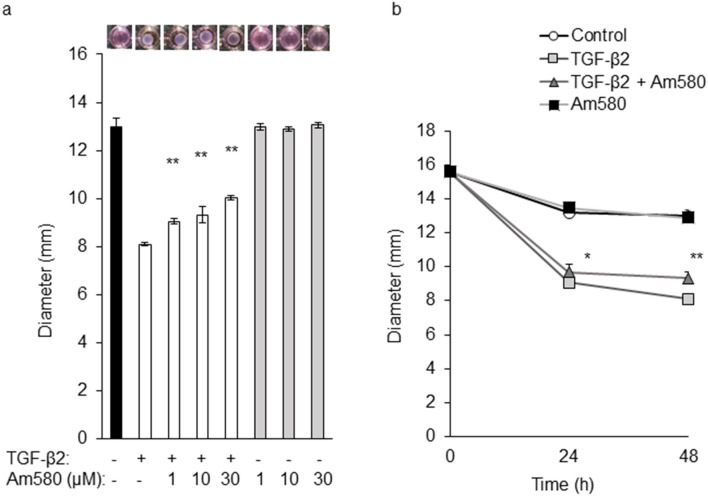
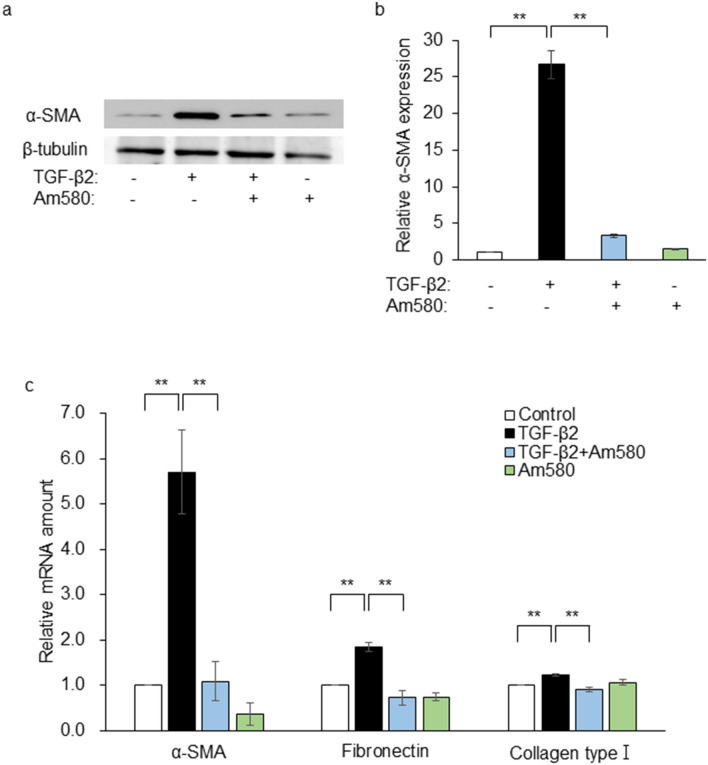
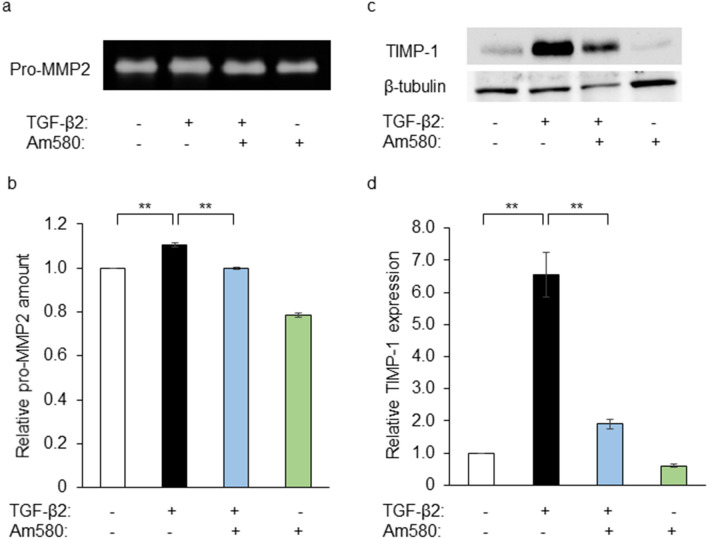
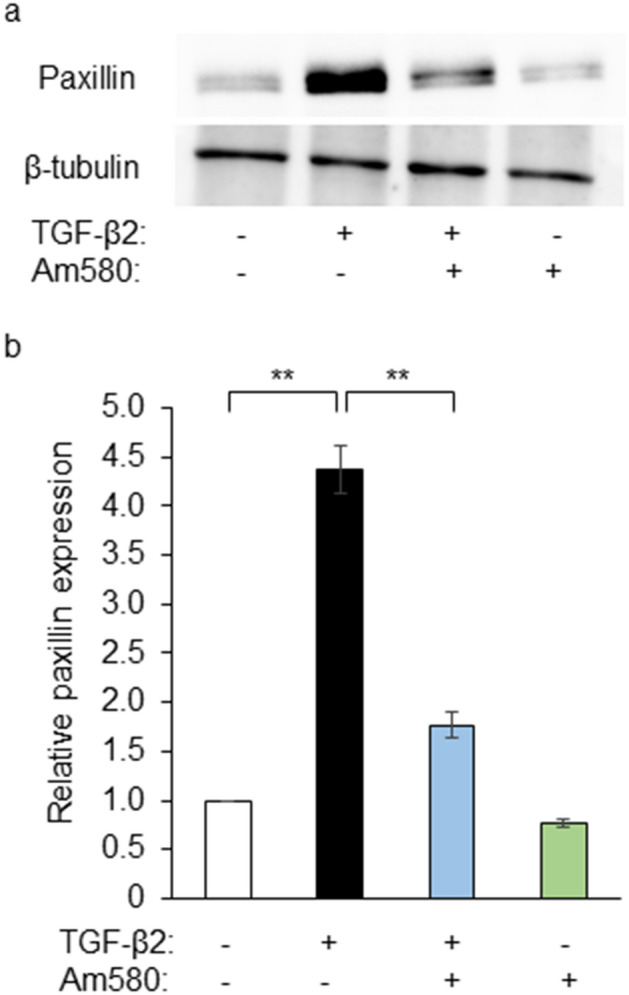
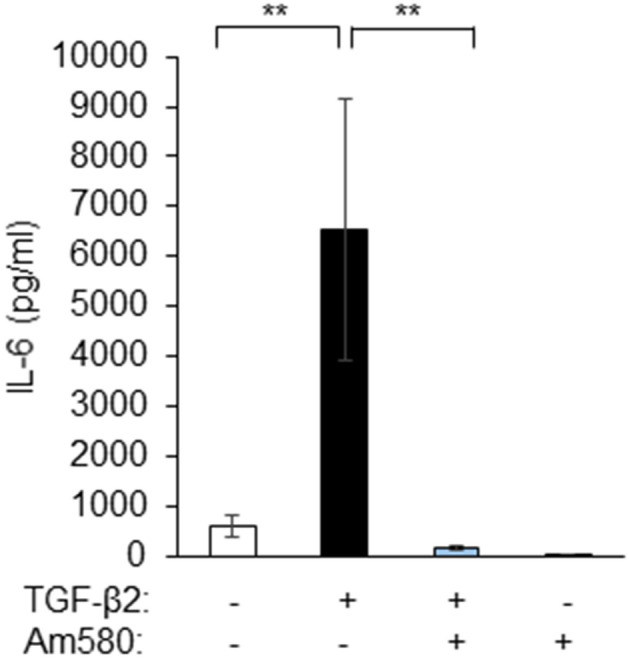
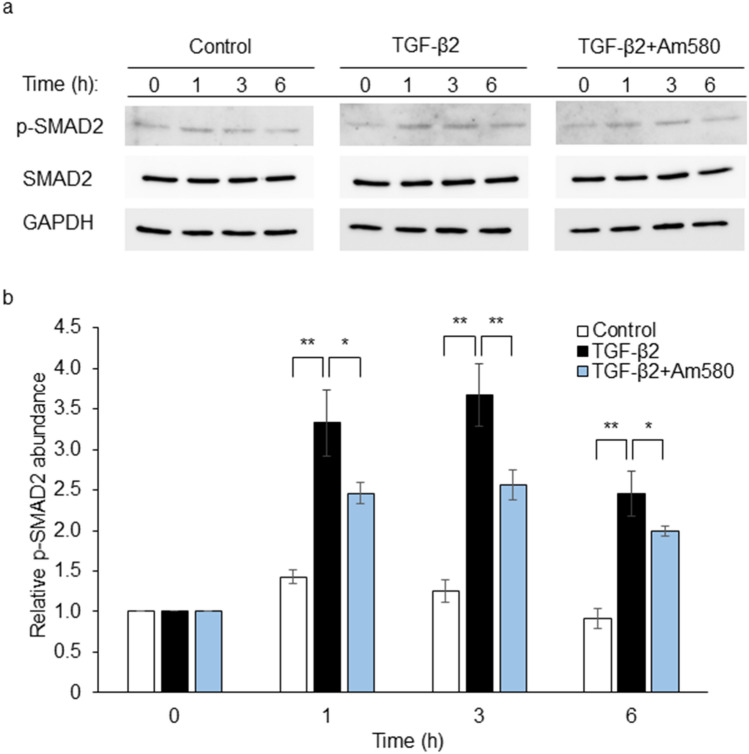
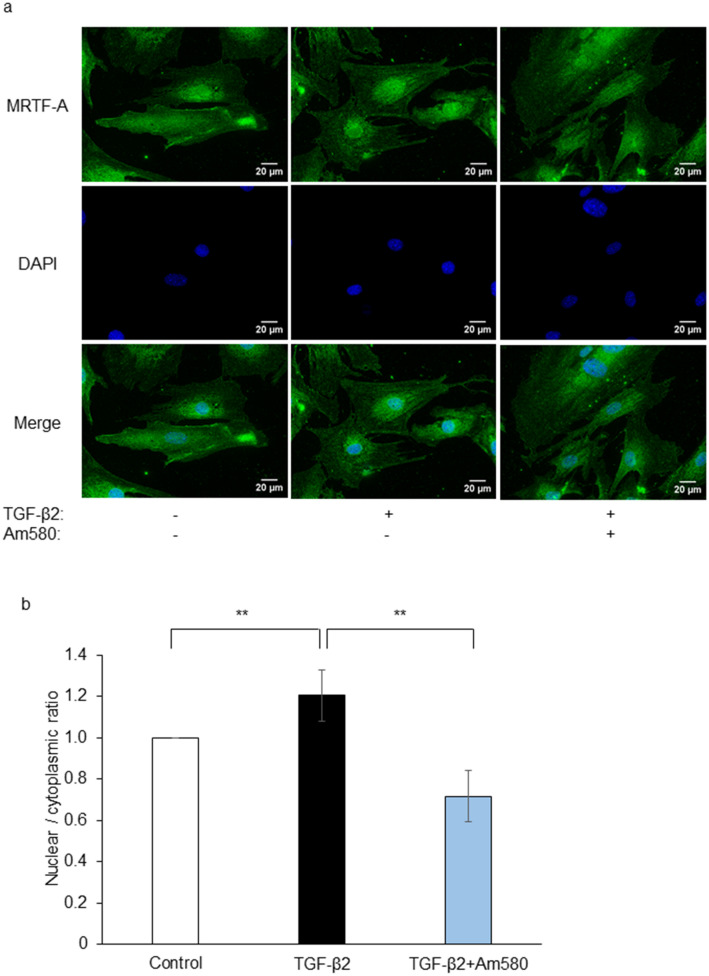
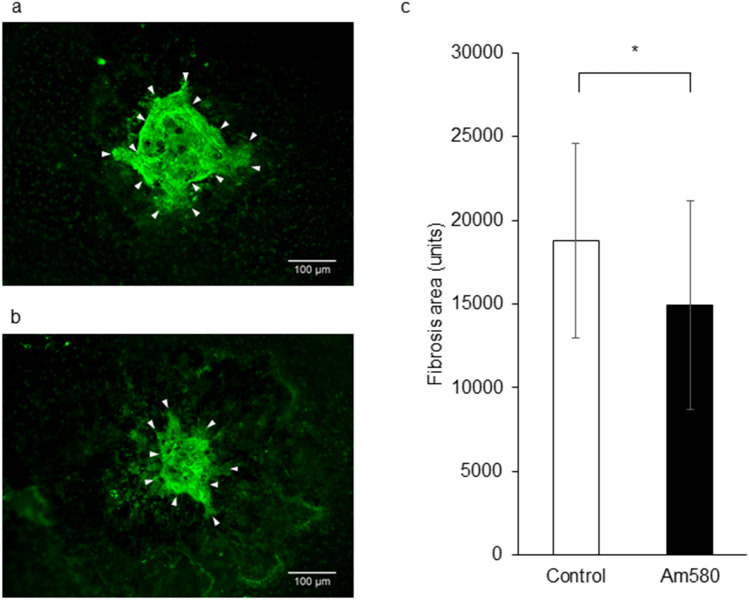
Epithelial-mesenchymal transition (EMT) in retinal pigment epithelial (RPE) cells plays a key role in proliferative retinal diseases such as age-related macular degeneration by contributing to subretinal fibrosis. To investigate the potential role of retinoic acid receptor-α (RAR-α) signaling in this process, we have now examined the effects of the RAR-α agonist Am580 on EMT induced by transforming growth factor-β2 (TGF-β2) in primary mouse RPE cells cultured in a three-dimensional type I collagen gel as well as on subretinal fibrosis in a mouse model. We found that Am580 inhibited TGF-β2-induced collagen gel contraction mediated by RPE cells. It also attenuated the TGF-β2-induced expression of the mesenchymal markers α-smooth muscle actin, fibronectin, and collagen type I; production of pro-matrix metalloproteinase 2 and interleukin-6; expression of the focal adhesion protein paxillin; and phosphorylation of SMAD2 in the cultured RPE cells. Finally, immunofluorescence analysis showed that Am580 suppressed both the TGF-β2-induced translocation of myocardin-related transcription factor-A (MRTF-A) from the cytoplasm to the nucleus of cultured RPE cells as well as subretinal fibrosis triggered by laser-induced photocoagulation in a mouse model. Our observations thus suggest that RAR-α signaling inhibits EMT in RPE cells and might attenuate the development of fibrosis associated with proliferative retinal diseases.


Conflict of interest statement

The authors declare no competing interests.

Figures

Figure 1
Figure 1
Inhibitory effect of an RAR-α agonist on RPE cell-mediated collagen gel contraction induced by TGF-β2. RPE cells were incubated in collagen gels with or without TGF-β2 (1 ng/ml) and the indicated concentrations (0 to 30 µM) of Am580 for 48 h (a) or with or without TGF-β2 (1 ng/ml) and Am580 (10 µM) for 0 to 48 h (b), after which the gel diameter was determined. Data are means ± s.d. from four independent experiments. *P < 0.05, **P < 0.01 (Dunnett’s test) versus the corresponding value for cells cultured with TGF-β2 alone.
Figure 2
Figure 2
Inhibitory effects of an RAR-α agonist on the TGF-β2-induced expression of EMT markers in RPE cells. (a) RPE cells were cultured in collagen gels with or without TGF-β2 (1 ng/ml) and Am580 (10 µM) for 48 h, after which cell lysates were prepared and subjected to immunoblot analysis with antibodies to α-SMA and to β-tubulin (loading control). (b) The intensity of each α-SMA band in blots similar to that in (a) was normalized by that of the corresponding β-tubulin band, and the normalized values were expressed relative to that for control cells and are presented as means ± s.d from three independent experiments. The intensity of each immunoreactive bands was measured with the use of the Gels commands in ImageJ software. (c) Serum-deprived RPE cells were cultured in 24-well plates first with or without Am580 (10 μM) for 6 h and then in the additional absence or presence of TGF-β2 (1 ng/ml) for 48 h, after which the relative abundance of α-SMA, fibronectin, and collagen type I mRNAs was determined by RT-qPCR analysis. Data were normalized by the amount of GAPDH mRNA and are means ± s.d. from three independent experiments. **P < 0.01 (Dunnett’s test).
Figure 3
Figure 3
Inhibitory effects of an RAR-α agonist on TGF-β2-induced pro-MMP2 and TIMP-1 expression in RPE cells. (a) RPE cells were cultured in collagen gels with or without TGF-β2 (1 ng/ml) and Am580 (10 µM) for 48 h, after which the culture supernatants were subjected to gelatin zymography for detection of pro-MMP2. (b) Quantitation of relative pro-MMP2 band intensity for gels similar to that in (a). (c) RPE cells cultured as in (a) were lysed and subjected to immunoblot analysis with antibodies to TIMP-1 and to β-tubulin. (d) The intensity of each TIMP-1 band in blots similar to that in (c) was normalized by that of the corresponding β-tubulin band, and the normalized values were expressed relative to that for control cells. Quantitative data in (b) and (d) are means ± s.d. from four independent experiments. The intensity of each bands was measured with the use of the Gels commands in ImageJ software. **P < 0.01 (Dunnett’s test).
Figure 4
Figure 4
Inhibitory effect of an RAR-α agonist on the TGF-β2-induced expression of paxillin in RPE cells. (a) RPE cells were cultured in collagen gels with or without TGF-β2 (1 ng/ml) and Am580 (10 µM) for 48 h, after which cell lysates were prepared and subjected to immunoblot analysis with antibodies to paxillin and to β-tubulin. (b) The intensity of each paxillin band in blots similar to that in (a) was normalized by that of the corresponding β-tubulin band, and the normalized values were expressed relative to that for control cells and are presented as means ± s.d. for four independent experiments. The intensity of each immunoreactive bands was measured with the use of the Gels commands in ImageJ software. **P < 0.01 (Dunnett’s test).
Figure 5
Figure 5
Inhibitory effect of an RAR-α agonist on the TGF-β2-induced release of IL-6 by RPE cells. RPE cells were cultured in collagen gels with or without TGF-β2 (1 ng/ml) and Am580 (10 μM) for 48 h, after which the culture supernatants were assayed for IL-6. Data are means ± s.d. from four independent experiments. **P < 0.01 (Dunnett’s test).
Figure 6
Figure 6
Inhibitory effect of an RAR-α agonist on TGF-β2-induced SMAD2 phosphorylation in RPE cells. (a) Serum-deprived RPE cells were cultured in 24-well plates with or without Am580 (10 μM) for 6 h and then in the additional absence or presence of TGF-β2 (1 ng/ml) for the indicated times. Cell lysates were then prepared and subjected to immunoblot analysis with antibodies to total or phosphorylated (p-) forms of SMAD2 and to GAPDH (loading control). (b) The intensity of each phospho-SMAD2 band was normalized by that of the corresponding total SMAD2 band, and the normalized values were expressed relative to that for control cells at 0 h. Data are means ± s.d. from four independent experiments. The intensity of each immunoreactive bands was measured with the use of the Gels commands in ImageJ software. *P < 0.05, **P < 0.01 (Dunnett’s test).
Figure 7
Figure 7
Inhibitory effect of an RAR-α agonist on TGF-β2-induced nuclear translocation of MRTF-A in RPE cells. (a) Serum-deprived RPE cells cultured on cover glasses in 24-well plates were incubated with or without Am580 (10 µM) for 12 h and then in the additional absence or presence of TGF-β2 (10 ng/ml) for 24 h, after which they were fixed and subjected to immunofluorescence analysis of MRTF-A (green). Nuclei were stained with DAPI (blue). Scale bars, 20 µm. Data are representative of four independent experiments. (b) The nuclear/cytoplasmic ratio of MRTF-A immunofluorescence intensity in experiments as in (a) was determined and expressed relative to that for control cells. Data are means ± s.d. for a total of 20 cells in four independent experiments. The intensity of MRTF-A immunofluorescence in the nucleus and cytoplasm was measured with the use of the ROI manager commands in ImageJ software. **P < 0.01 (Dunnett’s test).
Figure 8
Figure 8
Inhibitory effect of an RAR-α agonist in a mouse model of subretinal fibrosis. Intravitreal injection (1 µl) of either PBS vehicle (a) or Am580 (50 µM) (b) was performed both immediately and 3 days after laser photocoagulation. Choroidal flat-mount preparations from the mice at 3 weeks after photocoagulation were subjected to immunofluorescence staining with antibodies to collagen type I (green). Arrowheads indicate photocoagulation-induced subretinal fibrosis. Scale bars, 100 µm. The area of fibrosis was measured with the use of the Measure command in ImageJ software and determined for the treated mice as mean ± s.d. values (n = 40 laser spots per group) (c). *P < 0.05 (Mann-Whitney test).

Similar articles

Cited by

References

    1. Lim LS, Mitchell P, Seddon JM, Holz FG, Wong TY. Age-related macular degeneration. Lancet. 2012;379:1728–1738. doi: 10.1016/S0140-6736(12)60282-7. - DOI - PubMed
    1. Sadda SR, Guymer R, Mones JM, Tufail A, Jaffe GJ. Anti-vascular endothelial growth factor use and atrophy in neovascular age-related macular degeneration: Systematic literature review and expert opinion. Ophthalmology. 2019 doi: 10.1016/j.ophtha.2019.11.010. - DOI - PubMed
    1. Toth CA, et al. Distribution of OCT features within areas of macular atrophy or scar after 2 years of anti-VEGF treatment for neovascular AMD in CATT. Ophthalmol. Retina. 2019;3:316–325. doi: 10.1016/j.oret.2018.11.011. - DOI - PMC - PubMed
    1. Cheung CMG, et al. The evolution of fibrosis and atrophy and their relationship with visual outcomes in Asian persons with neovascular age-related macular degeneration. Ophthalmol Retina. 2019;3:1045–1055. doi: 10.1016/j.oret.2019.06.002. - DOI - PubMed
    1. Saika S, et al. Smad3 signaling is required for epithelial-mesenchymal transition of lens epithelium after injury. Am. J. Pathol. 2004;164:651–663. doi: 10.1016/S0002-9440(10)63153-7. - DOI - PMC - PubMed

MeSH terms