. 2021 Nov;83(8):3311-3336.
doi: 10.3758/s13414-021-02284-3. Epub 2021 Jun 4.

Modelling visibility judgments using models of decision confidence

Affiliations

Modelling visibility judgments using models of decision confidence

Manuel Rausch et al. Atten Percept Psychophys. 2021 Nov.

Abstract

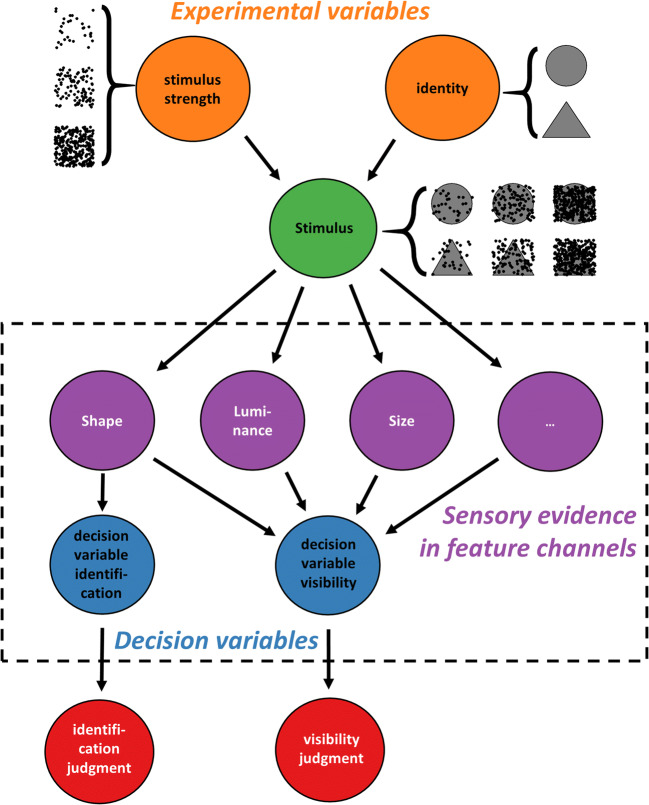
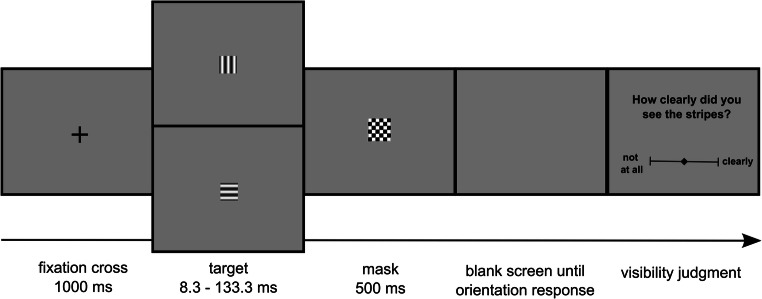
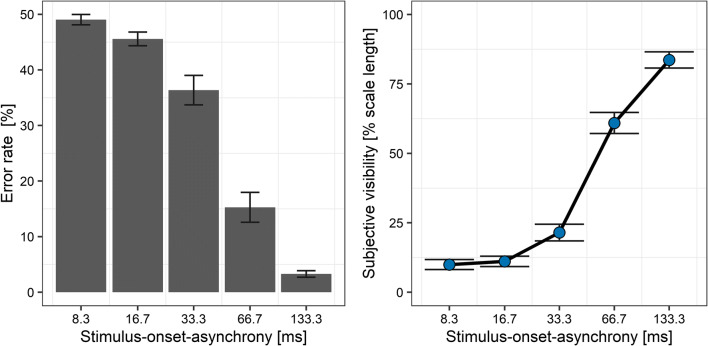
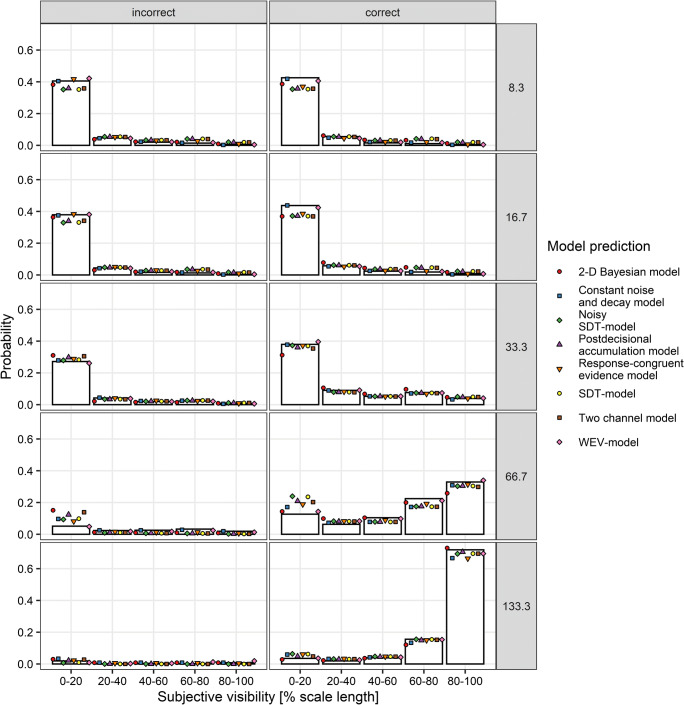
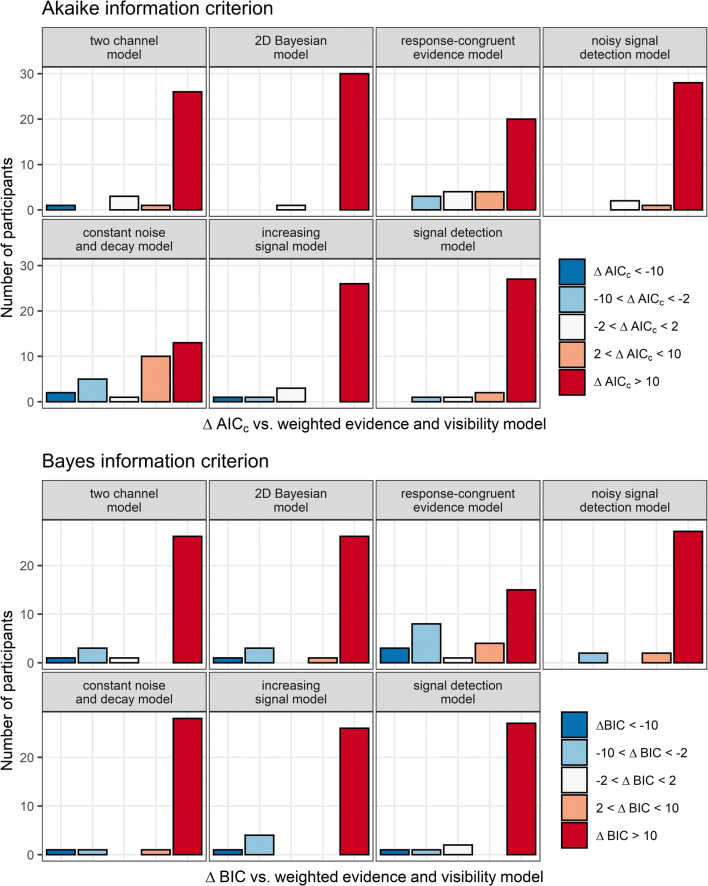
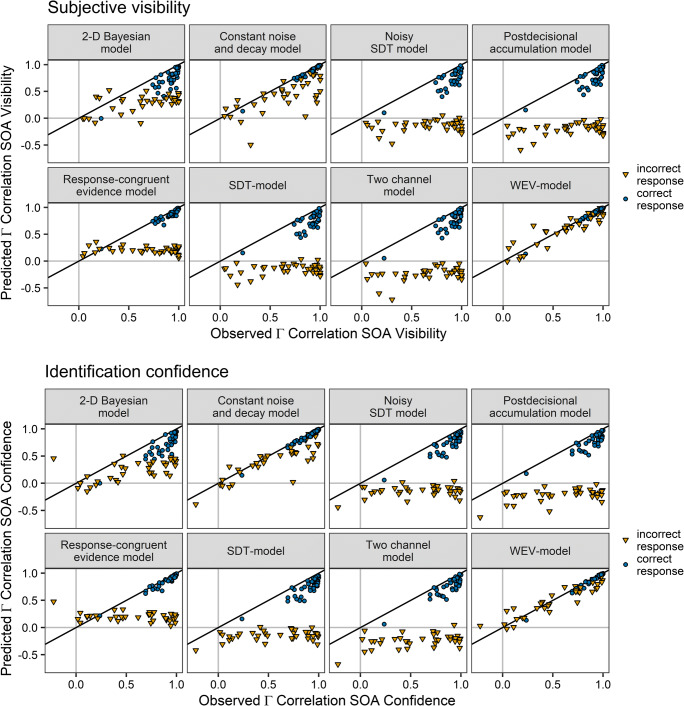
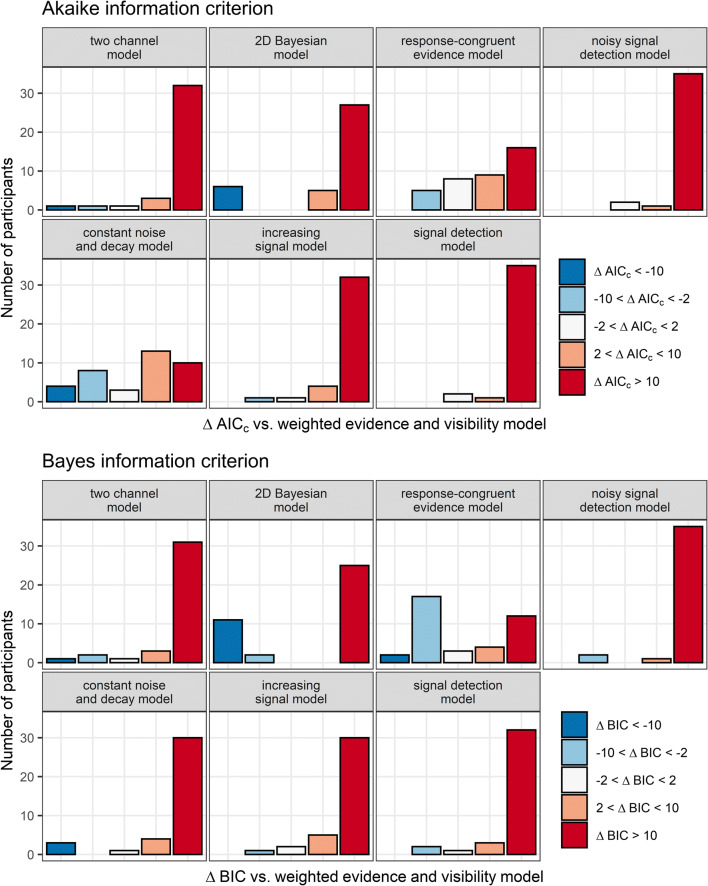
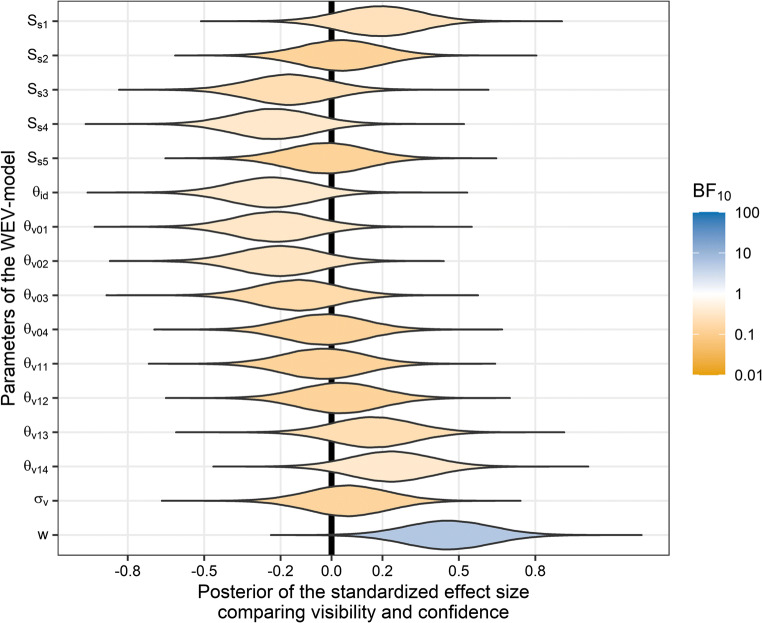
How can we explain the regularities in subjective reports of human observers about their subjective visual experience of a stimulus? The present study tests whether a recent model of confidence in perceptual decisions, the weighted evidence and visibility model, can be generalized from confidence to subjective visibility. In a postmasked orientation identification task, observers reported the subjective visibility of the stimulus after each single identification response. Cognitive modelling revealed that the weighted evidence and visibility model provided a superior fit to the data compared with the standard signal detection model, the signal detection model with unsystematic noise superimposed on ratings, the postdecisional accumulation model, the two-channel model, the response-congruent evidence model, the two-dimensional Bayesian model, and the constant noise and decay model. A comparison between subjective visibility and decisional confidence revealed that visibility relied more on the strength of sensory evidence about features of the stimulus irrelevant to the identification judgment and less on evidence for the identification judgment. It is argued that at least two types of evidence are required to account for subjective visibility, one related to the identification judgment, and one related to the strength of stimulation.

Keywords: Cognitive modelling; Consciousness; Metacognition; Visibility; Visual awareness.


Figures

Fig. 1
Fig. 1
The weighted evidence and visibility model, adapted to describe visibility. The stimulus varies in two aspects: A feature relevant to the identification judgment (symbolized here as circle and a triangle and a manipulation of stimulus strength (symbolized by the noise dots). The stimulus creates sensory evidence about the shape of the stimulus, but also sensory evidence about the other features of the stimulus (e.g., its size or color), whose strength is informative about the strength of stimulation. The evidence about the identity of the stimulus is used to make an identification judgment. Visibility judgments are determined based on a combination of sensory evidence about the identity of the stimulus and the strength of evidence about identity-irrelevant features
Fig. 2
Fig. 2
Trial structure of Experiment 1
Fig. 3
Fig. 3
Error rate in the orientation task (left panel) and subjective visibility (right panel) as a function of stimulus-onset asynchrony (x-axis) in Experiment 1. Bars and symbols indicate observed means. Error bars indicate 1 SEM
Fig. 4
Fig. 4
Distribution of subjective visibility depending on stimulus-onset-asynchrony (rows) and accuracy of the identification judgments (columns) in Experiment 1. Symbols show the prediction of the different models based on the sets of parameters identified during model fitting assuming constant variances of the decision variable
Fig. 5
Fig. 5
Gamma correlation coefficients between SOA and visibility derived from the model fits for each of the eight models of confidence in separate panels as a function of the observed gamma correlation coefficients for correct trials (circles) and incorrect trials (triangles). Each symbol represents the data from one participant
Fig. 6
Fig. 6
Model fits to subjective visibility. The different panels depict the frequency of AICc- and BIC differences when the WEV model was compared with each of the seven other models, assuming constant variances of the decision variable. AICc and BIC differences were assorted into categories based on an established guideline for interpretation (Burnham & Anderson, 2002)
Fig. 7
Fig. 7
Trial structure of Experiment 2
Fig. 8
Fig. 8
Error rate in the orientation task (left panel) and confidence versus visibility (right panel) as a function of stimulus-onset asynchrony (x-axis) in Experiment 2. Bars and symbols indicate observed means. Error bars indicate 1 SEM
Fig. 9
Fig. 9
Distribution of subjective visibility (upper panel) and decisional confidence (lower panel) depending on SOA (rows) and accuracy of the response (columns) in Experiment 2. Symbols show the prediction of the different models based on the sets of parameters identified during model fitting
Fig. 10
Fig. 10
Observed gamma correlation coefficients between SOA and visibility as well as between SOA and confidence vs. gamma correlation coefficients derived from the model fits for subjective visibility (Row 1 and 2) and confidence (Row 3 and 4) for the different models in separate panels and for correct trials (circles) and incorrect trials (triangles). Each symbol represents the data from one participant
Fig. 11
Fig. 11
Model fits to subjective visibility. The different panels depict the frequency of AICc- and BIC differences when the WEV model was compared with each of the seven other models assuming constant variances of the decision variable
Fig. 12
Fig. 12
Model fits to identification confidence. The different panels depict the frequency of AICc- and BIC differences when the WEV model was compared with each of the seven other models assuming constant variances of the decision variable
Fig. 13
Fig. 13
Posterior distributions of the standardized effect size of the comparison between visibility and confidence with respect to each parameter of the WEV model. The standardized effect size is the mean difference between the parameters fitted to visibility and the parameters fitted to confidence, divided by the standard deviation of the difference between the parameters fitted to visibility and the parameters fitted to confidence. Colors indicate the strength of evidence in favor (blue) or against (orange) a difference between visibility and confidence
Fig. 14
Fig. 14
Mean relative frequency of observers reporting a degree of visibility above 20% of the scale width in trials when they reported a degree of confidence below 20% (left), compared with the mean probability of observers reporting a degree of confidence above 20% of the scale width in trials when they reported a degree of visibility below 20% (right). The line indicates the prediction of the WEV model with the assumption that only the w-parameter was different between visibility and confidence. Error bars indicate 1 SEM

Similar articles

Cited by

References

    1. Adler WT, Ma WJ. Limitations of proposed signatures of Bayesian confidence. Neural Computation. 2018;30(12):3327–3354. doi: 10.1162/neco_a_01141. - DOI - PubMed
    1. Aitchison L, Bang D, Bahrami B, Latham PE. Doubly Bayesian analysis of confidence in perceptual decision-making. PLOS Computational Biology. 2015;11(10):Article e1004519. doi: 10.1371/journal.pcbi.1004519. - DOI - PMC - PubMed
    1. Akaike H. A new look at the statistical model identification. IEEE Transactions on Automatic Control, AC. 1974;19(6):716–723. doi: 10.1007/978-1-4612-1694-0_16. - DOI
    1. Anzulewicz A, Asanowicz D, Windey B, Paulewicz B, Wierzchoń M, Cleeremans A. Does level of processing affect the transition from unconscious to conscious perception? Consciousness and Cognition. 2015;36:1–11. doi: 10.1016/j.concog.2015.05.004. - DOI - PubMed
    1. Burnham, K. P., & Anderson, D. R. (2002). Model selection and multimodel inference: A practical information-theoretic approach (2nd ed.). Springer.

LinkOut - more resources