. 2021 Aug;43(4):2067-2085.
doi: 10.1007/s11357-021-00395-1. Epub 2021 Jun 5.

Age and sex modify cellular proliferation responses to oxidative stress and glucocorticoid challenges in baboon cells

Affiliations

Age and sex modify cellular proliferation responses to oxidative stress and glucocorticoid challenges in baboon cells

Daniel A Adekunbi et al. Geroscience. 2021 Aug.

Abstract

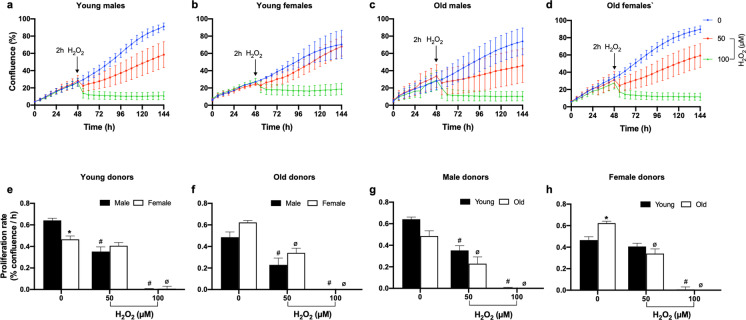
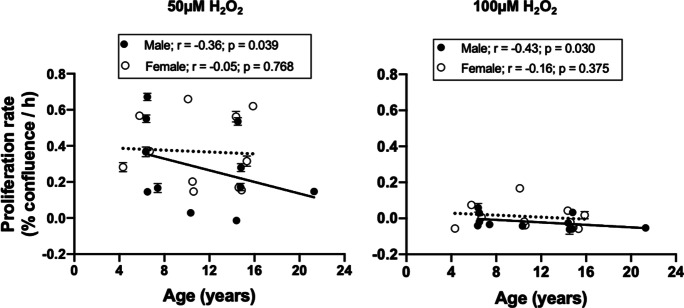
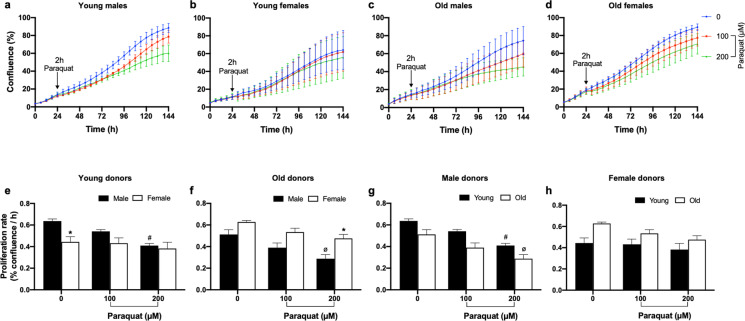
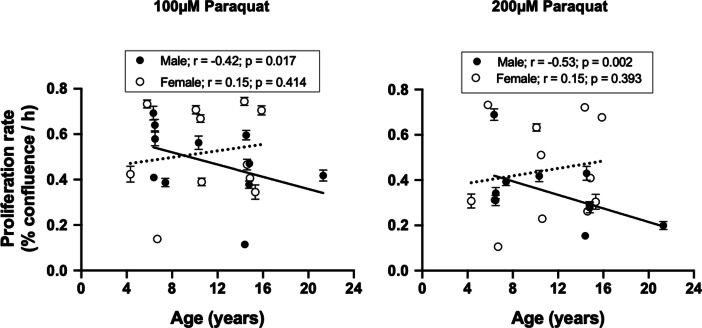
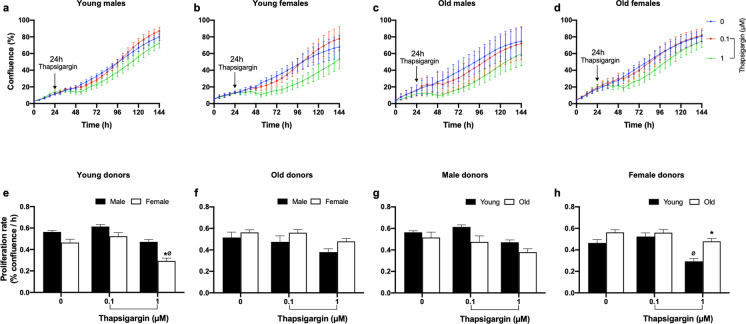
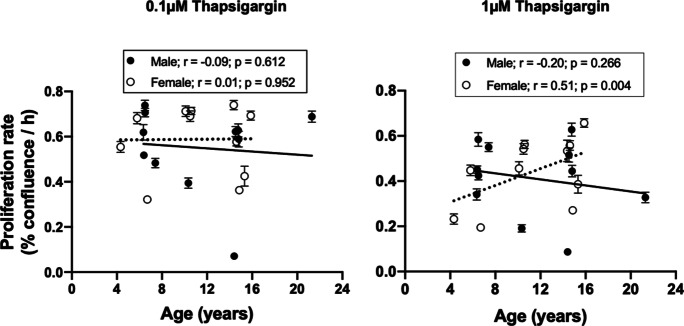
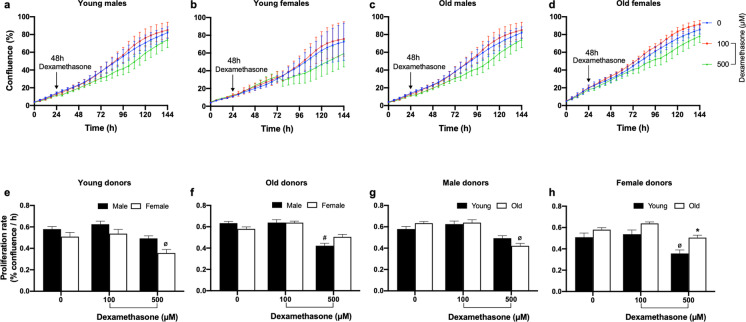
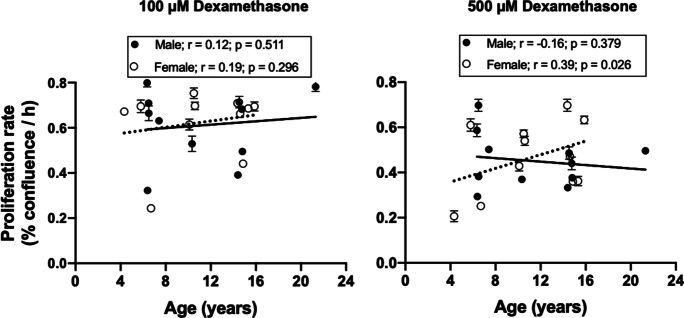
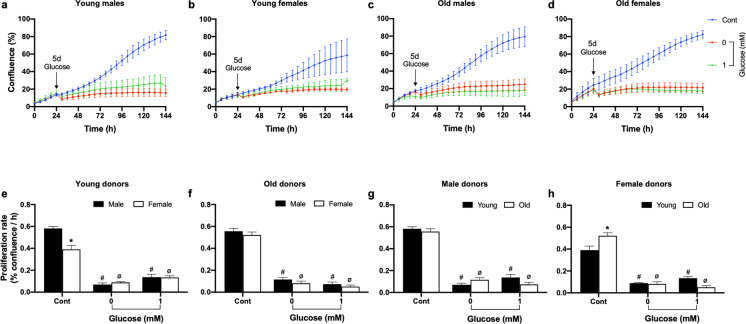
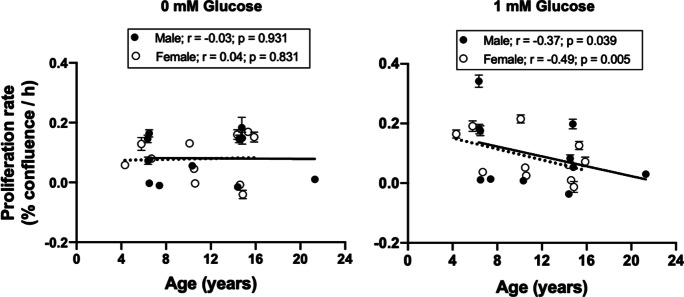
Aging is associated with progressive loss of cellular homeostasis resulting from intrinsic and extrinsic challenges. Lack of a carefully designed, well-characterized, precise, translational experimental model is a major limitation to understanding the cellular perturbations that characterize aging. Here, we tested the feasibility of primary fibroblasts isolated from nonhuman primates (baboons) as a model of cellular resilience in response to homeostatic challenge. Using a real-time live-cell imaging system, we precisely defined a protocol for testing effects of prooxidant compounds (e.g., hydrogen peroxide (H2O2), paraquat), thapsigargin, dexamethasone, and a low glucose environment on cell proliferation in fibroblasts derived from baboons across the life course (n = 11/sex). Linear regression analysis indicated that donor age significantly reduced the ability of cells to proliferate following exposure to H2O2 (50 and 100 µM) and paraquat (100 and 200 µM) challenges in cells from males (6.4-21.3 years; average lifespan 21 years) but not cells from females (4.3-15.9 years). Inhibitory effects of thapsigargin on cell proliferation were dependent on challenge duration (2 vs 24 h) and concentration (0.1 and 1 µM). Cells from older females (14.4-15.9 years) exhibited greater resilience to thapsigargin (1 µM; 24 h) and dexamethasone (500 µM) challenges than did those from younger females (4.3-6.7 years). The cell proliferation response to low glucose (1 mM) was reduced with age in both sexes. These data indicate that donor's chronological age and sex are important variables in determining fibroblast responses to metabolite and other challenges.

Keywords: Aging; Baboon; Cell proliferation; Fibroblast; Oxidative stress; Resilience.


Figures

Fig. 1
Fig. 1
Relationship between donor age and baboon fibroblast cell number. Cells were isolated from 4-mm skin biopsy, cultured, and counted following trypsin digestion. The number of fibroblast cells derived from baboon skin upon reaching a first confluence after isolation, passage 1, and subsequent sequential subcultures, b passage 2, and c passage 3 was plotted against donor age. The number of cells at each passage tended to decline with age (r values are − 0.17, − 0.21, and − 0.22 for passages 1, 2, and 3, respectively, p > 0.05). d Population doubling time from passages 1 (P1) to 2 (P2) and e from P2 to P3. There was no relationship between population doubling time and donor age. Black rounded dots represent cell count or population doubling time from individual male and female baboons, donor age: 4.3–21.3 years, n = 34–35
Fig. 2
Fig. 2
Effect of seeding density on passage 4 baboon fibroblast proliferation. a Time-course graph of varying cell seeding density on fibroblast proliferation. Cell confluence (%) was monitored with the IncuCyte live-cell imaging system which quantifies cell surface area over time. The IncuCyte is housed within a standard cell culture incubator maintained at 37 °C, 3% O2, and 5% CO2. Cell proliferation following seeding densities of 250, 500, 1000, 2000, 4000, 5000, and 10,000 cells per well is represented by blue, red, green, purple, orange, black, and brown lines, respectively. b Proliferation rate determined from the slope of the time-course graph between 12 and 72 h was influenced by cell seeding density. c Representative images showing fibroblast proliferation at 72-h time point after seeding varying cell densities. Representative fibroblasts photomicrographs were obtained from a young male (6.4 years) baboon, scale bar; 200 µm. Image area analyzed is 0.57 mm2 per image. Data are expressed as mean ± SEM, each data point represents 3 replicate wells for each animal, n = 2, males, aged 6.40–6.50 years, *p < 0.05, ns = not significant
Fig. 3
Fig. 3
Effect of H2O2 on proliferation of baboon fibroblasts at passage 4. Fibroblasts were derived from young and old baboons of both sexes. a–d Kinetic profile of fibroblast cell confluence (%) in response to 50- and 100-µM H2O2 challenge for 2 h (red and green lines, respectively). The blue line represents untreated cells (designated as 0). Time-course changes in cell confluence were monitored real time with the IncuCyte live-cell imaging system housed within a cell culture incubator (3% O2, 5% CO2 at 37 °C). Arrow points to the time when H2O2 was added to the cells. e–h Proliferation rate (% confluence/h) calculated from the slope of the corresponding kinetic graph between 78 and 144 h. H2O2 challenge inhibited cell proliferation in a concentration-dependent manner. Closed bars represent male or young donors, while open bars represent female or old donors. Proliferation rate was analyzed using two-way ANOVA. Data expressed as mean ± SEM, each data point represents 3 replicate wells for each animal, 2000 cells/well, donor age in years; young males (6.34–7.4), n = 5, old males (14.5–14.8), n = 4, young females (4.3–6.7), n = 3; old females (14.4–15.9), n = 5, *p < 0.05 vs young male or female donors, #p < 0.05 vs untreated cells of male or young donors, øp < 0.05 vs untreated cells of female or old donors
Fig. 4
Fig. 4
Linear regression of baboon fibroblast proliferation rate in response to H2O2 against chronological age. Passage 4 fibroblast proliferation rate in the presence of 50- and 100-µM H2O2 challenge fell with age in males (50 µM; r =  − 0.36, p = 0.039; 100 µM; r =  − 0.42, p = 0.030) but not females (r =  − 0.05 and − 0.16 for 50- and 100-µM H2O2, respectively, p > 0.05). Proliferation rate was determined by the slope of the IncuCyte time-course cell confluence graph between 78 and 144 h following 2-h H2O2 challenge. Black circles represent individual males, while white circles are for individual females. Solid line refers to linear regression for males and dashed line for females. Data are from triplicate measurements and expressed as mean ± SEM. Donor age: males, 6.4–21.3 years; females, 4.30–15.9 years; n = 11/sex
Fig. 5
Fig. 5
Effect of paraquat on baboon fibroblast proliferation at passage 4. a–d Cell proliferation time-course graph of fibroblasts challenged with paraquat (PQ) for 2 h. Red and green lines represent cell confluence (%) in fibroblasts challenged with 100- and 200-µM PQ, respectively. Untreated cells are represented by the blue line. Arrow points to the commencement of PQ challenge in fibroblasts derived from young and old baboon of both sexes. Cell confluence kinetics were determined with the IncuCyte live-cell imaging system housed within a standard cell culture incubator. e–h Fibroblast proliferation rate (% confluence/h) calculated using the slope of the time-course graph between 30 and 144 h after PQ challenge. Proliferation rate was analyzed using two-way ANOVA. The inhibitory effects of PQ were concentration-dependent, particularly in male donors. Data expressed as mean ± SEM, each data point represents 3 replicate wells for each animal, 2000 cells/well, donor age in years; young males (6.4–7.4), n = 5, old males (14.5–14.8), n = 4, young females (4.3–6.7), n = 3; old females (14.4–15.9), n = 5, *p < 0.05 vs young or old male donors, #p < 0.05 vs untreated cells of young male donors, øp < 0.05 vs untreated cells of old male donors
Fig. 6
Fig. 6
Association between donor age and baboon fibroblast proliferation rate in response to paraquat challenge. Passage 4 cells were challenged with paraquat (100 and 200 µM) for 2 h. Proliferation rate was determined by the slope of the IncuCyte time-course cell confluence graph between 30 and 144 h following paraquat challenge. A negative relationship was observed between donor age and proliferation rate in response to paraquat challenge in male baboons (100 µM; r =  − 0.42, p = 0.017; 200 µM; r =  − 0.53, p = 0.002) but not females (r = 015 for both 100 and 200 µM paraquat, p > 0.05). Black circles represent individual males, while white circles are for individual females. Solid line refers to linear regression for males and dashed line for females. Data are from triplicate measurements and expressed as mean ± SEM. Donor age: males, 6.4–21.3 years; females, 4.3–15.9 years; n = 11/sex
Fig. 7
Fig. 7
Effect of thapsigargin on baboon fibroblast proliferation rate at passage 4. a–d Time-course graph for the effect of thapsigargin on cell confluence (%) of fibroblasts derived from young and old baboons of both sexes. Cells were challenged with 0.1- and 1-µM thapsigargin for 24 h and changes in cell confluence were determined real time using the IncuCyte live-cell imaging system housed within a standard cell culture incubator. Arrow indicates the commencement of thapsigargin challenge. The blue line represents untreated cells (designated as 0); red and green lines represent cells challenged with 0.1- and 1-µM thapsigargin, respectively. e–h Proliferation rate (% confluence/h) calculated from the slope of the time-course graph between 60 and 144 h following thapsigargin challenge and analyzed using two-way ANOVA. Proliferation rate of young female baboon-derived fibroblasts was significantly inhibited by 1-µM thapsigargin challenge compared to that of young males and old females. Data expressed as mean ± SEM, each data point represents 3 replicate wells for each animal, 2000 cells/well, donor age in years; young males (6.34–7.4), n = 5, old males (14.5–14.8), n = 4, young females (4.3–6.7), n = 3; old females (14.4–15.9), n = 5, *p < 0.05 vs young male or female donors, øp < 0.05 vs untreated cells of young female donors
Fig. 8
Fig. 8
Relationship between donor age and baboon fibroblast proliferation rate in response to thapsigargin challenge. Passage 4 cells were challenged with 0.1- and 1-µM thapsigargin for 24 h. Proliferation rate was determined by the slope of the IncuCyte time-course cell confluence graph between 60 and 144 h following thapsigargin challenge. Thapsigargin (1 µM) significantly inhibited the proliferation of fibroblasts derived from younger female baboons without affecting older females resulting in a positive relationship between donor age and proliferation rate (r = 0.51; p = 0.004). Black circles represent individual males, while white circles are for individual females. Solid line refers to linear regression for males and dashed line for females. Data are from triplicate measurements and expressed as mean ± SEM. Donor age: males, 6.4–21.3 years; females, 4.3–15.9 years
Fig. 9
Fig. 9
Dexamethasone effect on proliferation of baboon fibroblasts at passage 5. a–d Kinetic profile of fibroblast cell confluence (%) in response to 48-h dexamethasone (Dex, 100 and 500 µM) challenge. Untreated cells are represented by blue line, while red and green lines represent cells challenged with 100- and 500-µM Dex, respectively. Arrow points to commencement of Dex challenge and changes in cell confluence were determined with the IncuCyte live-cell imaging system. e–h Baboon fibroblast proliferation rate (% confluence/h) calculated from the slope of the time-course graph between 78 and 144 h after 48-h Dex challenge. Proliferation rate was analyzed using two-way ANOVA. Fibroblasts derived from young female baboons exhibited decreased proliferation rate in the presence of 500-µM Dex challenge compared to fibroblasts from old females. Similarly, older males had reduced proliferation rate in response to 500-µM Dex challenge, whereas young males were not affected. Data expressed as mean ± SEM, each data point represents 3 replicate wells of each animal, 2000 cells/well, donor age in years; young males (6.34–7.4), n = 5, old males (14.5–14.8), n = 4, young females (4.3–6.7), n = 3; old females (14.4–15.9), n = 5, *p < 0.05 vs young female donors, #p < 0.05 vs untreated cells of old male donors, øp < 0.05 vs untreated cells of young male or female donors
Fig. 10
Fig. 10
Relationship between donor age and baboon fibroblast proliferation rate in response to dexamethasone challenge. Passage 5 cells were challenged with dexamethasone (100 and 500 µM) for 48 h. Proliferation rate was determined in a time-course measurement of cell confluence between 78 and 144 h following dexamethasone challenge. Dex (500 µM) significantly inhibited the proliferation of fibroblast derived from younger female baboons without affecting the older females, leading to a positive relationship between donor age and proliferation rate (r = 0.39, p = 0.026). Black circles represent male data, while white circles are for female data. Solid line refers to linear regression for males and dash line for females. Data are from triplicate measurements and expressed as mean ± SEM. Donor age: males, 6.4–21.3 years; females, 4.3–15.9 years
Fig. 11
Fig. 11
Effect of low glucose on baboon fibroblast proliferation at passage 5. a–d Time-course graph of baboon fibroblast cell confluence (%) in response to glucose deprivation and low glucose concentration (1 mM). Arrow points to the commencement of glucose challenge for 5 days in fibroblasts derived from young and old baboon of both sexes. Unchallenged cells are represented by a blue line, while red and green lines represent cells challenged with 0- and 1-mM glucose, respectively. Fibroblasts cell confluence was determined with the IncuCyte live-cell imaging system. e–h Proliferation rate (% confluence/h) calculated from the slope of the corresponding time-course graph during glucose challenge between 30 and 144 h. Proliferation rate was analyzed using two-way ANOVA. Glucose deprivation (0-mM glucose) and 1-mM glucose inhibited cell proliferation rate without age and sex differences. Data expressed as mean ± SEM, each data point represents 3 replicate wells, 2000 cells/well, donor age in years; young males (6.34–7.4), n = 5, old males (14.5–14.8), n = 4, young females (4.3–6.7), n = 3; old females (14.4–15.9), n = 5, *p < 0.05 vs young male or female donors, #p < 0.05 vs untreated cells of male or young donors, øp < 0.05 vs untreated cells of female or old donors
Fig. 12
Fig. 12
Linear regression analysis of baboon fibroblast proliferation rate in response to low glucose environment and donor age. Passage 6 cells were challenged with 0- and 1-µM glucose for 5 d. Fibroblast proliferation rate was determined by the slope of the IncuCyte time-course cell confluence graph following the glucose challenge. There was a negative relationship between donor age and proliferation rate of male and female fibroblasts in response to 1-mM glucose (male; r =  − 0.37, p = 0.039, female; r =  − 0.49, p = 0.005) but no relationship was observed in response to 0 mM glucose (male; r =  − 0.03, female; r = 0.04, p > 0.05). Black circles represent individual males while white circles are for individual females. Solid line refers to linear regression for males and dashed line for females. Data are from triplicate measurements and expressed as mean ± SEM. Donor age: males, 6.4–21.3 years; females, 4.3–15.9 years

Similar articles

Cited by

References

    1. Lopez-Otin C, Blasco MA, Partridge L, Serrano M, Kroemer G. The hallmarks of aging. Cell. 2013;153(6):1194–1217. doi: 10.1016/j.cell.2013.05.039. - DOI - PMC - PubMed
    1. Sapolsky R, Armanini M, Packan D, Tombaugh G. Stress and glucocorticoids in aging. Endocrinol Metab Clin North Am. 1987;16(4):965–980. doi: 10.1016/S0889-8529(18)30453-5. - DOI - PubMed
    1. Rubin H. Cell aging in vivo and in vitro. Mech Ageing Dev. 1997;98(1):1–35. doi: 10.1016/s0047-6374(97)00067-5. - DOI - PubMed
    1. Park WH. The effects of exogenous H2O2 on cell death, reactive oxygen species and glutathione levels in calf pulmonary artery and human umbilical vein endothelial cells. Int J Mol Med. 2013;31(2):471–476. doi: 10.3892/ijmm.2012.1215. - DOI - PubMed
    1. Lytton J, Westlin M, Hanley MR. Thapsigargin inhibits the sarcoplasmic or endoplasmic reticulum Ca-ATPase family of calcium pumps. J Biol Chem. 1991;266(26):17067–17071. doi: 10.1016/S0021-9258(19)47340-7. - DOI - PubMed

Publication types