. 2021 Sep;30(9):1818-1832.
doi: 10.1002/pro.4134.

NF-κB Rel subunit exchange on a physiological timescale

Affiliations

NF-κB Rel subunit exchange on a physiological timescale

Matthew Biancalana et al. Protein Sci. 2021 Sep.

Abstract

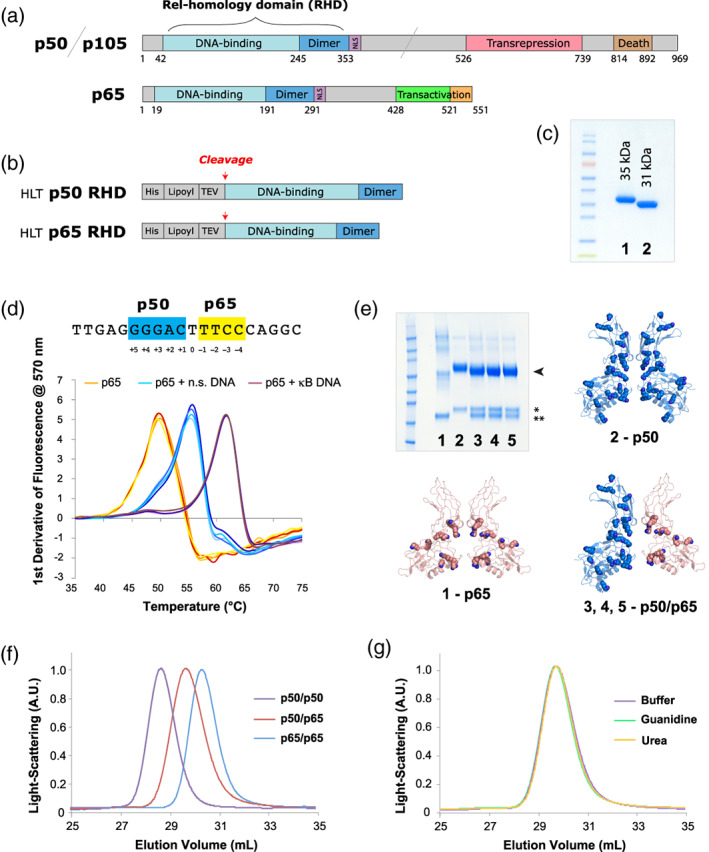
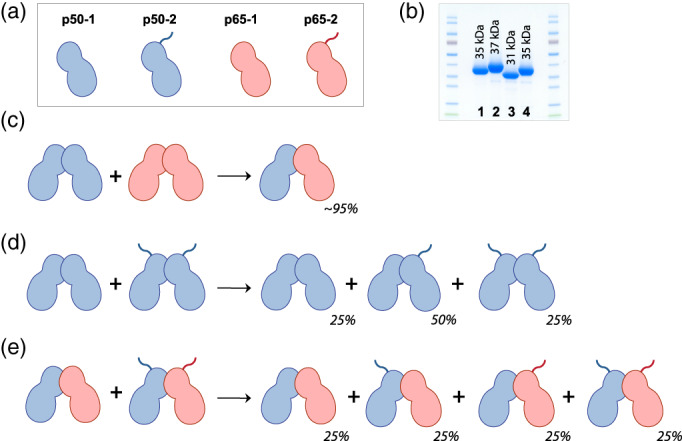
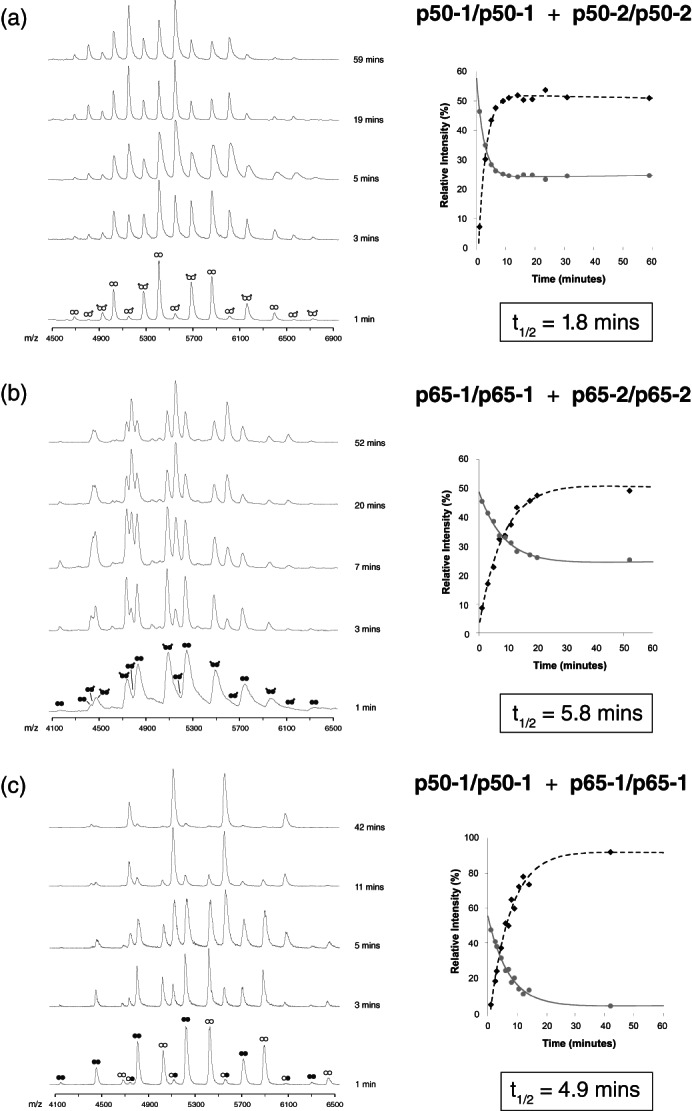
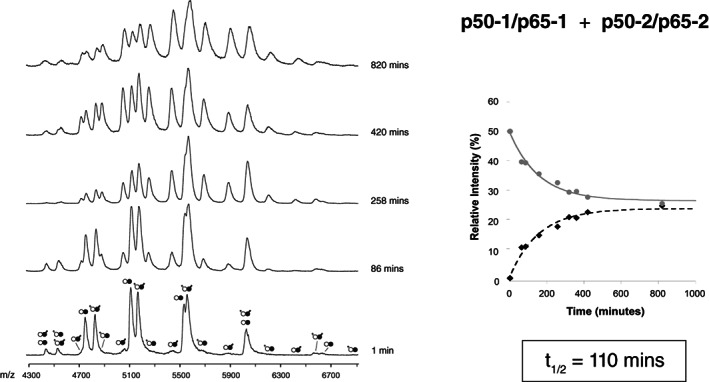
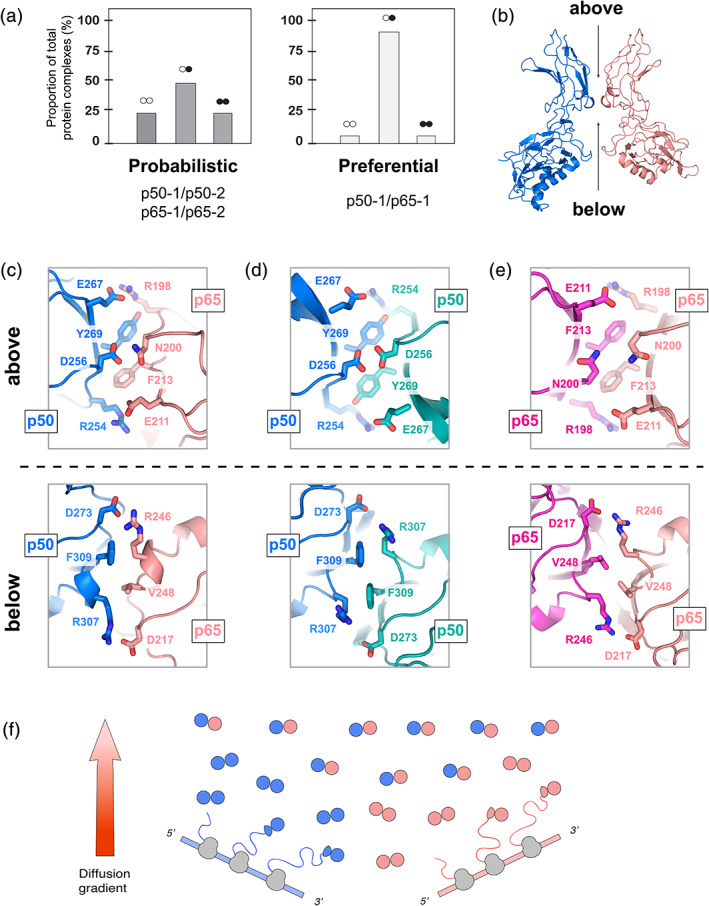
The Rel proteins of the NF-κB complex comprise one of the most investigated transcription factor families, forming a variety of hetero- or homodimers. Nevertheless, very little is known about the fundamental kinetics of NF-κB complex assembly, or the inter-conversion potential of dimerised Rel subunits. Here, we examined an unexplored aspect of NF-κB dynamics, focusing on the dissociation and reassociation of the canonical p50 and p65 Rel subunits and their ability to form new hetero- or homodimers. We employed a soluble expression system to enable the facile production of NF-κB Rel subunits, and verified these proteins display canonical NF-κB nucleic acid binding properties. Using a combination of biophysical techniques, we demonstrated that, at physiological temperatures, homodimeric Rel complexes routinely exchange subunits with a half-life of less than 10 min. In contrast, we found a dramatic preference for the formation of the p50/p65 heterodimer, which demonstrated a kinetic stability of at least an order of magnitude greater than either homodimer. These results suggest that specific DNA targets of either the p50 or p65 homodimers can only be targeted when these subunits are expressed exclusively, or with the intervention of additional post-translational modifications. Together, this work implies a new model of how cells can modulate NF-κB activity by fine-tuning the relative proportions of the p50 and p65 proteins, as well as their time of expression. This work thus provides a new quantitative interpretation of Rel dimer distribution in the cell, particularly for those who are developing mathematical models of NF-κB activity.

Keywords: DNA binding; NF-kappaB; NF-κB; Rel proteins; native mass spectrometry; protein complex; protein dynamics; protein-protein interaction; subunit exchange; transcription factor.


Conflict of interest statement

The authors declare no competing or conflicting interests.

Figures

FIGURE 1
FIGURE 1
Recombinant proteins used in this work. (a) The full‐length variants of p50/p105 and p65. (b) The HLT fusion proteins used for expression and purification. (c) SDS‐PAGE gel of purified samples. (All samples used in this figure were the first‐generation constructs, for example, p50‐1 RHD and p65‐1 RHD, described here briefly as p50 RHD and p65 RHD.): 1–p50 RHD, 2–p65 RHD. (d) Nucleotide binding by NF‐κB. The sequence of the canonical p50/p65 heterodimer Ig‐like binding site is shown with the p50 half‐site in blue and the p65 half‐site in yellow. Below are shown DSF temperature melts of the p65 RHD subunits of NF‐κB (with each condition showing four repeats, in slight variations of the colors listed below). p65 RHD was heat‐denatured in 50 mM NaCl buffer in the absence of oligonucleotides (orange), presence of heparin or nonspecific DNA (cyan), and presence of specific κB site DNA (purple). Four repeats of each melt (varying shades of the colors above) are shown. (e) SDS‐PAGE of crosslinked samples of various RHD preparations, stained with Coomassie blue: 1–p65 RHD, 2–p50 RHD, 3–p50/p65 RHD mixed in buffer, 4–p50/p65 RHD refolded from urea denaturation, 5–p50/p65 RHD refolded from GuHCl denaturation. The bands corresponding to dimeric crosslinked species are indicated with an arrowhead, and the isolated p50 (*) and p65 (**) monomers are indicated with asterisks. The structure of the p50 (blue, PDB ID: 1SVC) and p65 (peach, PDB ID: 2RAM) homodimers, as well as the p50/p65 heterodimer (blue/peach, PDB ID: 1VKX)—all of which have had their corresponding double‐stranded DNA oligos omitted—are shown as cartoon representations, with lysine side chains depicted as spheres. (f) SEC analysis of p50 RHD (purple) and p65 RHD (blue) homodimers, as well as the p50/p65 RHD heterodimer (red). (g) Gel filtration of the heterodimer species generated either by directly mixing the p50 and p65 RHD homodimers (purple), or by denaturing the RHD homodimers in GuHCl (green) or urea (orange), followed by refolding via overnight dialysis into buffer. DSF, differential scanning fluorimetry; GuHCl, guanidinium hydrochloride; HLT, His‐lipoyl‐TEV; RHD, Rel homology domain; SDS‐PAGE, sodium dodecyl sulfate polyacrylamide gel electrophoresis; SEC, size‐exclusion chromatography
FIGURE 2
FIGURE 2
NF‐κB species populations resulting from subunit exchange between Rel dimers. (a) Schematic representation of subunit exchange. Proteins are annotated as either “−1” or “−2” variants based on subtle differences in their amino acid length, as demonstrated in the SDS‐PAGE gels at right: 1–p50‐1 RHD, 2–p50‐2 RHD, 3–p65‐1 RHD, 4–p65‐2 RHD. These polypeptide differences encompass regions outside of the dimerisation domains, and therefore do not affect the association properties of the Rel dimers. RHD, Rel homology domain; SDS‐PAGE, sodium dodecyl sulfate polyacrylamide gel electrophoresis
FIGURE 3
FIGURE 3
Subunit exchange between Rel dimers at 37 °C. (a) ESI‐MS time‐course of subunit exchange between p50‐1/p50‐1 (white circles) and p50‐2/p50‐2 (white circles with tails) RHD homodimers. The panel insert shows the relative populations of each species from 0‐60 minutes. (b) ESI‐MS time‐course of subunit exchange between p65‐1/p65‐1 (black circles) and p65‐2/p65‐2 (black circles with tails) RHD homodimers. The panel insert shows the relative populations of each species from 0‐60 minutes. (c) ESI‐MS time‐course of subunit exchange between p50‐1/p50‐1 (white circles) and p65‐1/p65‐1 (black circles) RHD homodimers. The panel insert shows the relative populations of each species from 0‐60 minutes. For Figure 3a‐c, note that values obtained for the homodimeric species have been averaged to generate the decay curve. ESI, electrospray ionization; MS, mass spectrometry; RHD, Rel homology domain
FIGURE 4
FIGURE 4
Subunit exchange between Rel dimers at 37 °C. ESI‐MS time‐course of subunit exchange between p50‐1/p65‐1 (white and black circles) and p50‐2/p65‐2 (white circles with tails and black circles with tails) RHD heterodimers. The panel insert shows the relative populations of each species from 0‐1000 minutes. Note that values obtained for the p50‐1/p65‐1 and p50‐2/p65‐2 heterodimeric species have been averaged to generate the decay curve, and that values obtained for the p50‐1/p65‐2 and p50‐2/p65‐1 heterodimeric species have been averaged to generate the corresponding growth curve. ESI, electrospray ionization; MS, mass spectrometry; RHD, Rel homology domain
FIGURE 5
FIGURE 5
Subunit exchange between Rel species dramatically favors heterodimer formation. (a) The expected and observed population proportions are shown as a percentage of the aggregate populations. (b) Interface between the dimerisation domains of p50 (left, blue) and p65 (right, peach) in the structure of the p50/p65 heterodimer (PDB: 1VKX). The corresponding double‐stranded DNA oligo is omitted. Opposite faces of the dimerisation interface are shown from above (top) and from below (bottom). for the following: (c) p50/p65 (PDB ID: 1VKX), (d) p50/p50 (PDB ID: 1SVC), (e) p65/p65 (PDB ID: 2RAM). (f) Model of the apparent preference for the p50/p65 heterodimer, showing that (in the absence of further polypeptide modification or sequestration), the heterodimeric species should comprise the majority of cellular species after even modest diffusion away from sites of translation. p50 is represented in blue, and p65 is represented in peach

References

    1. Ghosh S. Handbook of transcription factor NF‐kappaB. Boca Raton: CRC Press; 2007.
    1. Gilmore TD. Introduction to NF‐κB: Players, pathways, perspectives. Oncogene. 2006;25:6680–6684. - PubMed
    1. Sen R, Baltimore D. Inducibility of kappa immunoglobulin enhancer‐binding protein Nf‐kappa B by a posttranslational mechanism. Cell. 1986;47:921–928. - PubMed
    1. Sen R, Baltimore D. Multiple nuclear factors interact with the immunoglobulin enhancer sequences. Cell. 1986;46:705–716. - PubMed
    1. Perkins ND. Integrating cell‐signalling pathways with NF‐κB and IKK function. Nat Rev Mol Cell Biol. 2007;8:49–62. - PubMed

Publication types

MeSH terms