. 2021 Dec;99(12):1240-1249.
doi: 10.1002/cyto.a.24465. Epub 2021 Jun 5.

Discovering fiber type architecture over the entire muscle using data-driven analysis

Affiliations

Discovering fiber type architecture over the entire muscle using data-driven analysis

Davide Bindellini et al. Cytometry A. 2021 Dec.

Abstract

Skeletal muscle function is inferred from the spatial arrangement of muscle fiber architecture, which corresponds to myofiber molecular and metabolic features. Myofiber features are often determined using immunofluorescence on a local sampling, typically obtained from a median region. This median region is assumed to represent the entire muscle. However, it remains largely unknown to what extent this local sampling represents the entire muscle. We present a pipeline to study the architecture of muscle fiber features over the entire muscle, including sectioning, staining, imaging to image quantification and data-driven analysis with Myofiber type were identified by the expression of myosin heavy chain (MyHC) isoforms, representing contraction properties. We reconstructed muscle architecture from consecutive cross-sections stained for laminin and MyHC isoforms. Examining the entire muscle using consecutive cross-sections is extremely laborious, we provide consideration to reduce the dataset without loosing spatial information. Data-driven analysis with over 150,000 myofibers showed spatial variations in myofiber geometric features, myofiber type, and the distribution of neuromuscular junctions over the entire muscle. We present a workflow to study histological changes over the entire muscle using high-throughput imaging, image quantification, and data-driven analysis. Our results suggest that asymmetric spatial distribution of these features over the entire muscle could impact muscle function. Therefore, instead of a single sampling from a median region, representative regions covering the entire muscle should be investigated in future studies.

Keywords: data-driven analysis; muscle architecture; myofiber type; quantitative image analysis.


Conflict of interest statement

All authors declare no conflict of interest.

Figures

FIGURE 1
FIGURE 1
A methodological summary of myofiber data collection and analysis. The workflow of the transverse sections is shown on the left side: wet‐lab procedures, imaging, image processing, segmentation, and scaling and tissue exclusion are all categorized as dataset generation. Data‐driven analysis of myofiber features over the entire muscle. The asymmetric distribution of myofibers and expression of markers were verified in the longitudinal sections
FIGURE 2
FIGURE 2
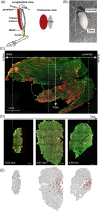
A summary of tibialis anterior imaging. (A) A schematic representation of the TA anatomy in longitudinal and transverse views. The tibia is depicted in dark gray, the TA muscle in dark red, and the tendon in yellow. (B) An image of a TA muscle before sectioning. Proximal and distal ends are denoted. (C,D) Representative stitched images from longitudinal (C) and cross‐sectional sections (D) immunofluorescence staining with MyHC‐2B (green), MyHC‐2A (red), and laminin (white). Muscle positions are denoted. Dashed white lines show corresponding positions between the longitudinal and the cross‐sections. The curved white arrow in C depicts the area that detached during sectioning. The scale bars are 1000 μm. (E) Images show segmentation of the stained images in (D). Fiber segmentation is in black lines and the 2A‐positive fibers are in red [Color figure can be viewed at wileyonlinelibrary.com]
FIGURE 3
FIGURE 3
Alignment overlay of three cross‐sections in three muscle regions. (A) Images of individual muscle cross‐sections after fiber segmentation. (B) the alignment overlay results. The distal–proximal axis in (A) is across the three sections. The side facing the tibia is depicted in (B). In the overlay image, myofibers in red, green or blue, mark the 2A‐positive fibers in the distal, middle or proximal section, respectively. Overlap of lamina segmentation is seen with a higher intensity and overlapping 2A‐positibe fibers are brown. Examples of regions with overlapping myofibers are encircled with a dashed line. Positions of the sections over the longitudinal axis and depth of every three sections (Z) are denoted [Color figure can be viewed at wileyonlinelibrary.com]
FIGURE 4
FIGURE 4
Analysis of muscle fiber features over the TA muscle. (A–E) Scatter plots of fiber measurers: CSA (blue) and circularity (red). In (A,B) median CSA or median circularity are plotted together with the number of fibers. Every dot represents a single cross‐section. The variance of CSA or circularity is depicted in pink or green, respectively. Cross‐sections are positioned in chronological order from distal to proximal ends (x‐axis, in μm). The smoothed regression lines (curved lines) show major changes over the muscle. Dashed lines mark regions defined by the regression lines. Regions (r) 1 and 2 are defined by the median CSA (C). The r1 is split into r1 and r1/2 based on circularity (D). The r3 is further defined by both CSA and circularity (E). (F) A summary of region definition using CSA and circularity [Color figure can be viewed at wileyonlinelibrary.com]
FIGURE 5
FIGURE 5
Analysis of muscle fiber type and NMJs over the TA muscle. (A) Density plot of MyHC‐2B (upper row) and MyHC 2A (lower row) mean fluorescence intensity (MFI) in the pooled data (combined sections) or per region (r1, r1/2, r2, r3, as defined in Figure 4(E)). Positive and negative fibers are defined by the MFI distribution in the pooled data, and the same threshold, depicted with a dashed line, was used for all regions. The number of 2A‐negative or positive fibers are depicted in black or red, respectively in each plot. The range of each region (in mm) is indicated above the plots. (B) A representative immunofluorescence image of a longitudinal section stained with Alexa‐488‐conjugated α‐bungarotoxin, marking NMJs. An example of NMJs obtained with a 20X objective is depicted in the white rectangle. Examples of NMJs are depicted with an arrowhead. The estimated regions are depicted with dotted lines. The area of the regions was calculated in proportion to the regions in A. The average NMJs (rounded numbers) per region is depicted. The scale bar is 1 mm. Dashed lines mark the estimated muscle regions. (C) A summary of the % of myofibers per region, the % of 2A‐positive fibers, NMJs percentage from the total counts, and the number of NMJs corrected to the region area (mm2) [Color figure can be viewed at wileyonlinelibrary.com]

References

    1. Siebert T, Tomalka A, Stutzig N, Leichsenring K, Böl M. Changes in three‐dimensional muscle structure of rabbit gastrocnemius, flexor digitorum longus, and tibialis anterior during growth. J Mech Behav Biomed Mater. 2017;74:507–19. - PubMed
    1. Siparsky PN, Kirkendall DT, Garrett WE Jr. Muscle changes in aging: understanding sarcopenia. Sports Health. 2014;6:36–40. 10.1177/1941738113502296 - DOI - PMC - PubMed
    1. Otten E. Concepts and models of functional architecture in skeletal muscle. Exerc Sport Sci Rev. 1988;16:89–137. - PubMed
    1. Lieber Richard L, Ward SR. Skeletal muscle design to meet functional demands. Philos Trans R Soc B. 2011;366:1466–76. 10.1098/rstb.2010.0316 - DOI - PMC - PubMed
    1. Lieber RL, Fridén J. Functional and clinical significance of skeletal muscle architecture. Muscle Nerve. 2000;23:1647–66. https://doi.org/10.1002/1097‐4598(200011)23:11<1647::aid‐mus1>3.0.... - PubMed

Publication types

LinkOut - more resources