

The ATP Level in the mPFC Mediates the Antidepressant Effect of Calorie Restriction
- PMID: 34089507
- PMCID: PMC8423953
- DOI: 10.1007/s12264-021-00726-4
The ATP Level in the mPFC Mediates the Antidepressant Effect of Calorie Restriction
Abstract
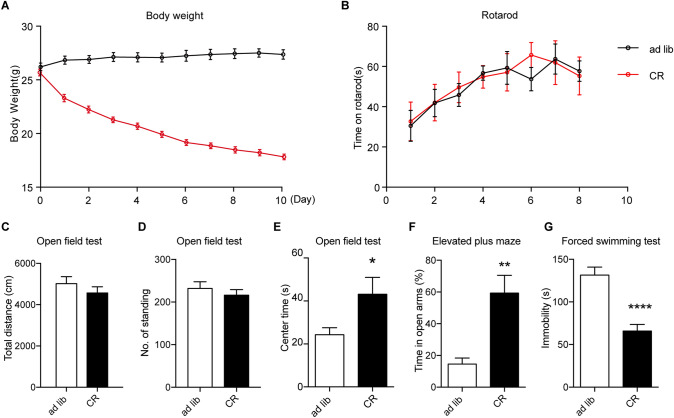
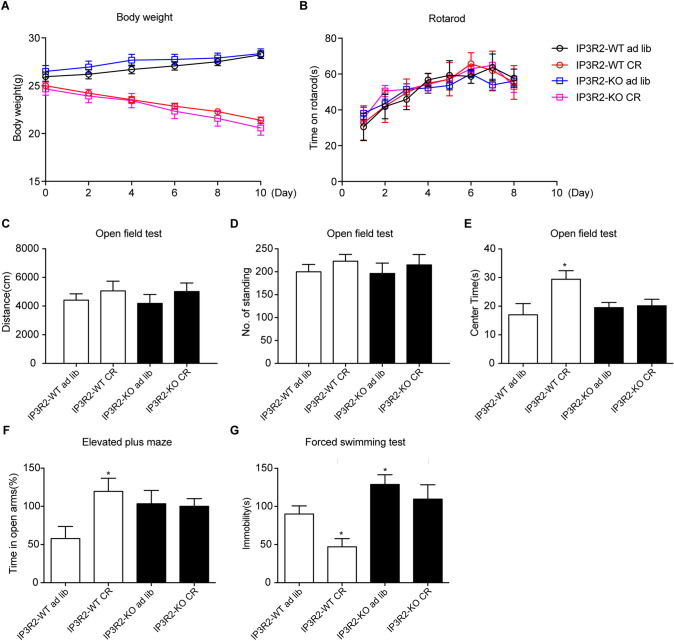
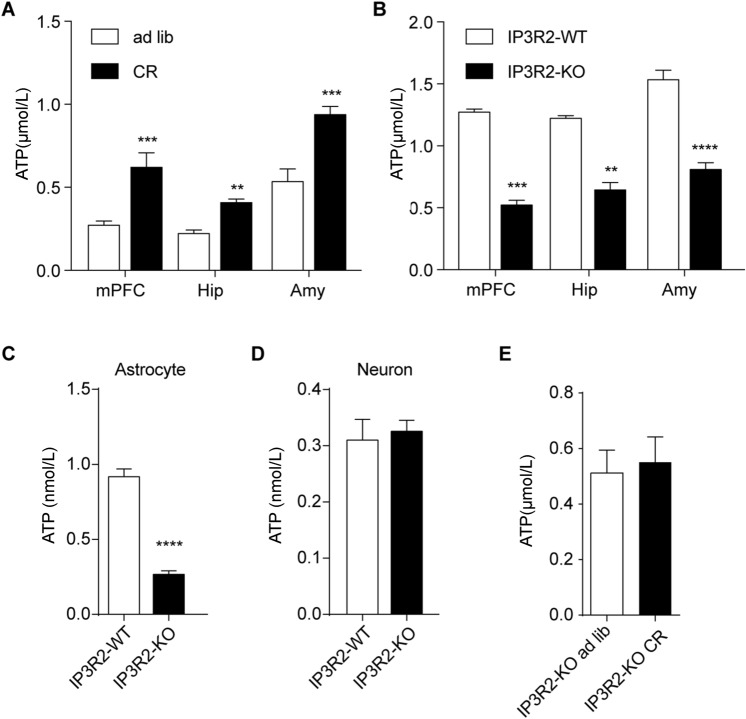
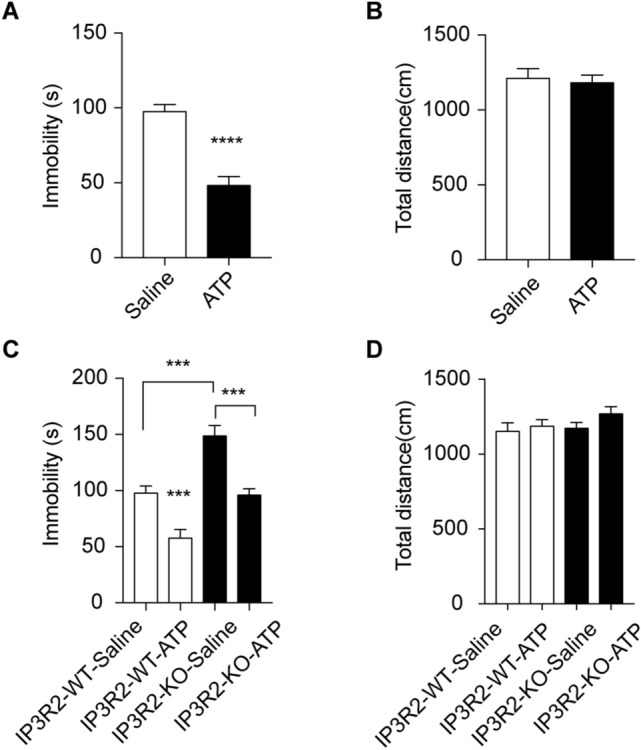
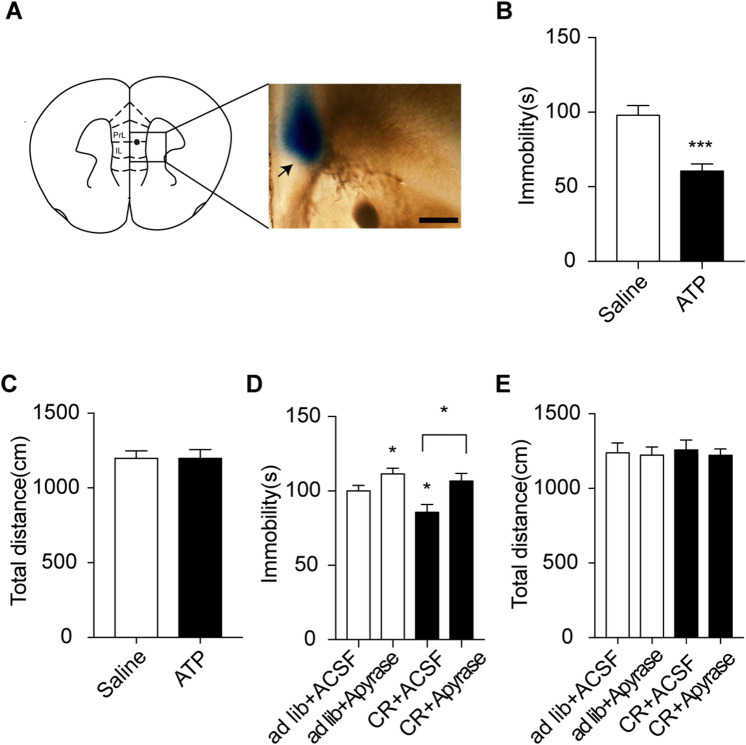
Food deprivation can rescue obesity and overweight-induced mood disorders, and promote mood performance in normal subjects. Animal studies and clinical research have revealed the antidepressant-like effect of calorie restriction, but little is known about the mechanism of calorie restriction-induced mood modification. Previous studies have found that astrocytes modulate depressive-like behaviors. Inositol 1,4,5-trisphosphate receptor type 2 (IP3R2) is the predominant isoform in mediating astrocyte Ca2+ signals and its genetic knockout mice are widely used to study astrocyte function in vivo. In this study, we showed that deletion of IP3R2 blocked the antidepressant-like effect induced by calorie restriction. In vivo microdialysis experiments demonstrated that calorie restriction induced an increase in ATP level in the medial prefrontal cortex (mPFC) in naïve mice but this effect disappeared in IP3R2-knockout mice, suggesting a role of astrocytic ATP in the calorie restriction-induced antidepressant effect. Further experiments showed that systemic administration and local infusion of ATP into the mPFC induced an antidepressant effect, whereas decreasing ATP by Apyrase in the mPFC blocked calorie restriction-induced antidepressant regulation. Together, these findings support a role for astrocytic ATP in the antidepressant-like effect caused by calorie restriction.
Keywords: ATP; Astrocyte; Calorie restriction; Depression; IP3R2.
© 2021. Center for Excellence in Brain Science and Intelligence Technology, Chinese Academy of Sciences.
Conflict of interest statement
The authors declare no competing interests.
Figures
Similar articles
-
The ATP Level in the Medial Prefrontal Cortex Regulates Depressive-like Behavior via the Medial Prefrontal Cortex-Lateral Habenula Pathway.Biol Psychiatry. 2022 Aug 1;92(3):179-192. doi: 10.1016/j.biopsych.2022.02.014. Epub 2022 Feb 22. Biol Psychiatry. 2022. PMID: 35489874
-
Astrocytic Epoxyeicosatrienoic Acid Signaling in the Medial Prefrontal Cortex Modulates Depressive-like Behaviors.J Neurosci. 2019 Jun 5;39(23):4606-4623. doi: 10.1523/JNEUROSCI.3069-18.2019. Epub 2019 Mar 22. J Neurosci. 2019. PMID: 30902874 Free PMC article.
-
Astrocyte-specific activation of sigma-1 receptors in mPFC mediates the faster onset antidepressant effect by inhibiting NF-κB-induced neuroinflammation.Brain Behav Immun. 2024 Aug;120:256-274. doi: 10.1016/j.bbi.2024.06.008. Epub 2024 Jun 8. Brain Behav Immun. 2024. PMID: 38852761
-
Effect of caloric restriction on depression.J Cell Mol Med. 2018 May;22(5):2528-2535. doi: 10.1111/jcmm.13418. Epub 2018 Feb 21. J Cell Mol Med. 2018. PMID: 29465826 Free PMC article. Review.
-
The Effects of Calorie Restriction in Depression and Potential Mechanisms.Curr Neuropharmacol. 2015;13(4):536-42. doi: 10.2174/1570159x13666150326003852. Curr Neuropharmacol. 2015. PMID: 26412073 Free PMC article. Review.
Cited by
-
Regional Gene Expression Patterns are Associated with Functional Connectivity Alterations in Major Depressive Disorder with Anxiety Symptoms.Alpha Psychiatry. 2025 Apr 21;26(2):39865. doi: 10.31083/AP39865. eCollection 2025 Apr. Alpha Psychiatry. 2025. PMID: 40352081 Free PMC article.
-
The neurobiological mechanisms and therapeutic prospect of extracellular ATP in depression.CNS Neurosci Ther. 2024 Feb;30(2):e14536. doi: 10.1111/cns.14536. CNS Neurosci Ther. 2024. PMID: 38375982 Free PMC article. Review.
-
Repurposing Ketamine in the Therapy of Depression and Depression-Related Disorders: Recent Advances and Future Potential.Aging Dis. 2024 Apr 29;16(2):804-840. doi: 10.14336/AD.2024.0239. Aging Dis. 2024. PMID: 38916735 Free PMC article. Review.
-
Fasting produces antidepressant-like effects via activating mammalian target of rapamycin complex 1 signaling pathway in ovariectomized mice.Neural Regen Res. 2023 Sep;18(9):2075-2081. doi: 10.4103/1673-5374.367928. Neural Regen Res. 2023. PMID: 36926734 Free PMC article.
-
Dietary and Metabolic Approaches for Treating Autism Spectrum Disorders, Affective Disorders and Cognitive Impairment Comorbid with Epilepsy: A Review of Clinical and Preclinical Evidence.Nutrients. 2024 Feb 17;16(4):553. doi: 10.3390/nu16040553. Nutrients. 2024. PMID: 38398876 Free PMC article. Review.
References
-
- Jha S, Dong B, Sakata K. Enriched environment treatment reverses depression-like behavior and restores reduced hippocampal neurogenesis and protein levels of brain-derived neurotrophic factor in mice lacking its expression through promoter IV. Transl Psychiatry. 2011;1:e40. doi: 10.1038/tp.2011.33. - DOI - PMC - PubMed
MeSH terms
Substances
LinkOut - more resources
Full Text Sources
Miscellaneous
