

One-to-one innervation of vocal muscles allows precise control of birdsong
- PMID: 34089645
- PMCID: PMC8319070
- DOI: 10.1016/j.cub.2021.05.008
One-to-one innervation of vocal muscles allows precise control of birdsong
Abstract
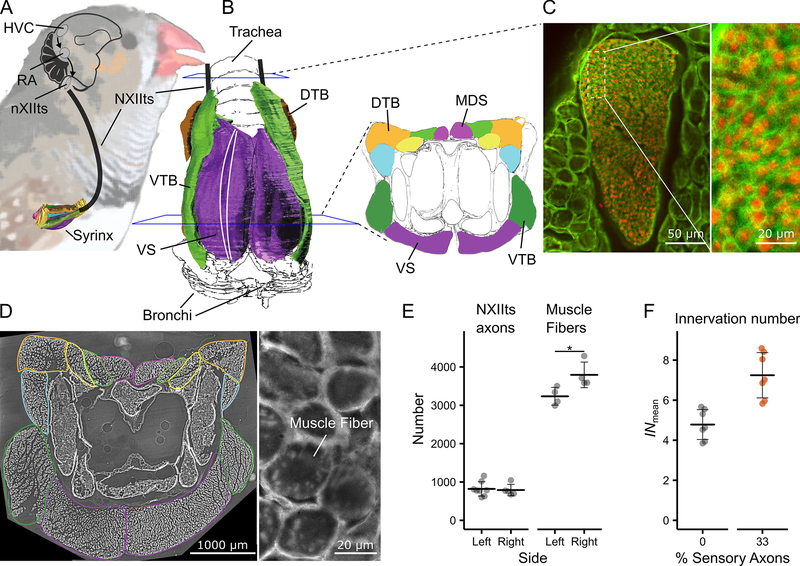
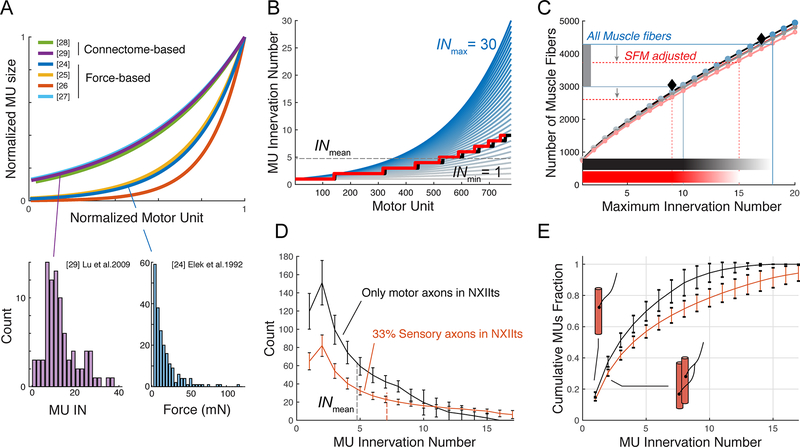
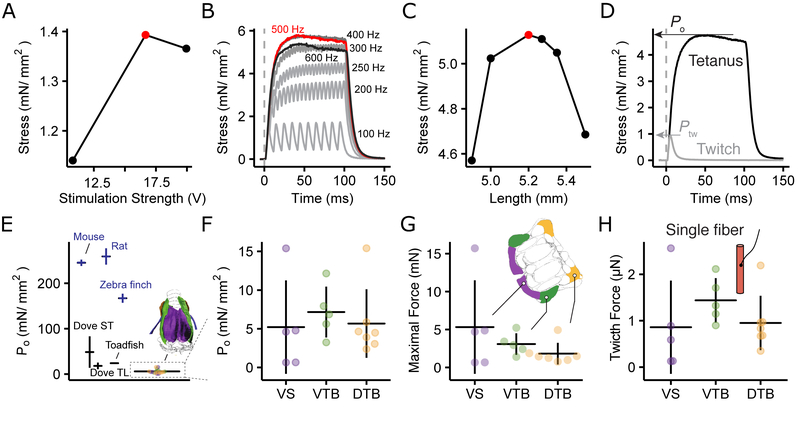
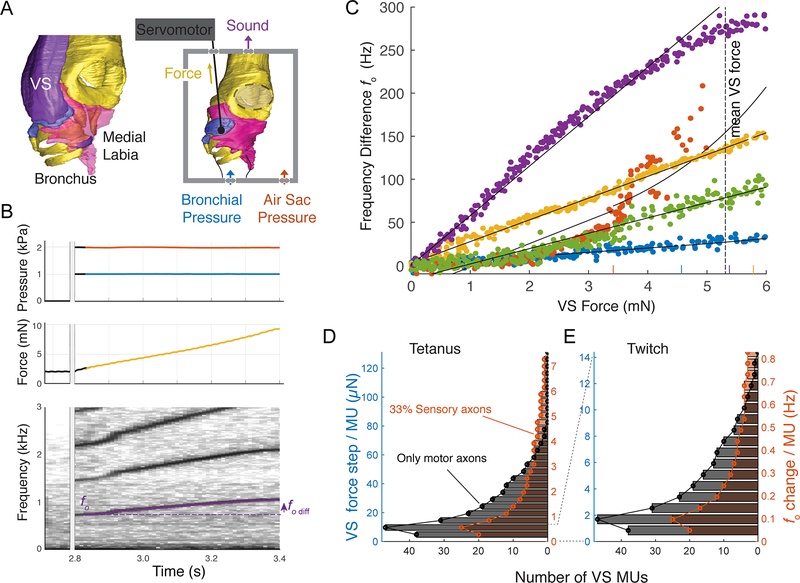
The motor control resolution of any animal behavior is limited to the minimal force step available when activating muscles, which is set by the number and size distribution of motor units (MUs) and muscle-specific force. Birdsong is an excellent model system for understanding acquisition and maintenance of complex fine motor skills, but we know surprisingly little about how the motor pool controlling the syrinx is organized and how MU recruitment drives changes in vocal output. Here we developed an experimental paradigm to measure MU size distribution using spatiotemporal imaging of intracellular calcium concentration in cross-sections of living intact syrinx muscles. We combined these measurements with muscle stress and an in vitro syrinx preparation to determine the control resolution of fundamental frequency (fo), a key vocal parameter, in zebra finches. We show that syringeal muscles have extremely small MUs, with 40%-50% innervating ≤3 and 13%-17% innervating a single muscle fiber. Combined with the lowest specific stress (5 mN/mm2) known to skeletal vertebrate muscle, small force steps by the major fo controlling muscle provide control of 50-mHz to 7.3-Hz steps per MU. We show that the song system has the highest motor control resolution possible in the vertebrate nervous system and suggest this evolved due to strong selection on fine gradation of vocal output. Furthermore, we propose that high-resolution motor control was a key feature contributing to the radiation of songbirds that allowed diversification of song and speciation by vocal space expansion.
Keywords: birdsong; motor control; motor unit; songbird; sound production; vocal communication; voice.
Copyright © 2021 Elsevier Inc. All rights reserved.
Conflict of interest statement
Declaration of interests The authors declare no competing interests.
Figures

Similar articles
-
Producing song: the vocal apparatus.Ann N Y Acad Sci. 2004 Jun;1016:109-29. doi: 10.1196/annals.1298.041. Ann N Y Acad Sci. 2004. PMID: 15313772 Review.
-
Multifunctional bilateral muscle control of vocal output in the songbird syrinx.J Neurophysiol. 2020 Dec 1;124(6):1857-1874. doi: 10.1152/jn.00332.2020. Epub 2020 Oct 7. J Neurophysiol. 2020. PMID: 33026896
-
Superfast vocal muscles control song production in songbirds.PLoS One. 2008 Jul 9;3(7):e2581. doi: 10.1371/journal.pone.0002581. PLoS One. 2008. PMID: 18612467 Free PMC article.
-
Contributions of rapid neuromuscular transmission to the fine control of acoustic parameters of birdsong.J Neurophysiol. 2017 Feb 1;117(2):637-645. doi: 10.1152/jn.00843.2015. Epub 2016 Nov 16. J Neurophysiol. 2017. PMID: 27852738 Free PMC article.
-
Peripheral motor dynamics of song production in the zebra finch.Ann N Y Acad Sci. 2004 Jun;1016:130-52. doi: 10.1196/annals.1298.009. Ann N Y Acad Sci. 2004. PMID: 15313773 Review.
Cited by
-
Adaptations for extremely high muscular power output: why do muscles that operate at intermediate cycle frequencies generate the highest powers?J Muscle Res Cell Motil. 2023 Jun;44(2):107-114. doi: 10.1007/s10974-022-09640-2. Epub 2023 Jan 11. J Muscle Res Cell Motil. 2023. PMID: 36627504 Free PMC article. Review.
-
A flexible carbon nanotube electrode array for acute in vivo EMG recordings.J Neurophysiol. 2023 Mar 1;129(3):651-661. doi: 10.1152/jn.00262.2022. Epub 2023 Feb 8. J Neurophysiol. 2023. PMID: 36752408 Free PMC article.
-
Bats expand their vocal range by recruiting different laryngeal structures for echolocation and social communication.PLoS Biol. 2022 Nov 29;20(11):e3001881. doi: 10.1371/journal.pbio.3001881. eCollection 2022 Nov. PLoS Biol. 2022. PMID: 36445872 Free PMC article.
-
Daily vocal exercise is necessary for peak performance singing in a songbird.Nat Commun. 2023 Dec 12;14(1):7787. doi: 10.1038/s41467-023-43592-6. Nat Commun. 2023. PMID: 38086817 Free PMC article.
-
Myomatrix arrays for high-definition muscle recording.Elife. 2023 Dec 19;12:RP88551. doi: 10.7554/eLife.88551. Elife. 2023. PMID: 38113081 Free PMC article.
References
-
- Price T (1998). Sexual selection and natural selection in bird speciation. Philos T R Soc B 353, 251–260.
-
- Uy JAC, Irwin DE, and Webster MS (2018). Behavioral Isolation and Incipient Speciation in Birds. Annu Rev Ecol Evol S 49, 1–24.
-
- Janik VM, and Slater PJ (2000). The different roles of social learning in vocal communication. Anim Behav 60, 1–11. - PubMed
-
- Gaunt AS (1983). An Hypothesis Concerning the Relationship of Syringeal Structure to Vocal Abilities. Auk 100, 853–862.
Publication types
MeSH terms
Grants and funding
LinkOut - more resources
Full Text Sources
Research Materials
