. 2021 Aug:154:112288.
doi: 10.1016/j.fct.2021.112288. Epub 2021 Jun 2.

Single cell RNA sequencing detects persistent cell type- and methylmercury exposure paradigm-specific effects in a human cortical neurodevelopmental model

Affiliations

Single cell RNA sequencing detects persistent cell type- and methylmercury exposure paradigm-specific effects in a human cortical neurodevelopmental model

M Diana Neely et al. Food Chem Toxicol. 2021 Aug.

Abstract

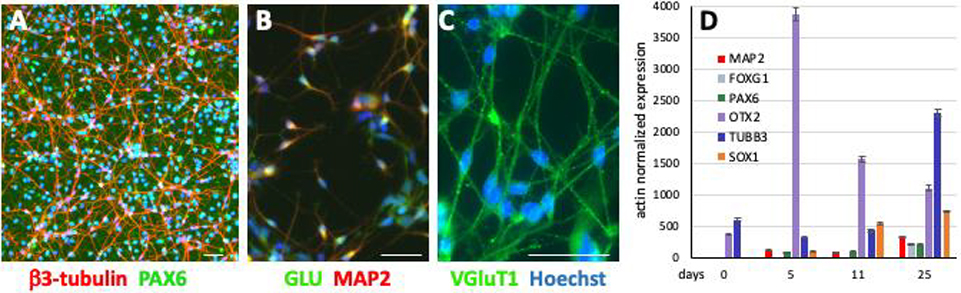
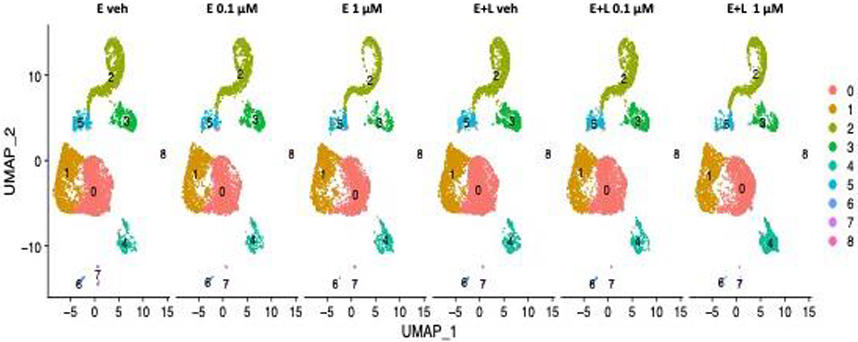
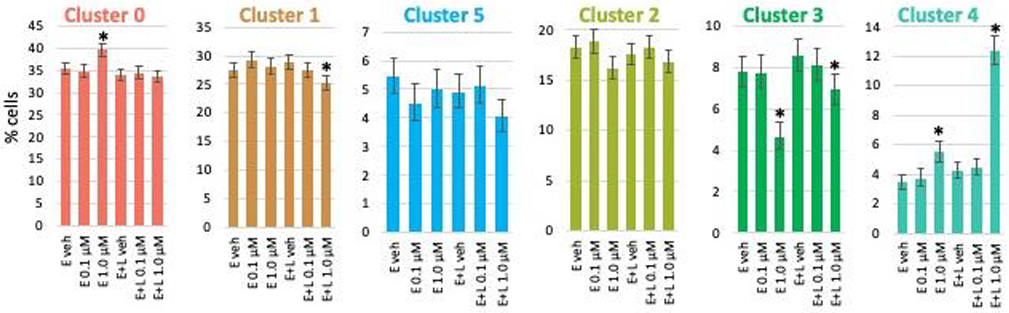
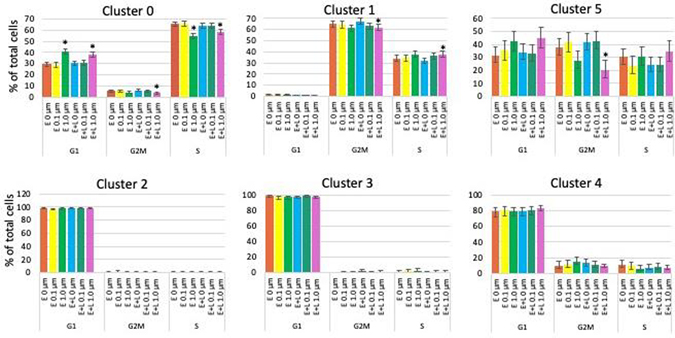
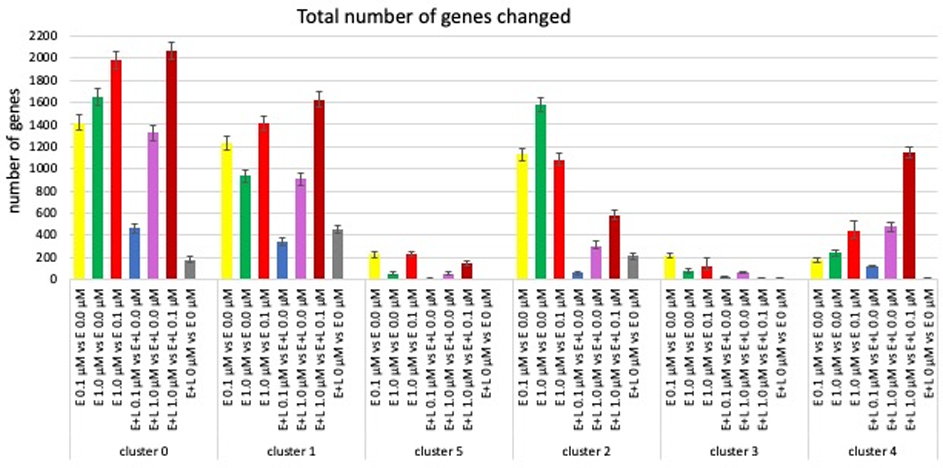
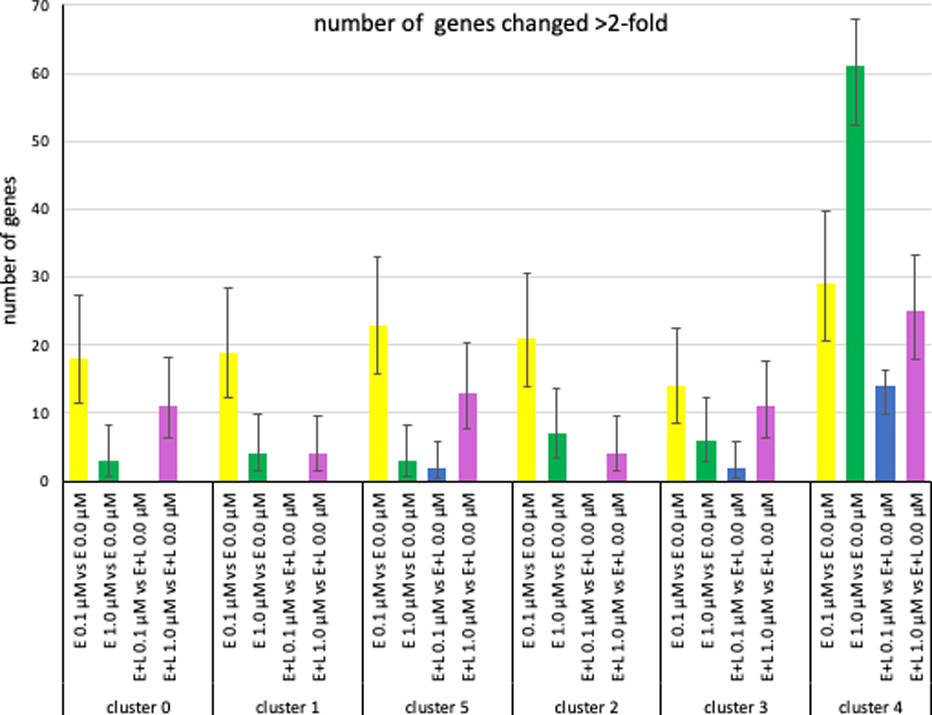
The developing human brain is uniquely vulnerable to methylmercury (MeHg) resulting in lasting effects especially in developing cortical structures. Here we assess by single-cell RNA sequencing (scRNAseq) persistent effects of developmental MeHg exposure in a differentiating cortical human-induced pluripotent stem cell (hiPSC) model which we exposed to in vivo relevant and non-cytotoxic MeHg (0.1 and 1.0 μM) concentrations. The cultures were exposed continuously for 6 days either once only during days 4-10, a stage representative of neural epithelial- and radial glia cells, or twice on days 4-10 and days 14-20, a somewhat later stage which includes intermediate precursors and early postmitotic neurons. After the completion of MeHg exposure the cultures were differentiated further until day 38 and then assessed for persistent MeHg-induced effects by scRNAseq. We report subtle, but significant changes in the population size of different cortical cell types/stages and cell cycle. We also observe MeHg-dependent differential gene expression and altered biological processes as determined by Gene Ontology analysis. Our data demonstrate that MeHg results in changes in gene expression in human developing cortical neurons that manifest well after cessation of exposure and that these changes are cell type-, developmental stage-, and exposure paradigm-specific.

Keywords: Cortex; Glutamatergic; Human-induced pluripotent stem cells; Methylmercury; Neuron; Single cell RNA sequencing.


Conflict of interest statement

Declaration of interests

The authors declare that they have no known competing financial interests or personal relationships that could have appeared to influence the work reported in this paper.

Figures

Fig. 1
Fig. 1. Differentiation of hiPSC into cortical glutamatergic neurons.
hiPSCs were differentiated into cortical glutamatergic neurons for 30 days. β3-tubulin positive neurites and PAX6 positive nuclei are abundant in these cultures (A). In addition, these neurons are also positive for MAP2 and glutamate (B), as well as VGluT1 (C). The temporal expression of the genes PAX6, FOXG1, OTX2 and SOX1 (encode neural precursor cell markers) and TUBB3 and MAP2 (encode neuronal markers) were quantified in day 25 neuronal cultures by RT-qPCR (D). (A-C: scale bars = 50 μm); (D = mean ± 95% confidence intervals, n = 6, technical replicates). Similar gene expression patterns were observed in several other hiPSC lines from control subjects as well as patients with different disease-specific mutations, an additional example of another control line is provided in suppl. Fig. 1.
Fig. 2
Fig. 2. UMAP clustering identifies 9 cell clusters.
Unsupervised clustering on the gene expression profiles visualized using Uniform Manifold Approximation and Projection (UMAP) plots revealed 9 distinct clusters of cells (clusters 0–8) for all 6 treatment conditions. We identified clusters 0 and cluster 1 as radial glial cells (RG) and cluster 5 as intermediate progenitor cells (IPCs). We assigned clusters 2 and 3 immature postmitotic excitatory neurons (EN) identity of cortical (cluster 2) and thalamic (cluster 3) origin. Cluster 4 we ascribed choroid plexus precursor identity. Clusters 6–8 were predicted to be other RG and mural cells.
Fig. 3.
Fig. 3.. MeHg causes minor changes in population size in a cell type (cluster)- and exposure paradigm-specific manner.
The percentage of cells making up each cluster for each exposure condition was determined. Exposures at the lower (0.1 μM) MeHg concentration did not result in any significant changes of cell numbers for any clusters. E-exposure at 1 μM increased cluster 0 (RG) population, whereas E + L 1 μM decreased cluster 1 (RG) cell percentage. E and E + L exposure at 1 μM decreased the cell population of the thalamic glutamatergic neurons (cluster 3) but increased the percentage of choroid plexus precursors (cluster 4). Percent of the total cell population with 95% confidence intervals are shown.
Fig. 4.
Fig. 4.. MeHg causes small changes in the cell cycle.
The percentages of cells in G2M, S or G1 phase are plotted. Cells in clusters 2, 3 and 4 are to a large extent postmitotic and not affected by MeHg. E or E+L exposures at 1 μM significantly decreased the percentage of cells in G2M and S phase and increased the population in G1 phase of cluster 0 cells. Clusters 1 and 5 cells were only affected by E+L at 1 μM exposure which caused a decrease in the percentage of G2M phase cells in both clusters and a small increase in the percentage of S phase in cluster 1 cells. Exposures at 0.1 μM did not result in any significant changes. Percent of the total cell population with 95% confidence intervals are shown.
Fig. 5
Fig. 5. MeHg causes cluster- and exposure paradigm-specific changes in gene expression.
The number of genes with significantly (FDR < 0.05) changed expression from a total of 33538 genes assessed are shown. The grey bars indicate differences in gene expression between two control cultures. The red bars show number of genes differentially expressed between a low (0.1 μM) and high (1.0 μM) exposure. (Error bars represent 95% confidence levels).
Fig. 6.
Fig. 6.. MeHg causes cluster- and exposure paradigm-specific changes in gene expression.
The number genes with changes in expression levels >2-fold (FDR< 0.05) are plotted. (Error bars represent 95% confidence intervals).

References

    1. Abe T, Haga T, and Kurokawa M 1975. Blockage of axoplasmic transport and depolymerisation of reassembled microtubules by methyl mercury. Brain Res. 86:504–508. - PubMed
    1. Ajsuvakova OP, Tinkov AA, Aschner M, Rocha JBT, Michalke B, Skalnaya MG, Skalny AV, Butnariu M, Dadar M, Sarac I, Aaseth J, and Bjørklund G 2020. Sulfhydryl groups as targets of mercury toxicity. Coord Chem Rev. 417. - PMC - PubMed
    1. Amin-Zaki L, Majeed MA, Elhassani SB, Clarkson TW, Greenwood MR, and Doherty RA 1979. Prenatal methylmercury poisoning. Clinical observations over five years. Am J Dis Child. 133:172–177. - PubMed
    1. Antunes Dos Santos A, Appel Hort M, Culbreth M, López-Granero C, Farina M, Rocha JB, and Aschner M 2016. Methylmercury and brain development: A review of recent literature. J Trace Elem Med Biol. 38:99–107. - PMC - PubMed
    1. Aschner M 2012. Considerations on methylmercury (MeHg) treatments in in vitro studies. Neurotoxicology. 33:512–513. - PMC - PubMed

MeSH terms