. 2021 Nov:53:101264.
doi: 10.1016/j.molmet.2021.101264. Epub 2021 Jun 4.

Gsα-dependent signaling is required for postnatal establishment of a functional β-cell mass

Affiliations

Gsα-dependent signaling is required for postnatal establishment of a functional β-cell mass

Berta Serra-Navarro et al. Mol Metab. 2021 Nov.

Abstract

Objective: Early postnatal life is a critical period for the establishment of the functional β-cell mass that will sustain whole-body glucose homeostasis during the lifetime. β cells are formed from progenitors during embryonic development but undergo significant expansion in quantity and attain functional maturity after birth. The signals and pathways involved in these processes are not fully elucidated. Cyclic adenosine monophosphate (cAMP) is an intracellular signaling molecule that is known to regulate insulin secretion, gene expression, proliferation, and survival of adult β cells. The heterotrimeric G protein Gs stimulates the cAMP-dependent pathway by activating adenylyl cyclase. In this study, we sought to explore the role of Gs-dependent signaling in postnatal β-cell development.

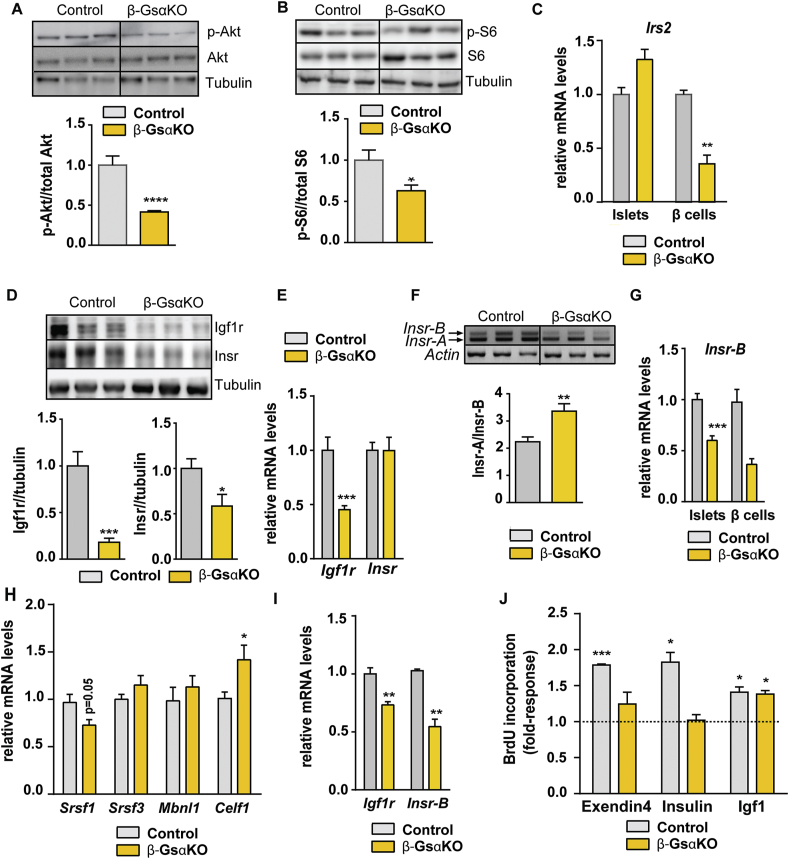
Methods: To study Gs-dependent signaling, we generated conditional knockout mice in which the α subunit of the Gs protein (Gsα) was ablated from β-cells using the Cre deleter line Ins1Cre. Mice were characterized in terms of glucose homeostasis, including in vivo glucose tolerance, glucose-induced insulin secretion, and insulin sensitivity. β-cell mass was studied using histomorphometric analysis and optical projection tomography. β-cell proliferation was studied by ki67 and phospho-histone H3 immunostatining, and apoptosis was assessed by TUNEL assay. Gene expression was determined in isolated islets and sorted β cells by qPCR. Intracellular cAMP was studied in isolated islets using HTRF-based technology. The activation status of the cAMP and insulin-signaling pathways was determined by immunoblot analysis of the relevant components of these pathways in isolated islets. In vitro proliferation of dissociated islet cells was assessed by BrdU incorporation.

Results: Elimination of Gsα in β cells led to reduced β-cell mass, deficient insulin secretion, and severe glucose intolerance. These defects were evident by weaning and were associated with decreased proliferation and inadequate expression of key β-cell identity and maturation genes in postnatal β-cells. Additionally, loss of Gsα caused a broad multilevel disruption of the insulin transduction pathway that resulted in the specific abrogation of the islet proliferative response to insulin.

Conclusion: We conclude that Gsα is required for β-cell growth and maturation in the early postnatal stage and propose that this is partly mediated via its crosstalk with insulin signaling. Our findings disclose a tight connection between these two pathways in postnatal β cells, which may have implications for using cAMP-raising agents to promote β-cell regeneration and maturation in diabetes.

Keywords: Cell maturation; Gs; Insulin signaling; Postnatal development; Replication; cAMP; β-Cell mass.


Figures

Figure 1
Figure 1
Whole-body glucose homeostasis in β-GsαKO mice. (A) Immunofluorescence staining of fixed pancreatic sections from p28 β-GsαKO/YFP mice using antibodies for insulin in red and YFP in green. Nuclei in blue were stained with Hoechst. Scale bars are 25 μm. (B) Quantification of Gnas mRNA levels by qPCR in islets and sorted β cells from p28 β-GsαKO (islets: n = 9; β cells: n = 6) and littermate controls (islets: n = 9; β cells: n = 5). Expression was normalized with Tbp and expressed relative to control, given the value of 1. (C) Body weight of β-GsαKO (n = 6) and control littermates (n = 6–10) at the indicated ages. (D) Non-fasting blood glucose of β-GsαKO (n = 4–7) and control littermates (n = 6–10) at the indicated ages. (E,F) Glucose tolerance tests were performed on 6 h fasted p28 β-GsαKO (n = 5) and control (n = 5–7) mice. A glucose load was administered via intraperitoneal injection (E) or by oral gavage (F), and blood samples were taken at the indicated times. (G) Insulin tolerance test of p28 β-GsαKO (n = 3) and control littermates (n = 3). (H) Plasma insulin levels before and 20 min after an intraperitoneal glucose injection in 6 h fasted p28 β-GsαKO (n = 5) and control (n = 5) mice. (I) Non-fasting plasma insulin of β-GsαKO (n = 7–13) and control littermates (n = 11–13) at the indicated ages. All bars and data points represent the mean ± SEM. ∗P < 0.05, ∗∗P < 0.01, ∗∗∗P < 0.001, ∗∗∗∗P < 0.0001 vs. control animals (B-G, I) or between time points (H) using two-tailed Student's test (B,H) and two-way ANOVA (C-G, I).
Figure 2
Figure 2
Characterization of the β-cell compartment in β-GsαKO mice. (A) Representative immunofluorescence images of fixed pancreatic sections from control and β-GsαKO mice at the indicated ages, stained for insulin in green and glucagon in red. Nuclei are marked with Hoechst in blue. Scale bars are 75 μm. (B) Fractional insulin area was calculated as the percentage of insulin+ area relative to the total pancreatic area (p0: n = 4, p14/p28: n = 5, 8wo: n = 3). (C,D) Quantification of β-cell (C) and α-cell (D) mass. Values were calculated by multiplying fractional insulin area x pancreas weight (p14/p28: n = 5, 8wo: n = 3–4). (E,F) Quantification of the percentage of β (insulin+) cells that are Ki67+ (E) or p-HH3+ (F) in pancreases from p14 and p28 β-GsαKO (n = 5) and control (n = 4) mice. (G) Quantification of the expression of the indicated cell cycle and proliferation genes in p28 β-GsαKO (n = 4–10) and control (n = 4–9) islets as determined by qPCR. Expression was normalized with Tbp and expressed relative to control, given the value of 1. All bars represent the mean ± SEM. ∗P < 0.05, ∗∗P < 0.01, ∗∗∗P < 0.001, ∗∗∗∗P < 0.0001 vs. control animals by two-tailed Student's test.
Figure 3
Figure 3
β-cell maturation in β-GsαKO mice. (A) Quantification of the expression of the indicated genes by qPCR in p28 β-GsαKO (n = 4–15) and control (n = 4–13) islets. Expression was normalized with Tbp and expressed relative to control, given the value of 1. (B)Pdx1 and Mafa mRNA levels in p7 β-GsαKO (n = 5–6) and control (n = 6) measured by qPCR. Expression was normalized with Tbp and expressed relative to control, given the value of 1. (C) Insulin content of β-GsαKO and control islets isolated at the indicated ages and determined by ELISA (p7, n = 4–5; p14, n = 11; p28, n = 8–14; 8wo, n = 28–32). (D) Representative immunofluorescence images of islets matched for size from β-GsαKO and control mice. Insulin is shown in green, glucagon in red, and nuclei in blue. Images were taken using the same exposure times for comparison purposes. Scale bars are 10 μm. (E) Quantification of the expression of the Ins1 and Ins2 genes by qPCR in β-GsαKO and control islets at p7 (n = 3–6) and p28 (n = 6–8). Expression was normalized with Tbp and expressed relative to control, given the value of 1. (F) Proinsulin content of p28 β-GsαKO (n = 4) and control (n = 7) islets as determined by ELISA. (G) Plasma proinsulin levels in p28 β-GsαKO (n = 6) and control (n = 8) mice. (H) Plasma C-peptide levels in p28 β-GsαKO (n = 4) and control (n = 4) mice. All bars represent the mean ± SEM. ∗P < 0.05, ∗∗P < 0.01, ∗∗∗P < 0.001, ∗∗∗∗P < 0.0001 vs. controls by two-tailed Student's test.
Figure 4
Figure 4
cAMP signaling pathway in β-GsαKO islets. (A) Intracellular cAMP concentration in freshly isolated p28 and 8wo β-GsαKO and control islets incubated for 20 min with or without forskolin (1 μM) + IBMX (0.5 mM) (n = 3). (B) Expression of the indicated genes in p28 β-GsαKO (n = 4–8) and control (n = 4–9) islets as determined by qPCR. Expression was normalized with Tbp and expressed relative to control, given the value of 1. (C) Determination of phospho(p)-Creb and total Creb by immunoblot analysis in the whole islet extract from p28 β-GsαKO and control islets. Left: representative immunoblot image. Right: quantification of p-Creb (relative to total Creb) and Creb (relative to tubulin) levels. Values are expressed relative to control islets, given the value of 1 (n = 7–10). (D) Determination of phospho(p)-Erk1/2 and total Erk1/2 by immunoblot analysis in whole islet extracts from p28 β-GsαKO and control islets. Left: representative immunoblot image. Right: quantification of Erk1/2 activation (p-Erk1/2/total Erk1/2). Values are expressed relative to control islets, given the value of 1 (n = 7). (E,F) Quantification of the indicated genes by qPCR in p28 β-GsαKO (n = 4–8) and control (n = 4–9) islets. Expression was normalized with Tbp and expressed relative to control, given the value of 1. All data points represent the mean ± SEM. ∗P < 0.05, ∗∗P < 0.01, ∗∗∗P < 0.001, ∗∗∗∗P < 0.0001 vs. controls by two-tailed Student's test.
Figure 5
Figure 5
Insulin signaling in β-GsαKO islets. (A) Determination of phospho(p)-Akt and total Akt by immunoblot analysis in whole islet extracts from p28 β-GsαKO and control mice. Top: representative immunoblot image. Bottom: quantification of Akt activation (p-Akt/2/total Akt) (n = 12). Values are expressed relative to control islets, given the value of 1. (B) Determination of phospho(p)-S6 and total S6 by immunoblot analysis in whole islet extracts from p28 β-GsαKO and control mice. Top: representative immunoblot image. Bottom: quantification of S6 activation (p-S6/total S6) (n = 6–7). Values are expressed relative to control islets, given the value of 1. (C) Quantification of Irs2 mRNA levels by qPCR in islets (n = 9–10) and sorted β cells (n = 3–5) from p28 β-GsαKO and littermate controls. Expression was normalized with Tbp and expressed relative to control, given the value of 1. (D) Determination of Igf1r and Insr protein levels by immunoblot analysis in whole islet extracts from p28 β-GsαKO and control mice. Top: representative immunoblot image. Bottom: quantification of Igf1r and Insr protein levels relative to tubulin (n = 8). Values are expressed relative to control islets, given the value of 1. (E) Quantification of Igf1r and total Insr mRNA levels by qPCR in p28 β-GsαKO and control islets (n = 8–9). Expression was normalized with Tbp and expressed relative to control, given the value of 1. (F) Gene expression of Insr-A and Insr-B isoforms in p28 β-GsαKO and control islets as determined by conventional PCR. Top: representative gel. Bottom: quantification of the ratio Insr-A/Insr-B (n = 6). Actin is shown as a housekeeping gene. (G) Quantification of Insr-B mRNA levels by qPCR in islets (n = 4–6) and sorted β cells (n = 2) from p28 β-GsαKO and control mice. Expression was normalized with Tbp and expressed relative to control, given the value of 1. (H) Expression of genes encoding factors involved in Insr splicing in p28 β-GsαKO (n = 5–8) and control (n = 3–8) islets as determined by qPCR. Expression was normalized with Tbp and expressed relative to control, given the value of 1. (I)Igf1r and Insr-B mRNA levels in p7 β-GsαKO (n = 5–9) and control (n = 3–6) measured by qPCR. Expression was normalized with Tbp and expressed relative to control, given the value of 1. (J) Proliferation determined by BrdU incorporation in DICS prepared from 5 wo β-GsαKO and control islets, and stimulated for 24 h with exendin-4 (200 nM), insulin (11 nM) or Igf1 (11 nM) (n = 3, with 6 replicates per experiment). Values are expressed as fold-increase over un-stimulated DICS. All data points represent the mean ± SEM. P < 0.05, ∗∗P < 0.01, ∗∗∗P < 0.001 vs. control animals by two-tailed Student's test.

Similar articles

Cited by

References

    1. Butler P.C., Meier J.J., Butler A.E., Bhushan A. The replication of beta cells in normal physiology, in disease and for therapy. Nature Clinical Practice Endocrinology and Metabolism. 2007;3(11):758–768. - PubMed
    1. Bouwens L., Rooman I. Regulation of pancreatic beta-cell mass. Physiological Reviews. 2005;85(4):1255–1270. - PubMed
    1. Zeng C., Mulas F., Sui Y., Guan T., Miller N., Tan Y. Pseudotemporal ordering of single cells reveals metabolic control of postnatal β cell proliferation. Diabetes. 2017;25(5):1160–1175. e1111. - PMC - PubMed
    1. Wang Y., Sun J., Ni Q., Nie A., Gu Y. Dual effect of raptor on neonatal β-cell proliferation and identity maintenance. Diabetes. 2019;68(10):1950–1964. - PubMed
    1. Wang P., Fiaschi-Taesch N.M., Vasavada R.C., Scott D.K., Garcia-Ocana A., Stewart A.F. Diabetes mellitus--advances and challenges in human beta-cell proliferation. Nature Reviews Endocrinology. 2015;11(4):201–212. - PubMed

Publication types

Substances