Review
. 2021 Sep;124(4):465-475.
doi: 10.1002/jso.26561. Epub 2021 Jun 6.

A review of nasopharyngeal swab and saliva tests for SARS-CoV-2 infection: Disease timelines, relative sensitivities, and test optimization

Affiliations
Review

A review of nasopharyngeal swab and saliva tests for SARS-CoV-2 infection: Disease timelines, relative sensitivities, and test optimization

Marylin Roque et al. J Surg Oncol. 2021 Sep.

Abstract

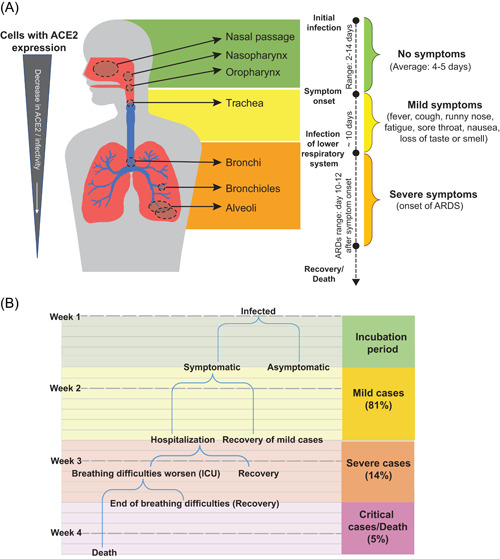
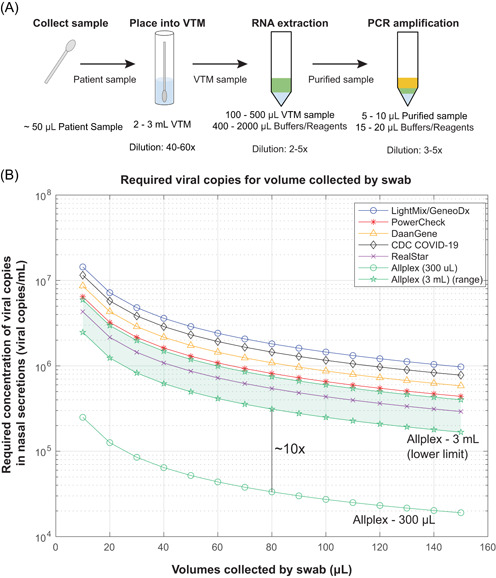
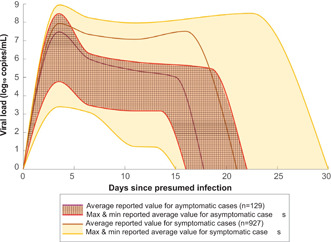
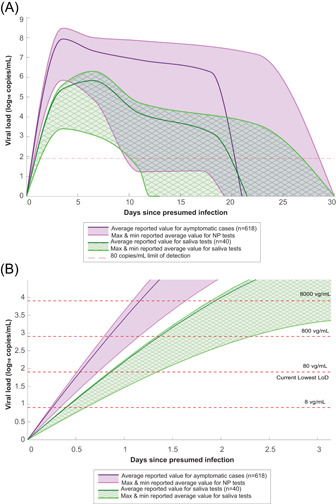
Testing is an essential part of containment of the severe acute respiratory syndrome coronavirus 2 (SARS-CoV-2) pandemic. This review summarizes studies for SARS-CoV-2 infection and testing. Nasopharyngeal samples are best at sensitivity detection, especially in early stages of disease and in asymptomatic individuals. Current swab processing involves a 100- to 1000-fold dilution of the patient sample. Future optimization of testing should focus on using smaller volumes of viral transport media and swab designs to increase comfort and increased viral adhesion.

Keywords: COVID-19; bronchitis; pharyngitis; pneumonia; respiratory infection.


Conflict of interest statement

The authors declare that there are no conflict of interests.

Figures

Figure 1
Figure 1
(A) A diagram showing the timeline of infection, common coronavirus symptoms, and a progression of virus for a theoretical patient with a severe case of coronavirus disease 2019 (COVID‐19). (B) A more comprehensive timeline of general COVID‐19 cases [Color figure can be viewed at wileyonlinelibrary.com]
Figure 2
Figure 2
(A) Sample processing and associated dilution factors. Based on these values, a 50–100 μl swab sample undergoes an overall dilution of anywhere from 120‐ to 1500‐fold, the majority occurring when the patient sample is placed into the viral transport medium (VTM) for transport from testing site to laboratory. (B) Viral load as a function of volume collected by a swab. The volume of VTM the swab was placed into has a great influence on the required viral load, as Allplex (3 ml) requires anywhere from 2×10⁵ to 6×10⁶ viral copies/ml in nasal secretions for detection. Allplex (300 μl) requires 2×10⁴ to 3×10⁵ viral copies/ml in nasal secretions for detection. All lines represent the sample processing conditions used by the authors this paper reviews (see Table S1). Allplex (3 ml) is shown as a range, rather than a single line, as RNA extraction methods were unspecified by the authors [Color figure can be viewed at wileyonlinelibrary.com]
Figure 3
Figure 3
Comparison of viral load in asymptomatic (n = 129) and symptomatic (n = 927) cases of coronavirus disease 2019 (COVID‐19) at days since presumed infection. The solid darker lines represent the mean of reported averages, while the shaded regions represent the range between the maximum and minimum reported averages. The patterned areas represent viral load in asymptomatic patients and the yellow areas represent viral load in symptomatic patients. The viral load is shown in log10 RNA copies/ml. Different papers expressed viral load in different units, most commonly in C t and RNA copies/ml. Converting to log10 RNA copies/ml from RNA copies/ml was done using the log10 function. Converting to log10 RNA copies/ml from C t was done using the linear relationship presented in Vogels et al. Data on viral load was then binned into days: incubation (Days 0–5), viral shedding (Days 6–7), symptomatic (Days 8–14), and recovery (Days 15+) since this is a common breakdown for COVID‐19. All tabulated values used to make this figure can be found in Table S2 [Color figure can be viewed at wileyonlinelibrary.com]
Figure 4
Figure 4
(A) Comparison of viral load of severe acute respiratory syndrome coronavirus 2 (SARS‐CoV‐2) collected by nasopharyngeal (NP) swabs (n = 618) and saliva samples (n = 40) at days since presumed infection. (B) Magnified view on the first 3 days with varying LoD lines. These values were converted to log10 RNA copies/ml, using methods of Vogels et al. to convert from C t. Full tabulated values used to make this figure can be found in Table S2 [Color figure can be viewed at wileyonlinelibrary.com]
Figure 5
Figure 5
Potential testing scenarios and their associated costs calculated for a population of 100,000 (assuming that the entire population is tested). A lower false‐negative rate along with individuals who shelter at home leads to the lowest economic burden, whereas a higher false‐negative rate with individuals who do not shelter at home leads to the highest economic burden. This analysis highlights why the false‐negative rate is the salient metric when comparing test efficacy. The majority of the economic burden comes from asymptomatic patients not being detected and quarantined to break the chain of infection (type II error). The personal and societal costs of false‐negative rate (FNR) are significant [Color figure can be viewed at wileyonlinelibrary.com]

References

    1. Allen JAS, Aufrichtig A, Barnard A, et al. Coronavirus World Map: Tracking the Global Outbreak. 2020. https://www.nytimes.com/interactive/2020/world/coronavirus-maps.html
    1. CDC COVID Data Tracker 2020. https://covid.cdc.gov/covid-data-tracker/#cases_casesper100klast7days
    1. Coronavirus disease (COVID‐19): World Health Organization . 2020. https://www.who.int/emergencies/diseases/novel-coronavirus-2019/question...
    1. Cyranoski D. Profile of a killer: the complex biology powering the coronavirus pandemic. Nature. 2020;581(7806):22‐26. - PubMed
    1. Burmer G, Burmer M, Pabuwal V. SARS‐CoV‐2 and COVID‐19 Pathogenesis: A Review. Seattle, WA: LifeSpan BioSciences, Inc.; 2020.