

A feasibility study on deep learning-based individualized 3D dose distribution prediction
- PMID: 34091925
- PMCID: PMC8842508
- DOI: 10.1002/mp.15025
A feasibility study on deep learning-based individualized 3D dose distribution prediction
Abstract
Purpose: Radiation therapy treatment planning is a trial-and-error, often time-consuming process. An approximately optimal dose distribution corresponding to a specific patient's anatomy can be predicted by using pre-trained deep learning (DL) models. However, dose distributions are often optimized based not only on patient-specific anatomy but also on physicians' preferred trade-offs between planning target volume (PTV) coverage and organ at risk (OAR) sparing or among different OARs. Therefore, it is desirable to allow physicians to fine-tune the dose distribution predicted based on patient anatomy. In this work, we developed a DL model to predict the individualized 3D dose distributions by using not only the patient's anatomy but also the desired PTV/OAR trade-offs, as represented by a dose volume histogram (DVH), as inputs.
Methods: In this work, we developed a modified U-Net network to predict the 3D dose distribution by using patient PTV/OAR masks and the desired DVH as inputs. The desired DVH, fine-tuned by physicians from the initially predicted DVH, is first projected onto the Pareto surface, then converted into a vector, and then concatenated with feature maps encoded from the PTV/OAR masks. The network output for training is the dose distribution corresponding to the Pareto optimal DVH. The training/validation datasets contain 77 prostate cancer patients, and the testing dataset has 20 patients.
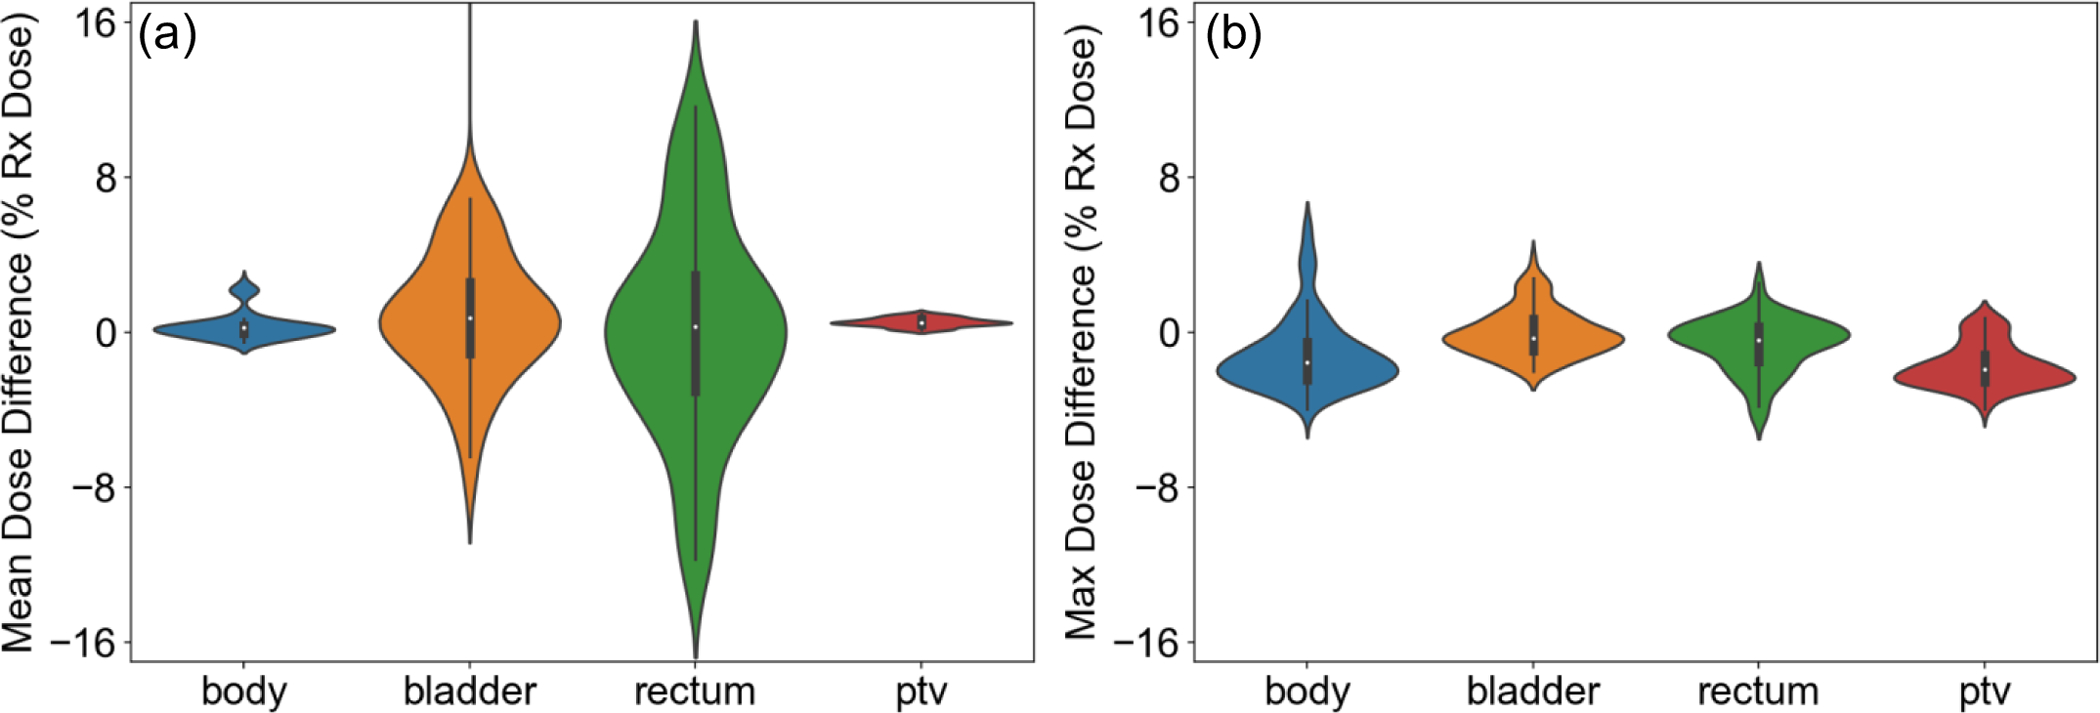
Results: The trained model can predict a 3D dose distribution that is approximately Pareto optimal while having the DVH closest to the input desired DVH. We calculated the difference between the predicted dose distribution and the optimized dose distribution that has a DVH closest to the desired one for the PTV and for all OARs as a quantitative evaluation. The largest absolute error in mean dose was about 3.6% of the prescription dose, and the largest absolute error in the maximum dose was about 2.0% of the prescription dose.
Conclusions: In this feasibility study, we have developed a 3D U-Net model with the patient's anatomy and the desired DVH curves as inputs to predict an individualized 3D dose distribution that is approximately Pareto optimal while having the DVH closest to the desired one. The predicted dose distributions can be used as references for dosimetrists and physicians to rapidly develop a clinically acceptable treatment plan.
Keywords: Pareto optimal dose distribution prediction; deep learning; dose volume histogram; physicians’ preferred trade-offs.
© 2021 American Association of Physicists in Medicine.
Figures


References
-
- Das IJ, Cheng C-W, Chopra KL, Mitra RK, Srivastava SP, Glatstein E. Intensity-modulated radiation therapy dose prescription, recording, and delivery: patterns of variability among institutions and treatment planning systems. Journal of the National Cancer Institute. 2008;100(5):300–307. - PubMed
-
- Nelms BE, Robinson G, Markham J, et al. Variation in external beam treatment plan quality: an inter-institutional study of planners and planning systems. Practical radiation oncology. 2012;2(4):296–305. - PubMed
-
- Zhu X, Ge Y, Li T, Thongphiew D, Yin FF, Wu QJ. A planning quality evaluation tool for prostate adaptive IMRT based on machine learning. Medical physics. 2011;38(2):719–726. - PubMed
-
- Appenzoller LM, Michalski JM, Thorstad WL, Mutic S, Moore KL. Predicting dose-volume histograms for organs-at-risk in IMRT planning. Medical physics. 2012;39(12):7446–7461. - PubMed
-
- Wu B, Pang D, Simari P, Taylor R, Sanguineti G, McNutt T. Using overlap volume histogram and IMRT plan data to guide and automate VMAT planning: a head-and-neck case study. Medical physics. 2013;40(2):021714. - PubMed
MeSH terms
Grants and funding
LinkOut - more resources
Full Text Sources
Other Literature Sources
