. 2022 Apr 1;107(4):887-898.
doi: 10.3324/haematol.2021.278990.

Perturbed hematopoiesis in individuals with germline DNMT3A overgrowth Tatton-Brown-Rahman syndrome

Affiliations

Perturbed hematopoiesis in individuals with germline DNMT3A overgrowth Tatton-Brown-Rahman syndrome

Ayala Tovy et al. Haematologica. .

Abstract

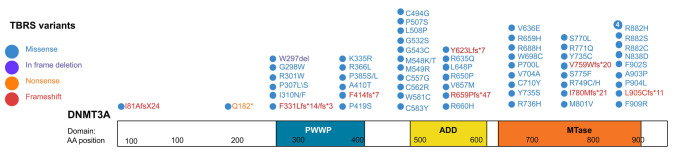
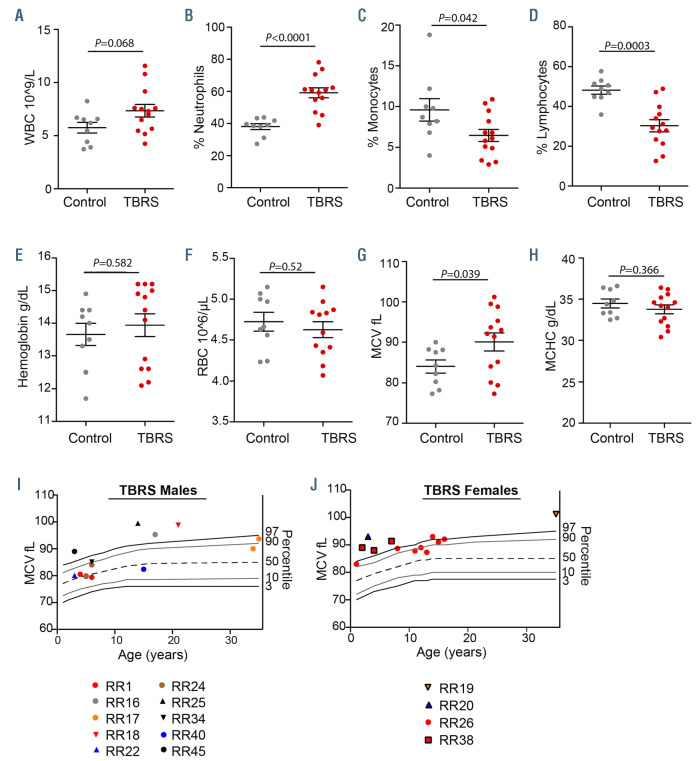
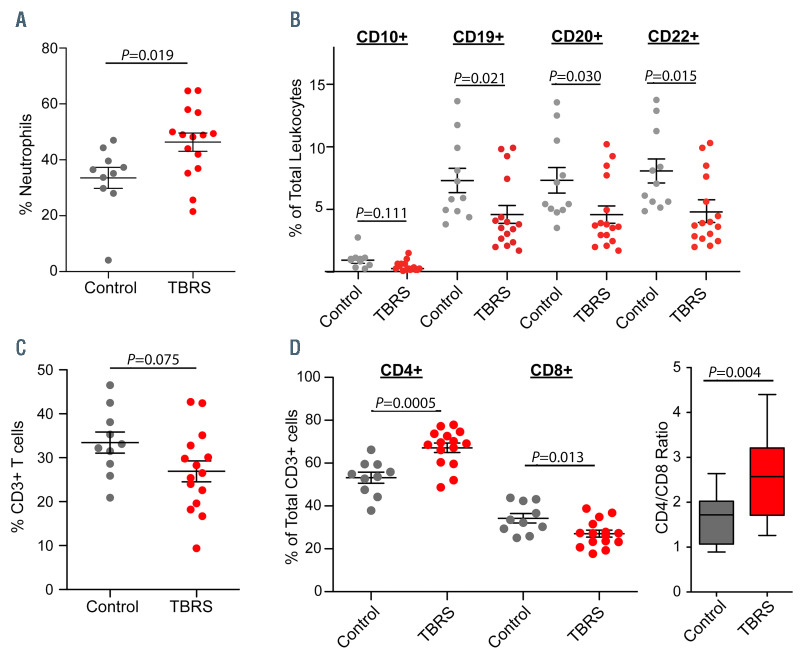
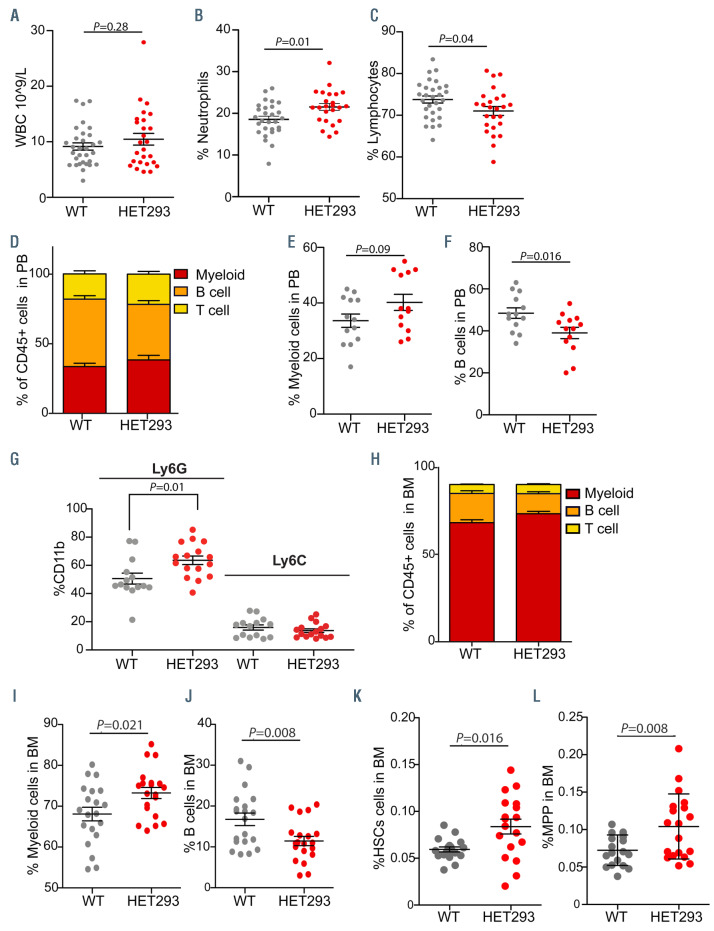
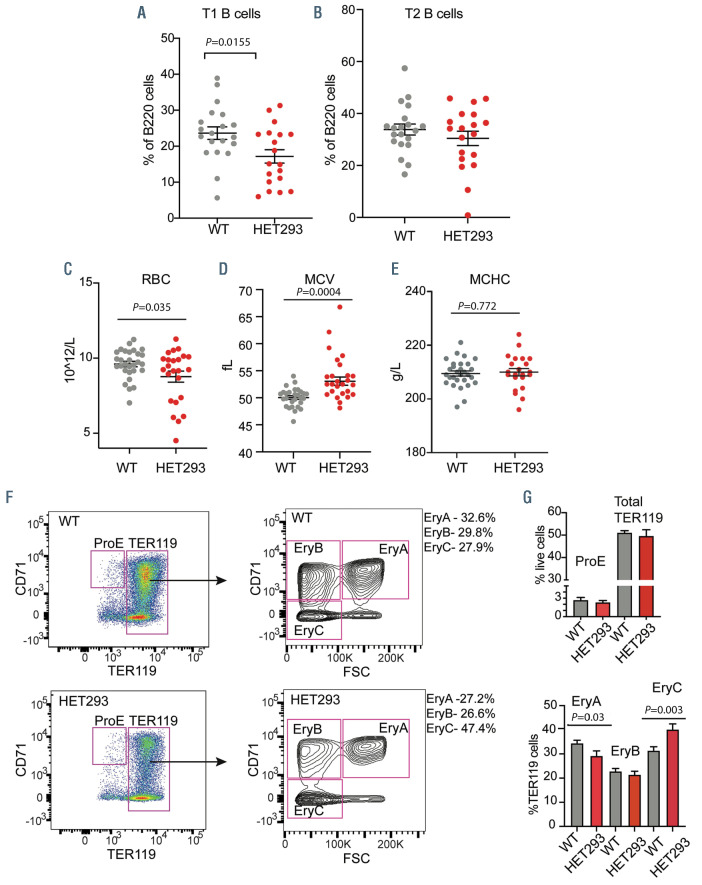
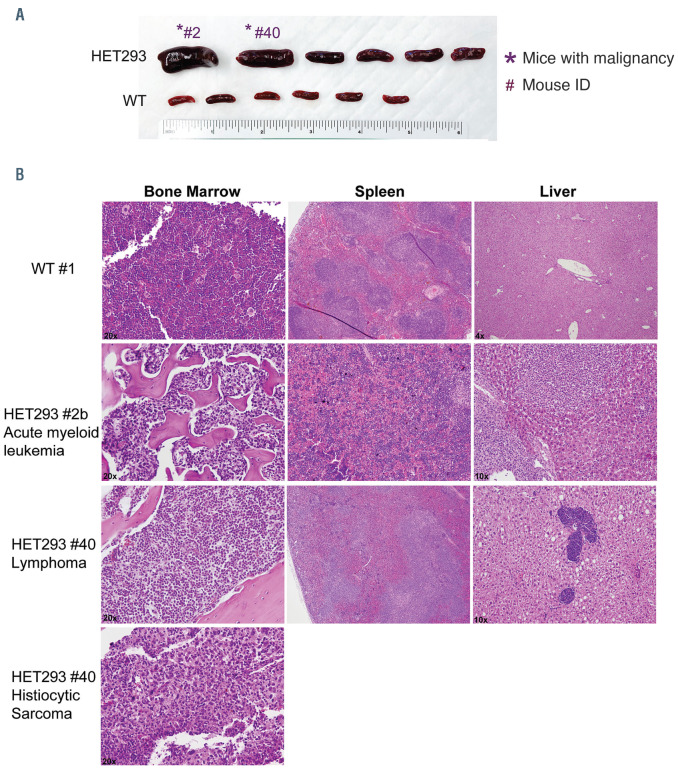
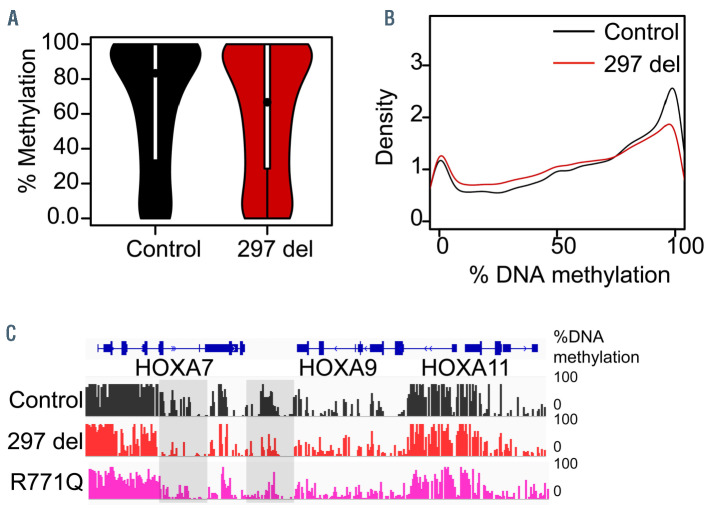
Tatton-Brown-Rahman syndrome (TBRS) is an overgrowth disorder caused by germline heterozygous mutations in the DNA methyltransferase DNMT3A. DNMT3A is a critical regulator of hematopoietic stem cell (HSC) differentiation and somatic DNMT3A mutations are frequent in hematologic malignancies and clonal hematopoiesis. Yet, the impact of constitutive DNMT3A mutation on hematopoiesis in TBRS is undefined. In order to establish how constitutive mutation of DNMT3A impacts blood development in TBRS we gathered clinical data and analyzed blood parameters in 18 individuals with TBRS. We also determined the distribution of major peripheral blood cell lineages by flow cytometric analyses. Our analyses revealed non-anemic macrocytosis, a relative decrease in lymphocytes and increase in neutrophils in TBRS individuals compared to unaffected controls. We were able to recapitulate these hematologic phenotypes in multiple murine models of TBRS and identified rare hematological and non-hematological malignancies associated with constitutive Dnmt3a mutation. We further show that loss of DNMT3A in TBRS is associated with an altered DNA methylation landscape in hematopoietic cells affecting regions critical to stem cell function and tumorigenesis. Overall, our data identify key hematopoietic effects driven by DNMT3A mutation with clinical implications for individuals with TBRS and DNMT3A-associated clonal hematopoiesis or malignancies.


Figures

Figure 1.
Figure 1.
DNMT3A mutations and deletions identified in patients with Tatton-Brown-Rahman syndrome. Map of DNMT3A variants identified in individuals with Tatton-Brown-Rahman syndrome (TBRS) based on clinical sequencing data from our patient cohort, published data, and information obtained from the TBRS community. AA: amino acid; PWWP: Pro-Trp-Trp-Pro motif domain; ADD: ATRX-DNMT3L-DNMT3L domain; Mtase: methyltransferase domain.
Figure 2.
Figure 2.
Blood of Tatton-Brown-Rahman syndrome individuals is characterized by relative increase in neutrophils, decrease in lymphocytes and non-anemic macrocytosis. Complete blood cell counts were performed on peripheral blood from Tatton-Brown-Rahman syndrome (TBRS) individuals (n=13) and unaffected controls (n=9) including (A) total white blood cell (WBC) count and WBC differential with percent of (B) neutrophils, (C) monocytes, and (D) lymphocytes. Red blood cell (RBC) indices were also compared including (E) hemoglobin, (F) total RBC number, (G) mean corpuscular volume (MCV), and (H) mean corpuscular hemoglobin concentration (MCHC). One TBRS individual had no available RBC count. MCV plotted by age for (I) TBRS males and (J) TBRS females including data from study CBC and from CBC data extracted from medical records for some individuals over multiple timepoints.
Figure 3.
Figure 3.
Immunophenotypic analysis of Tatton-Brown-Rahman syndrome individuals identifies neutrophil expansion and deficiencies in specific T- and B- cell subsets. Flow cytometry analysis was performed on peripheral blood from Tatton-Brown-Rahman syndrome (TBRS) individuals (n=15) and unaffected controls (n=10). Percent of leukocytes categorized by immunophenotype as (A) neutrophils, (B) B cells expressing CD10, CD19, CD20 and/or CD22, (C) total CD3+ T cells and the percentage of CD3+ T cells that are CD4+ and CD8+. (D) Quantification of the CD4/CD8 ratio of controls versus TBRS individuals.
Figure 4.
Figure 4.
Tatton-Brown-Rahman syndrome mouse model characterized by myeloid expansion and increased frequency of hematopoietic stem and progenitor cells in the marrow. Complete blood cell counts performed on the blood of a representative cohort of mice with heterozygous in frame deletion of amino acid 293 of DNMT3A (HET293) (n=23) and wild-type (WT) littermate controls (n=31). All mice included in the analyses did not display hematologic malignancies. Displayed comparisons of (A) total white blood cell (WBC) count, (B) percentage of neutrophils and (C) percentage of lymphocytes. Flow cytometric analysis of peripheral blood CD45+ leukocytes depicting (D) relative distribution of myeloid (defined as cells expressing CD11b and/or Ly6G), T cells (defined as CD3 and CD4+ and/or CD8+ cells) and B cells (defined as B220+ cells) in the HET293 mice compared to WT. Quantification of the percentage of (E) myeloid and (F) B cells in the HET293 mice and WT mice as determined by flow cytometry from (D). (G) Analysis of the different subtypes of CD11b+ myeloid cells into neutrophils (Ly6G expressing cells) or monocytes (Ly6C expressing cells). Flow cytometric analysis of bone marrow CD45+ leukocytes depicting H) relative distribution of myeloid, T cells and B cells in the HET293 mice compared to WT. Quantification of the percentage of I) myeloid and J) B cells in the HET293 mice and WT mice as determined by flow cytometry. Bone marrow flow cytometry assessment of HET293 and WT mice showing the percent of (K) hematopoietic stem/progenitor cells defined by SLAM markers and (L) multipotent progenitor (MPP) cells.
Figure 5.
Figure 5.
Differences in lymphoid and erythroid compartments in Tatton-Brown-Rahman syndrome mouse model. Quantification of the proportion of B220+ splenic B cells that are (A) T1 B cells expressing immunglobulin (Ig) M and intermediate levels of IgD and (B) T2 B cells expressing both IgM and IgD in HET293 mice (n=19) and wild-type (WT) littermates (n=20). From complete blood cell counts performed on peripheral blood, comparison of (C) red blood cell (RBC) number, (D) mean corpuscular volume (MCV), and (E) mean corpuscular hemoglobin concentration (MCHC) of WT mice (n=29) and HET293 mice (n=24). (F) Flow cytometric gating strategy for assessment of the erythroid development for representative WT and HET293 mice. Viable cells were gated based on their TER119 expression and then TER119+ cells were plotted by forward scatter and CD71 expression levels to identify erythroblasts in different developmental stages (Ery A-C). (G) Top: the total proportion of TER119 and proerythroblasts (ProE) cells. Bottom: the proportion of the indicated populations within the TER119+ fraction defined by CD71 and FSC (n=18) and HET293 mice (n=16).
Figure 6.
Figure 6.
Development of hematologic malignancies in Tatton-Brown-Rahman syndrome mouse model. A subset of the HET293 mice had hematologic malignancies at 15 months of age. These mice were noted to have (A) enlarged spleens relative to wild-type (WT) and HET293 mice without malignancies. (B) Pathologic evaluation of the bone marrow, spleen and liver of a WT mouse (WT #1, top row), a HET293 mouse with acute myeloid leukemia noted in the bone marrow, spleen and liver (HET293 2b, second row), and a HET293 with T-cell lymphoma in the bone marrow, spleen and liver (HET293 #40, third row) and focal histiocytic sarcoma in the bone marrow (HET293 #40, bottom image).
Figure 7.
Figure 7.
Altered DNA methylation in enhancer regions of hematopoietic cells of a Tatton-Brown-Rahman syndrome individual. Whole genome bisulfite sequencing was performed on a lymphoblastoid cell line (LCL) derived from a Tatton-Brown-Rahman syndrome (TBRS) individual with a heterozygous deletion of amino acid 297 in the PWWP domain of DNMT3A (297 del) and an LCL derived from the unaffected sibling of an individual with TBRS (control). (A) Overall % CpG methylation of control and 297 del LCL. (B) Plot represents density of DNA CpG methylation of enhancer regions in control and 297 del LCL. (C) Genome browser tracks of CpG methylation at the HOXA locus of the control and 297 del LCL compared to a previously published DNMT3A p.R771Q mutant LCL.

Similar articles

Cited by

References

    1. Tatton-Brown K, Zachariou A, Loveday C, et al. . The Tatton-Brown-Rahman syndrome: a clinical study of 55 individuals with de novo constitutive DNMT3A variants. Wellcome Open Res. 2018;3:46. - PMC - PubMed
    1. Tatton-Brown K, Seal S, Ruark E, et al. . Mutations in the DNA methyltransferase gene DNMT3A cause an overgrowth syndrome with intellectual disability. Nat Genet. 2014;46(4):385-388. - PMC - PubMed
    1. Challen GA, Sun D, Jeong M, et al. . Dnmt3a is essential for hematopoietic stem cell differentiation. Nat Genet. 2011;44(1):23-31. - PMC - PubMed
    1. Yang L, Rau R, Goodell MA. DNMT3A in haematological malignancies. Nat Rev Cancer. 2015;15(3):152-165. - PMC - PubMed
    1. Ley TJ, Ding L, Walter MJ, et al. . DNMT3A mutations in acute myeloid leukemia. N Engl J Med. 2010;363(25):2424-2433. - PMC - PubMed

Substances

LinkOut - more resources