

Evolution of dominance in gene expression pattern associated with phenotypic robustness
- PMID: 34092214
- PMCID: PMC8182915
- DOI: 10.1186/s12862-021-01841-6
Evolution of dominance in gene expression pattern associated with phenotypic robustness
Abstract
Background: Mendelian inheritance is a fundamental law of genetics. When we consider two genomes in a diploid cell, a heterozygote's phenotype is dominated by a particular homozygote according to the law of dominance. Classical Mendelian dominance is concerned with which proteins are dominant, and is usually based on simple genotype-phenotype relationship in which one gene regulates one phenotype. However, in reality, some interactions between genes can exist, resulting in deviations from Mendelian dominance. Whether and how Mendelian dominance is generalized to the phenotypes of gene expression determined by gene regulatory networks (GRNs) remains elusive.
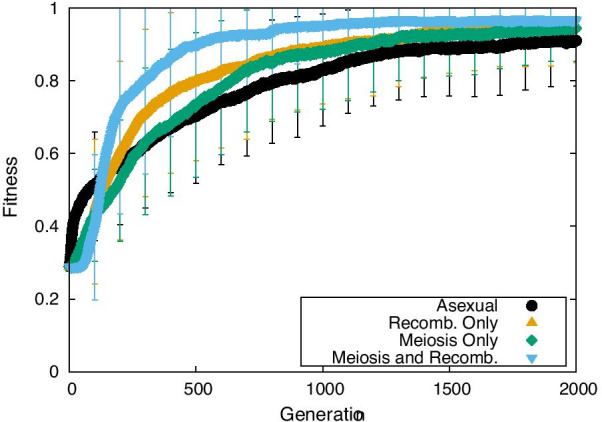
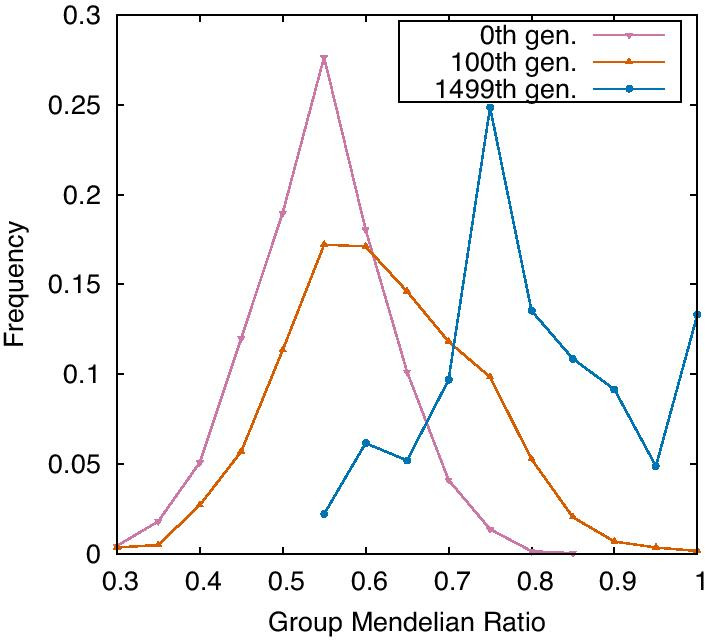
Results: Here, by using the numerical evolution of diploid GRNs, we discuss whether the dominance of phenotype evolves beyond the classical Mendelian case of one-to-one genotype-phenotype relationship. We examine whether complex genotype-phenotype relationship can achieve Mendelian dominance at the expression level by a pair of haplotypes through the evolution of the GRN with interacting genes. This dominance is defined via a pair of haplotypes that differ from each other but have a common phenotype given by the expression of target genes. We numerically evolve the GRN model for a diploid case, in which two GRN matrices are added to give gene expression dynamics and simulate evolution with meiosis and recombination. Our results reveal that group Mendelian dominance evolves even under complex genotype-phenotype relationship. Calculating the degree of dominance shows that it increases through the evolution, correlating closely with the decrease in phenotypic fluctuations and the increase in robustness to initial noise. We also demonstrate that the dominance of gene expression patterns evolves concurrently. This evolution of group Mendelian dominance and pattern dominance is associated with phenotypic robustness against meiosis-induced genome mixing, whereas sexual recombination arising from the mixing of genomes from the parents further enhances dominance and robustness. Due to this dominance, the robustness to genetic differences increases, while optimal fitness is sustained to a significant difference between the two genomes.
Conclusion: Group Mendelian dominance and gene-expression pattern dominance are achieved associated with the increase in phenotypic robustness to noise.
Keywords: Diploid; Evolution; Gene regulatory network; Mendelian dominance; Robustness; Theoretical model.
Conflict of interest statement
None of the authors have any competing interests to declare.
Figures


Similar articles
-
Heterosis of fitness and phenotypic variance in the evolution of a diploid gene regulatory network.PNAS Nexus. 2022 Jun 29;1(3):pgac097. doi: 10.1093/pnasnexus/pgac097. eCollection 2022 Jul. PNAS Nexus. 2022. PMID: 36741431 Free PMC article.
-
Evolution of phenotypic fluctuation under host-parasite interactions.PLoS Comput Biol. 2021 Nov 9;17(11):e1008694. doi: 10.1371/journal.pcbi.1008694. eCollection 2021 Nov. PLoS Comput Biol. 2021. PMID: 34752445 Free PMC article.
-
Evolution of robustness to noise and mutation in gene expression dynamics.PLoS One. 2007 May 9;2(5):e434. doi: 10.1371/journal.pone.0000434. PLoS One. 2007. PMID: 17502916 Free PMC article.
-
The integrative biology of genetic dominance.Biol Rev Camb Philos Soc. 2021 Dec;96(6):2925-2942. doi: 10.1111/brv.12786. Epub 2021 Aug 12. Biol Rev Camb Philos Soc. 2021. PMID: 34382317 Free PMC article. Review.
-
Mechanisms of Mendelian dominance.Clin Genet. 2018 Mar;93(3):419-428. doi: 10.1111/cge.13107. Epub 2017 Oct 26. Clin Genet. 2018. PMID: 28755412 Review.
Cited by
-
Heterosis of fitness and phenotypic variance in the evolution of a diploid gene regulatory network.PNAS Nexus. 2022 Jun 29;1(3):pgac097. doi: 10.1093/pnasnexus/pgac097. eCollection 2022 Jul. PNAS Nexus. 2022. PMID: 36741431 Free PMC article.
-
Unifying framework explaining how parental regulatory divergence can drive gene expression in hybrids and allopolyploids.Nat Commun. 2024 Oct 8;15(1):8714. doi: 10.1038/s41467-024-52546-5. Nat Commun. 2024. PMID: 39379366 Free PMC article.
References
-
- Mendel G. Versuche uber pflanzen-hybriden. Verhandlungen des naturforschenden Vereins in Brunn fur. 1866;4:3–47.
-
- Hartl DL. Essential genetics: a genomics perspective. Burlington: Jones & Bartlett Publishers; 2014.
-
- Falconer DS. Introduction to quantitative genetics. Delhi: Pearson Education India; 1996.
-
- Hartl DL, Clark AG. Principles of population genetics. Sunderland: Sinauer associates Sunderland; 1997.
Publication types
MeSH terms
LinkOut - more resources
Full Text Sources
Miscellaneous